PERT Chart: Definition, How to Make One, and Examples
Turn this article into takeaways for your work.
Each assistant summarizes the article only for you and suggests best practices for your work.
A PERT chart is a network diagram that maps every task in a project, the dependencies between those tasks, and a probabilistic time estimate for each one. Project teams use it when they can't pin down exact durations but still need a realistic schedule they can defend to stakeholders.
What is a PERT chart?
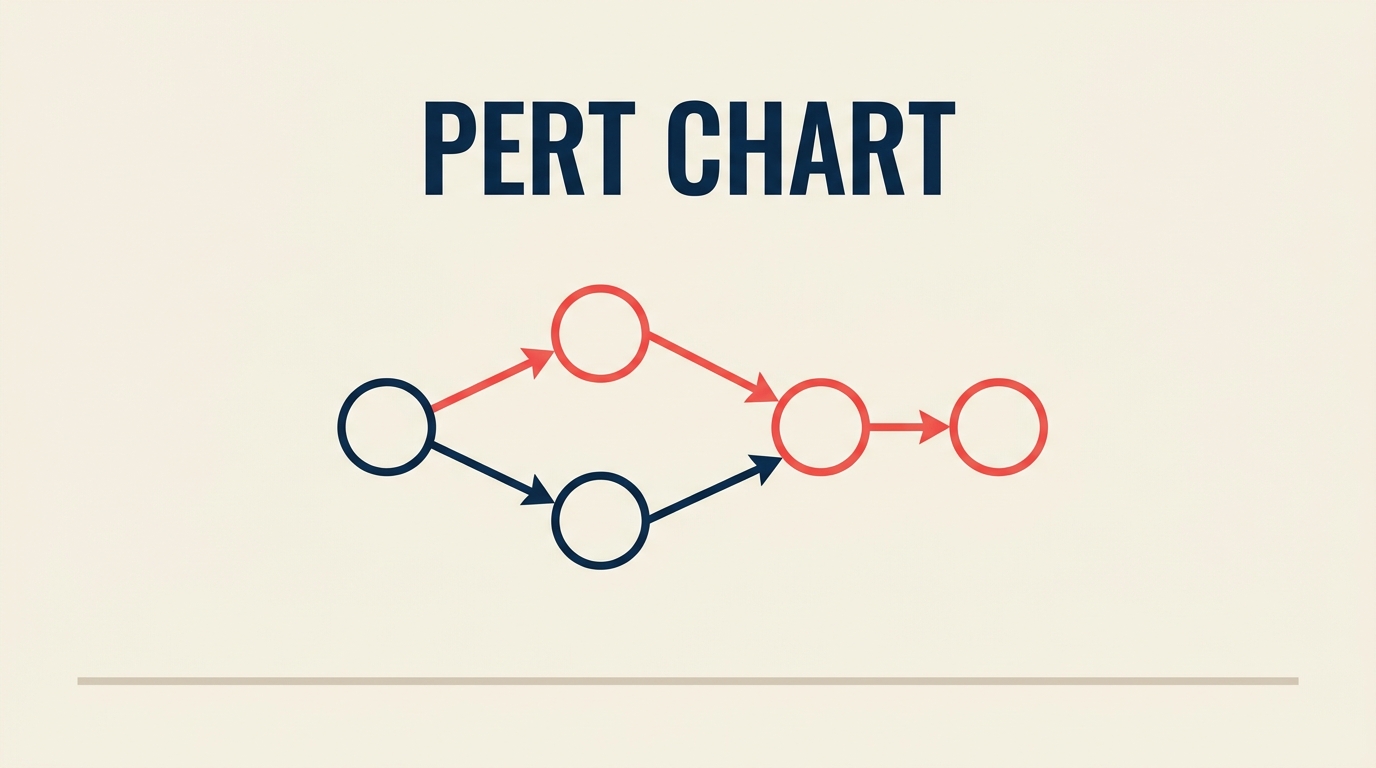
A PERT chart (Program Evaluation and Review Technique) is a visual project planning tool that represents tasks as nodes and dependencies as arrows, using three time estimates per task to account for uncertainty. It was developed in 1958 by the U.S. Navy's Special Projects Office and consulting firm Booz Allen Hamilton to manage the Polaris submarine-launched ballistic missile program, one of the most complex engineering efforts of the Cold War. The Navy needed a way to coordinate thousands of contractors with wildly different confidence levels in their timelines.
The method spread quickly into aerospace, construction, and software development. Today it sits alongside flowcharts and business process management tools as a foundational technique for anyone who needs to model uncertainty in a schedule.
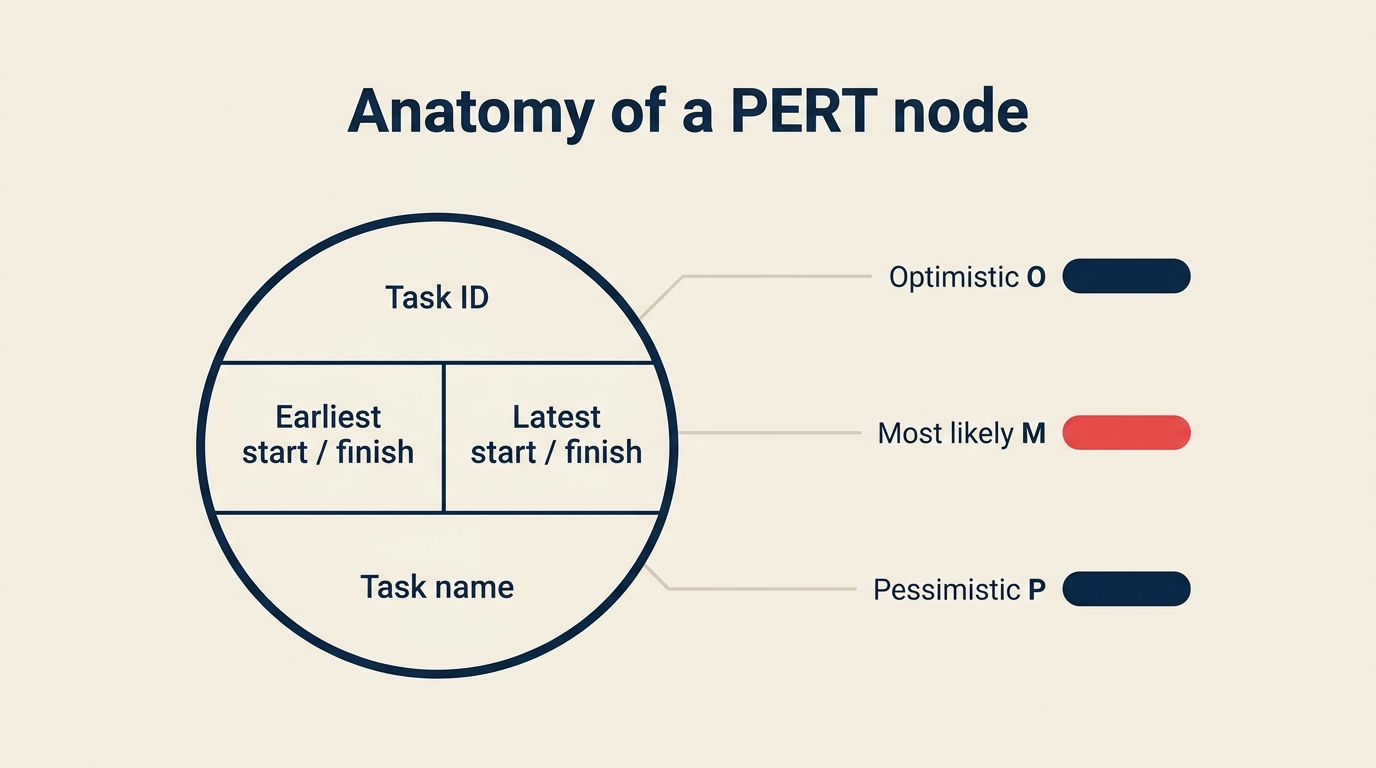
Key terms:
- Node (or event): a circle or rectangle representing a milestone or task
- Arrow (or activity): a directed line showing sequence and dependency
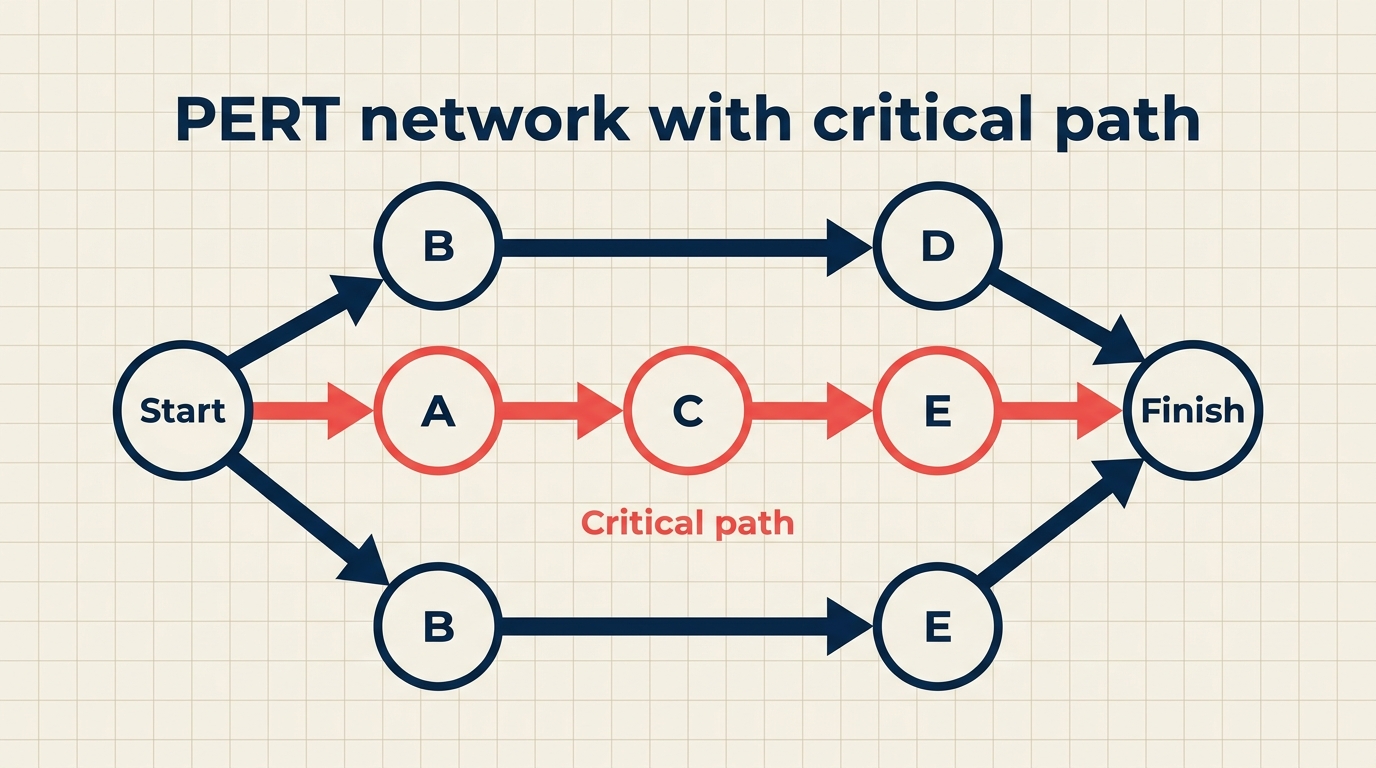
- Critical path: the longest path through the network; any delay on it delays the whole project
- Float (slack): the amount of time a task can slip without affecting the critical path
Key Facts
The original PERT program is credited with cutting the Polaris missile timeline by an estimated 2 years (U.S. Navy, 1958). PMI's 2024 Pulse of the Profession found that organizations waste an average of $97 million for every $1 billion invested due to poor project performance, with schedule overruns cited among the top root causes. Gartner forecasts the global project management software market will surpass $9.8 billion by 2027, driven in part by demand for probabilistic scheduling features.
PERT chart vs Gantt chart vs critical path method vs network diagram
These four terms overlap in practice but mean different things. Here's a side-by-side:
| Tool | Primary view | Time estimates | Handles uncertainty | Best for |
|---|---|---|---|---|
| PERT chart | Network (nodes + arrows) | Three-point (O, M, P) | Yes | R&D, first-time projects |
| Gantt chart | Timeline (bars on a calendar) | Single fixed estimate | No | Recurring, predictable projects |
| Critical Path Method (CPM) | Network (nodes + arrows) | Single fixed estimate | No | Construction, manufacturing |
| Network diagram | Network (nodes + arrows) | Any or none | Depends on input | General dependency mapping |
PERT and CPM use the same network structure but differ in one crucial way: CPM assumes deterministic durations; PERT accepts a range. For brand-new projects where no historical data exists, PERT is the more honest tool. For waterfall methodology projects with well-known task types, CPM or a Gantt chart is usually simpler.
The 3-point time estimate formula
PERT's defining feature is the three-point estimate. Instead of asking "how long will this take?", you ask three questions:
- O (Optimistic): the shortest possible duration if everything goes right
- M (Most likely): the realistic duration under normal conditions
- P (Pessimistic): the longest plausible duration if things go wrong
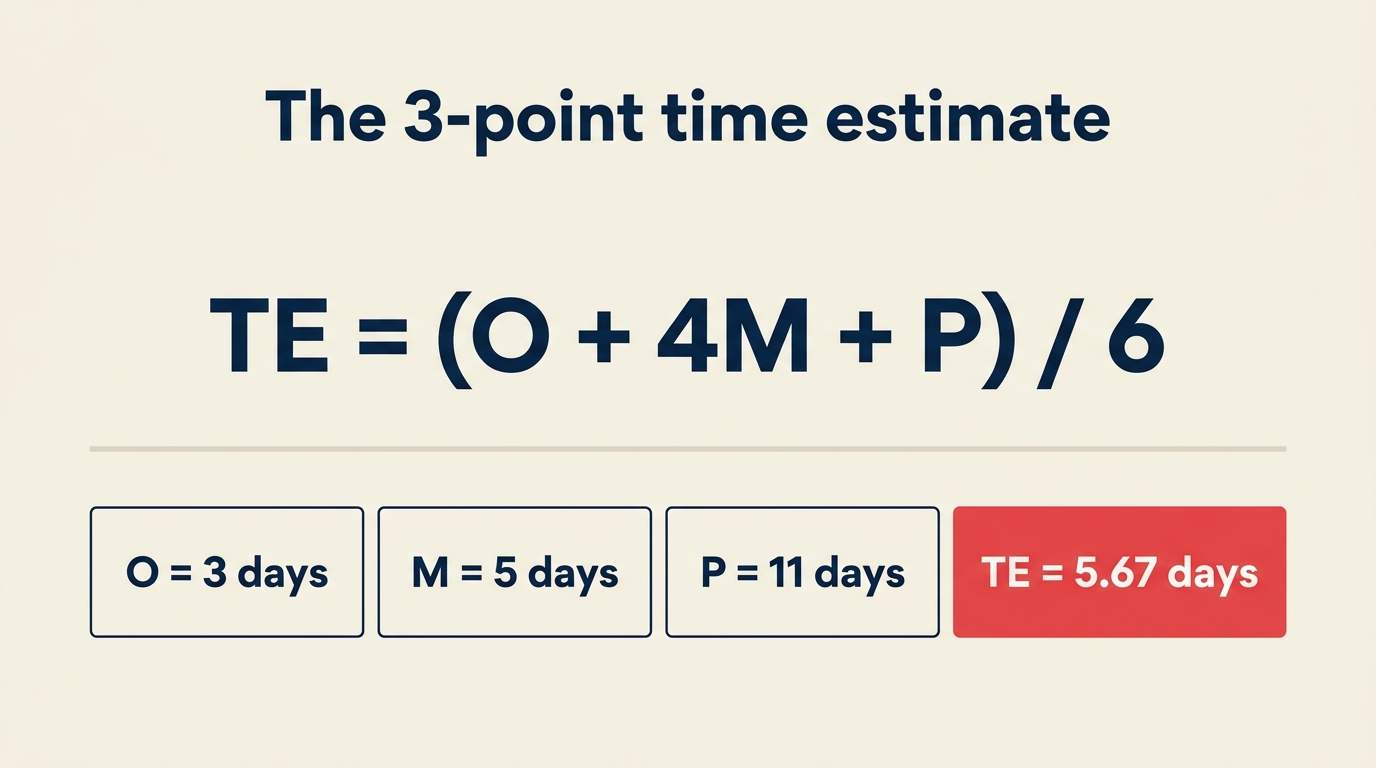
The expected time (TE) is a weighted average that places four times more weight on the most-likely estimate:
TE = (O + 4M + P) / 6
The standard deviation (SD) tells you how spread out the range is:
SD = (P - O) / 6
Worked example:
Say you're estimating a code review task. Your team thinks:
- Optimistic: 3 days (reviewer has no questions)
- Most likely: 5 days (a few comment threads, normal back-and-forth)
- Pessimistic: 11 days (major architectural concerns raised)
Plugging in:
TE = (3 + 4×5 + 11) / 6 = (3 + 20 + 11) / 6 = 34 / 6 = 5.67 days
SD = (11 - 3) / 6 = 8 / 6 = 1.33 days
So you'd plan for roughly 5.7 days with a spread of about 1.3 days. That's the number you enter on your network diagram for this task, not the naive guess of "five days" that ignores the pessimistic scenario.
How to build a PERT chart in 6 steps
Step 1: List all tasks
Write down every deliverable and activity needed to complete the project. Be specific enough that each item has a clear start and end. Use a work breakdown structure if the project is large.
- Start at the output (the final deliverable) and work backward
- Include review and approval steps, not just production work
- Keep tasks small enough that one person owns each one
Step 2: Identify dependencies
For each task, ask: "What must be finished before this can start?" Mark these predecessor relationships. Some tasks can run in parallel; others are strictly sequential.
- Use a simple table: Task | Predecessors
- Watch for circular dependencies (A needs B, B needs A) -- they signal a planning error
- Validate with the people doing the work, not just the project manager
Step 3: Estimate task times (O, M, P)
Ask the task owner -- or a small expert panel -- for three numbers: optimistic, most likely, and pessimistic. Calculate TE and SD for each task.
- Resist anchoring: get O and P before M to avoid narrowing the range prematurely
- If P is more than 3x O, the task probably needs to be broken into smaller pieces
- Document assumptions alongside the estimates
Step 4: Draw the network
Start at the left with a "Start" node. Add each task as a node and draw arrows from predecessors to successors. End at a "Finish" node. Label each arrow or node with the TE.
- Keep arrows flowing left to right
- Use parallel branches for concurrent tasks
- Software tools (Lucidchart, Microsoft Visio, ProjectLibre) handle layout automatically
Step 5: Calculate the critical path
The critical path is the sequence of tasks with the longest total duration. Any slip on the critical path is a direct slip in the project end date.
To find it: add up TE for every possible path from Start to Finish. The path with the largest sum is critical. Tasks not on the critical path have float (the gap between their latest and earliest finish).
- Float = 0 on the critical path
- Positive float = schedule cushion on non-critical tasks
- Negative float = task is already behind schedule relative to the plan
Step 6: Update as the project moves
A PERT chart is a living document. When a task finishes early or late, recalculate TE for downstream tasks, recheck which path is longest, and update the team.
- Re-run the critical path calculation any time a major task slips more than one SD
- Compare actual durations against O/M/P estimates to calibrate future projects
- Archive completed estimates -- they become your "M" inputs for similar future work
Benefits and limitations of PERT charts
Benefits:
- Forces explicit conversation about uncertainty before work begins
- Surfaces the critical path, so teams know where to focus risk management
- Works well for novel or research-heavy projects with no historical baselines
- The three-point estimate is statistically grounded, not just a gut feel
- Connects naturally to project management competency frameworks that require risk-adjusted scheduling
Limitations:
- Time-intensive to set up on projects with hundreds of tasks
- Requires honest estimates; if teams low-ball pessimistic numbers, the model is worthless
- Does not show resource allocation or cost -- pair it with a Gantt for that
- The formula assumes a beta distribution, which may not match real-world task behavior
- Maintaining a large PERT network manually is error-prone; software is nearly mandatory above 20 tasks
PERT chart examples
Example 1: Software release
A small team is shipping a new feature. Here's their PERT estimate table:
| Task | Predecessors | O (days) | M (days) | P (days) | TE (days) |
|---|---|---|---|---|---|
| A: Requirements sign-off | -- | 1 | 2 | 5 | 2.33 |
| B: UI design | A | 2 | 4 | 8 | 4.33 |
| C: Backend development | A | 3 | 6 | 12 | 6.50 |
| D: Frontend development | B | 2 | 4 | 9 | 4.50 |
| E: Integration + QA | C, D | 2 | 5 | 10 | 5.33 |
| F: Staging deploy + UAT | E | 1 | 2 | 4 | 2.17 |
Paths:
- A - B - D - E - F = 2.33 + 4.33 + 4.50 + 5.33 + 2.17 = 18.66 days
- A - C - E - F = 2.33 + 6.50 + 5.33 + 2.17 = 16.33 days
Critical path: A - B - D - E - F at 18.66 days. The backend task (C) has 2.33 days of float.
Example 2: Office construction phase
A facilities team is fitting out a new floor:
| Task | Predecessors | O (days) | M (days) | P (days) | TE (days) |
|---|---|---|---|---|---|
| A: Permits approved | -- | 5 | 10 | 20 | 10.83 |
| B: Demolition | A | 2 | 3 | 6 | 3.33 |
| C: Electrical rough-in | B | 3 | 5 | 9 | 5.33 |
| D: HVAC install | B | 4 | 7 | 14 | 7.67 |
| E: Drywall + finishing | C, D | 3 | 6 | 10 | 6.17 |
| F: Furnishing + IT setup | E | 2 | 4 | 7 | 4.17 |
Paths:
- A - B - C - E - F = 10.83 + 3.33 + 5.33 + 6.17 + 4.17 = 29.83 days
- A - B - D - E - F = 10.83 + 3.33 + 7.67 + 6.17 + 4.17 = 32.17 days
Critical path: A - B - D - E - F at 32.17 days. Electrical (C) has 2.34 days of float.
PERT vs CPM in practice
PERT and CPM are siblings, not competitors. Use PERT when:
- The project is novel and estimates carry high uncertainty (R&D, first-time events, software greenfield)
- You want to communicate a range to stakeholders, not just a single date
- The team has experts who can generate credible O, M, P estimates
Switch to CPM when:
- You have solid historical data for task durations (repeat construction projects, manufacturing runs)
- Simplicity matters -- a single-point estimate is easier to explain to non-technical sponsors
- You're integrating with resource-leveling or cost-tracking tools that expect deterministic inputs
Many teams use both: PERT during the planning phase to set the schedule, then CPM as the project moves into execution and actuals replace estimates. A solid RACI matrix and a Kanban board work alongside PERT to keep ownership and daily work visible without cluttering the network diagram.
Frequently asked questions
What does PERT stand for? PERT stands for Program Evaluation and Review Technique. The name reflects its origins in program management, where "program" meant a large government initiative spanning many contracts and organizations.
Who invented the PERT chart? PERT was developed in 1958 by the U.S. Navy's Special Projects Office, working with management consultants at Booz Allen Hamilton and Lockheed. The primary development team included Willard Fazar and D.G. Malcolm. It was created specifically for the Polaris Fleet Ballistic Missile program.
Is PERT still used today? Yes, though it's less common as a standalone tool. Many project management platforms embed PERT-style three-point estimation in their scheduling engines without calling it "PERT." Defense, aerospace, and large infrastructure projects still use it explicitly. In software, it appears in some Agile estimation techniques (three-point story points) and in formal risk models.
What's the difference between PERT and Gantt? A Gantt chart plots tasks on a calendar timeline with bars showing duration. A PERT chart shows tasks as nodes in a network, emphasizing sequence and dependencies rather than calendar dates. Gantt is better for day-to-day tracking; PERT is better for planning under uncertainty and finding the critical path.
What software can build a PERT chart? Most dedicated project management tools support PERT-style network views: Microsoft Project, Lucidchart, Smartsheet, ProjectLibre (open source), and OmniPlan. General diagramming tools like draw.io or Miro let you build PERT networks manually. Spreadsheets (Excel, Google Sheets) work for small networks when combined with a formula column for TE.
Closing
Schedule uncertainty isn't a problem you can wish away. A PERT chart forces the conversation about what "done" could realistically look like under good conditions, normal conditions, and bad ones. That honesty, baked into a network diagram, is what lets teams commit to a date they can actually defend rather than one they simply hoped for. Start with a task list and three questions per task. The critical path will tell you where to focus the rest of your energy.

Senior Operations & Growth Strategist
On this page
- What is a PERT chart?
- Key Facts
- PERT chart vs Gantt chart vs critical path method vs network diagram
- The 3-point time estimate formula
- How to build a PERT chart in 6 steps
- Step 1: List all tasks
- Step 2: Identify dependencies
- Step 3: Estimate task times (O, M, P)
- Step 4: Draw the network
- Step 5: Calculate the critical path
- Step 6: Update as the project moves
- Benefits and limitations of PERT charts
- PERT chart examples
- Example 1: Software release
- Example 2: Office construction phase
- PERT vs CPM in practice
- Frequently asked questions
- Closing