Gráfico PERT: Definição, Como Fazer Um e Exemplos
Turn this article into takeaways for your work.
Each assistant summarizes the article only for you and suggests best practices for your work.
Um gráfico PERT é um diagrama de rede que mapeia cada tarefa de um projeto, as dependências entre essas tarefas e uma estimativa probabilística de tempo para cada uma. As equipes de projeto o utilizam quando não conseguem determinar durações exatas, mas ainda precisam de um cronograma realista que possam defender perante as partes interessadas.
O que é um gráfico PERT?
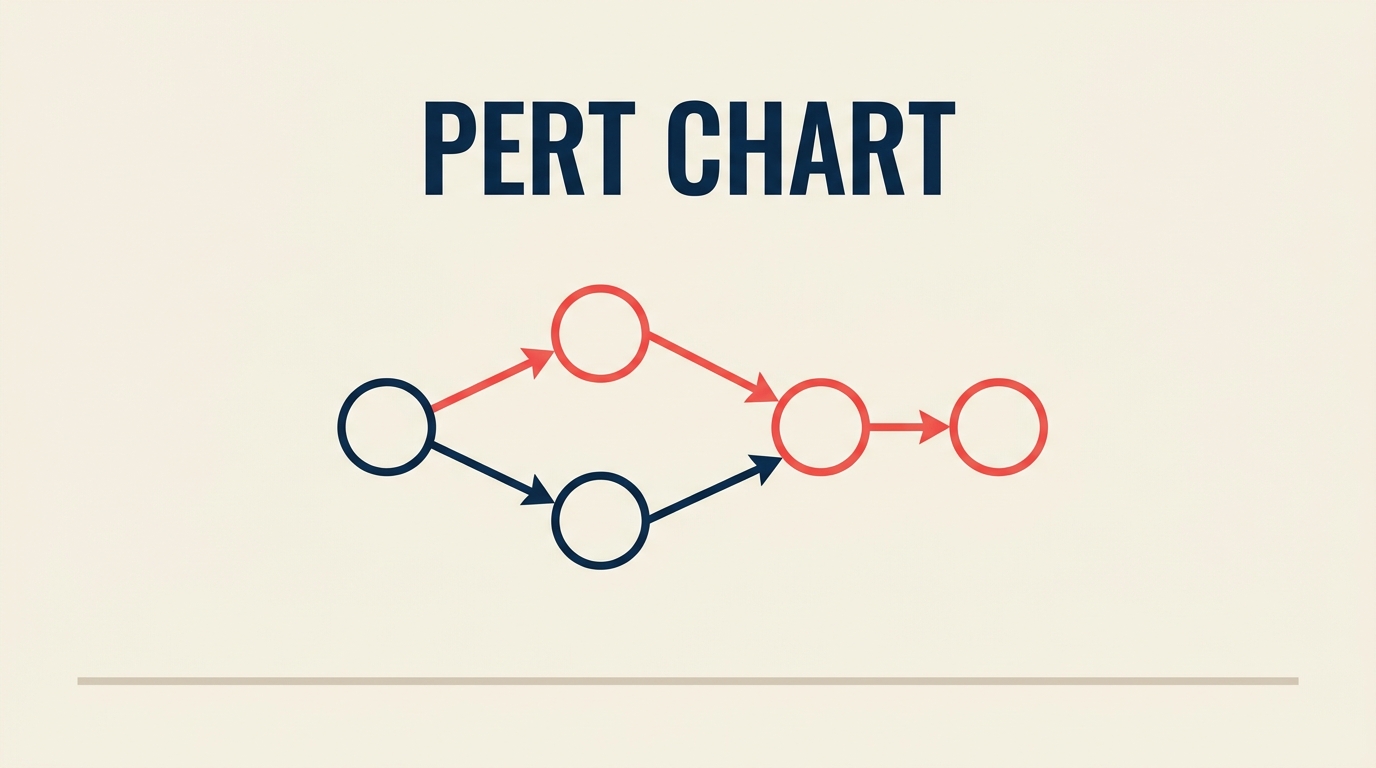
Um gráfico PERT (Program Evaluation and Review Technique) é uma ferramenta visual de planejamento de projetos que representa tarefas como nós e dependências como setas, usando três estimativas de tempo por tarefa para lidar com a incerteza. Foi desenvolvido em 1958 pelo Escritório de Projetos Especiais da Marinha dos EUA e pela consultoria Booz Allen Hamilton para gerenciar o programa do míssil balístico lançado por submarinos Polaris, um dos esforços de engenharia mais complexos da Guerra Fria. A Marinha precisava de uma forma de coordenar milhares de empreiteiros com níveis de confiança muito diferentes em seus cronogramas.
O método se difundiu rapidamente para a indústria aeroespacial, construção civil e desenvolvimento de software. Hoje, está ao lado de fluxogramas e ferramentas de gestão de processos de negócio como uma técnica fundamental para qualquer pessoa que precise modelar incertezas em um cronograma.
Termos-chave:
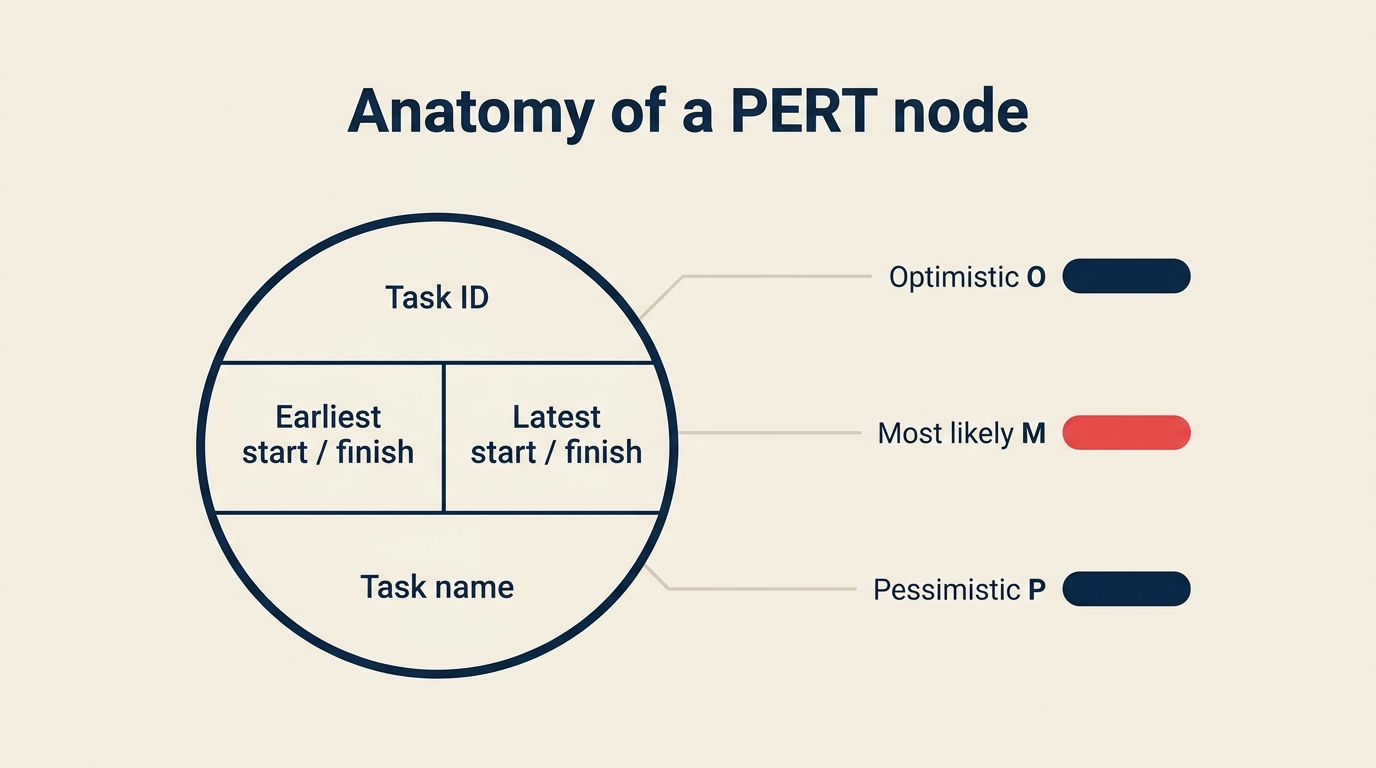
- Nó (ou evento): um círculo ou retângulo que representa um marco ou tarefa
- Seta (ou atividade): uma linha direcionada que mostra sequência e dependência
- Caminho crítico: o caminho mais longo pela rede; qualquer atraso nele atrasa todo o projeto
- Folga (Float): o tempo que uma tarefa pode atrasar sem afetar o caminho crítico
Fatos Relevantes
O programa PERT original é creditado com a redução do cronograma do míssil Polaris em aproximadamente 2 anos (Marinha dos EUA, 1958). O PMI Pulse of the Profession 2024 constatou que as organizações desperdiçam em média US$ 97 milhões para cada US$ 1 bilhão investido devido ao baixo desempenho dos projetos, com estouros de prazo citados entre as principais causas raiz. O Gartner prevê que o mercado global de software de gerenciamento de projetos superará US$ 9,8 bilhões até 2027, impulsionado em parte pela demanda por recursos de agendamento probabilístico.
Gráfico PERT vs. gráfico de Gantt vs. método do caminho crítico vs. diagrama de rede
Esses quatro termos se sobrepõem na prática, mas significam coisas diferentes. Veja uma comparação:
| Ferramenta | Visualização principal | Estimativas de tempo | Lida com incerteza | Ideal para |
|---|---|---|---|---|
| Gráfico PERT | Rede (nós + setas) | Três pontos (O, M, P) | Sim | P&D, projetos inéditos |
| Gráfico de Gantt | Cronograma (barras em um calendário) | Estimativa única e fixa | Não | Projetos recorrentes e previsíveis |
| Método do Caminho Crítico (CPM) | Rede (nós + setas) | Estimativa única e fixa | Não | Construção civil, manufatura |
| Diagrama de rede | Rede (nós + setas) | Qualquer ou nenhuma | Depende dos dados | Mapeamento geral de dependências |
O PERT e o CPM usam a mesma estrutura de rede, mas diferem em um aspecto fundamental: o CPM assume durações determinísticas; o PERT aceita uma faixa. Para projetos completamente novos, onde não existem dados históricos, o PERT é a ferramenta mais honesta. Para projetos com metodologia Waterfall com tipos de tarefas bem conhecidos, o CPM ou um gráfico de Gantt geralmente é mais simples.
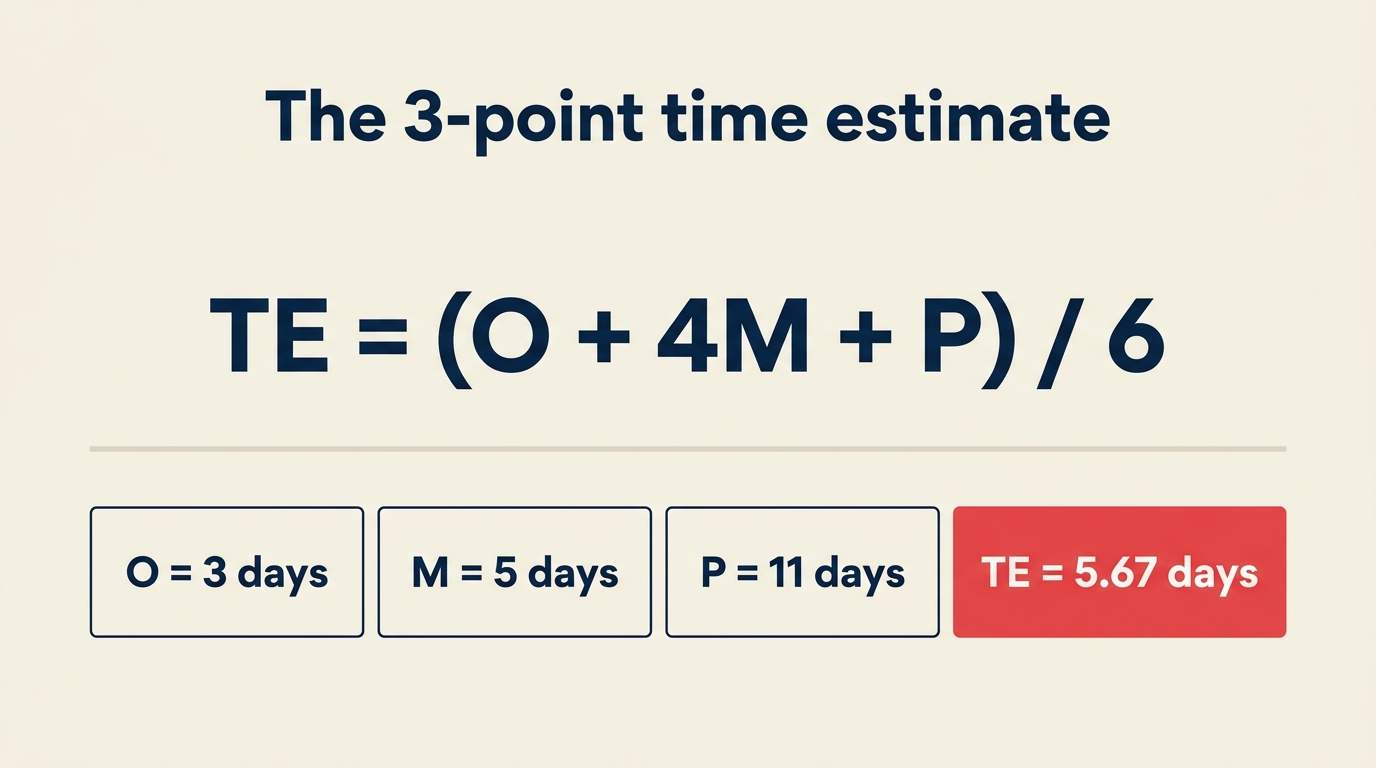
A fórmula de estimativa de três pontos
A característica definidora do PERT é a estimativa de três pontos. Em vez de perguntar "quanto tempo isso vai levar?", você faz três perguntas:
- O (Otimista): a duração mais curta possível se tudo correr bem
- M (Mais provável): a duração realista em condições normais
- P (Pessimista): a duração mais longa plausível se as coisas derem errado
O tempo esperado (TE) é uma média ponderada que atribui quatro vezes mais peso à estimativa mais provável:
TE = (O + 4M + P) / 6
O desvio padrão (DP) indica o quanto a faixa está dispersa:
DP = (P - O) / 6
Exemplo prático:
Imagine que você está estimando uma tarefa de revisão de código. Sua equipe acha:
- Otimista: 3 dias (o revisor não tem perguntas)
- Mais provável: 5 dias (alguns comentários, vai-e-vem normal)
- Pessimista: 11 dias (grandes preocupações arquiteturais levantadas)
Aplicando a fórmula:
TE = (3 + 4×5 + 11) / 6 = (3 + 20 + 11) / 6 = 34 / 6 = 5,67 dias
DP = (11 - 3) / 6 = 8 / 6 = 1,33 dias
Então você planejaria aproximadamente 5,7 dias com uma margem de cerca de 1,3 dias. Esse é o número que você insere no seu diagrama de rede para essa tarefa, não o chute ingênuo de "cinco dias" que ignora o cenário pessimista.
Como construir um gráfico PERT em 6 passos
Passo 1: Liste todas as tarefas
Escreva cada entregável e atividade necessária para concluir o projeto. Seja específico o suficiente para que cada item tenha um início e um fim claros. Use uma estrutura analítica do projeto se o projeto for grande.
- Comece pela saída (o entregável final) e trabalhe de trás para frente
- Inclua etapas de revisão e aprovação, não apenas o trabalho de produção
- Mantenha as tarefas pequenas o suficiente para que uma pessoa seja responsável por cada uma
Passo 2: Identifique as dependências
Para cada tarefa, pergunte: "O que deve ser concluído antes que esta possa começar?" Marque essas relações de predecessora. Algumas tarefas podem correr em paralelo; outras são estritamente sequenciais.
- Use uma tabela simples: Tarefa | Predecessoras
- Fique atento a dependências circulares (A precisa de B, B precisa de A) -- elas indicam um erro de planejamento
- Valide com as pessoas que farão o trabalho, não apenas com o gerente de projeto
Passo 3: Estime os tempos das tarefas (O, M, P)
Pergunte ao responsável pela tarefa (ou a um pequeno painel de especialistas) três números: otimista, mais provável e pessimista. Calcule TE e DP para cada tarefa.
- Evite ancoragem: obtenha O e P antes de M para não restringir a faixa prematuramente
- Se P for mais de 3 vezes maior que O, a tarefa provavelmente precisa ser dividida em partes menores
- Documente as premissas junto às estimativas
Passo 4: Desenhe a rede
Comece à esquerda com um nó "Início". Adicione cada tarefa como um nó e desenhe setas dos predecessores aos sucessores. Termine com um nó "Fim". Rotule cada seta ou nó com o TE.
- Mantenha as setas fluindo da esquerda para a direita
- Use ramificações paralelas para tarefas simultâneas
- Ferramentas de software (Lucidchart, Microsoft Visio, ProjectLibre) organizam o layout automaticamente
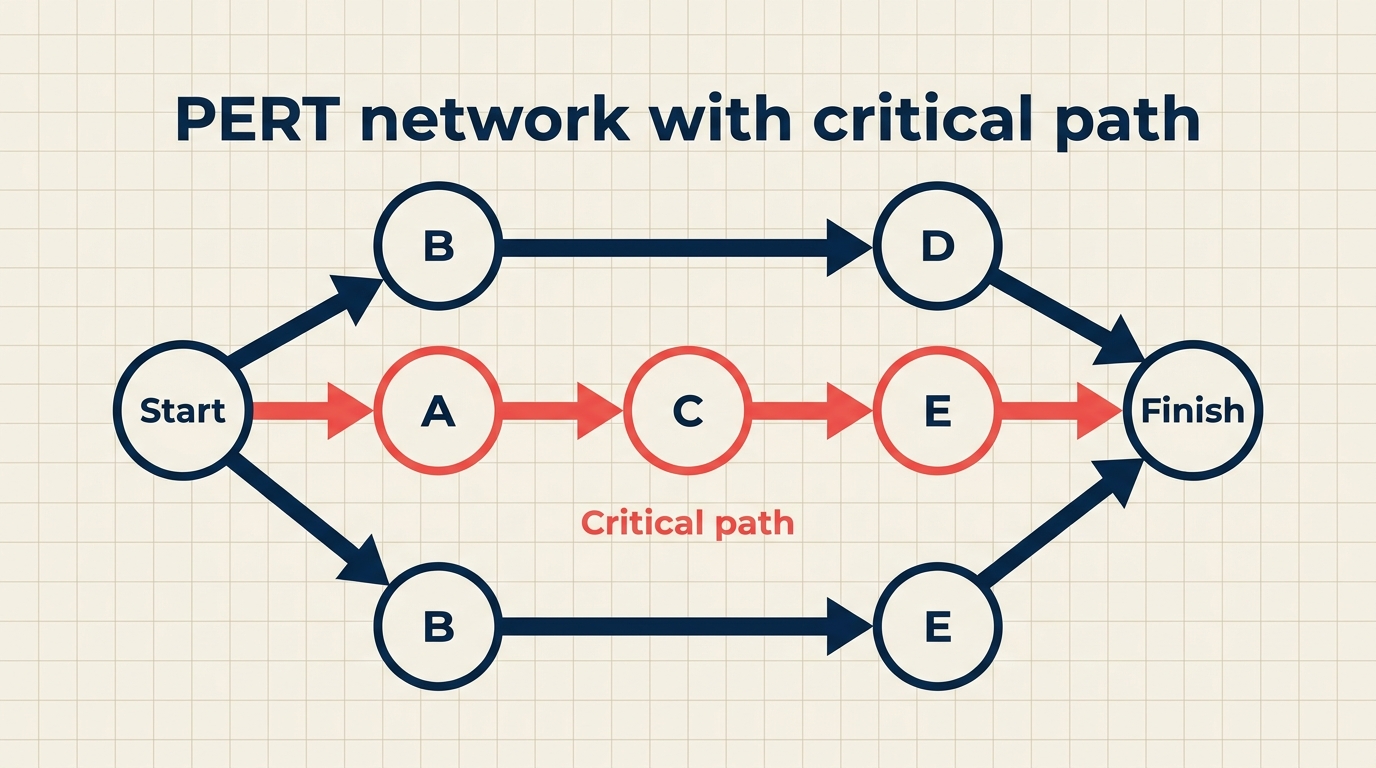
Passo 5: Calcule o caminho crítico
O caminho crítico é a sequência de tarefas com a maior duração total. Qualquer atraso no caminho crítico é um atraso direto na data de conclusão do projeto.
Para encontrá-lo: some o TE de cada caminho possível do Início ao Fim. O caminho com a maior soma é o crítico. As tarefas que não estão no caminho crítico têm Float (a diferença entre o término mais tardio e o mais antecipado).
- Float = 0 no caminho crítico
- Float positivo = margem de cronograma em tarefas não críticas
- Float negativo = a tarefa já está atrasada em relação ao plano
Passo 6: Atualize à medida que o projeto avança
Um gráfico PERT é um documento vivo. Quando uma tarefa termina antes ou depois do previsto, recalcule o TE das tarefas subsequentes, verifique novamente qual caminho é o mais longo e atualize o time.
- Refaça o cálculo do caminho crítico sempre que uma tarefa importante atrasar mais de 1 DP
- Compare as durações reais com as estimativas O/M/P para calibrar projetos futuros
- Arquive as estimativas concluídas, pois elas se tornam seus dados de entrada "M" para trabalhos futuros similares
Benefícios e limitações dos gráficos PERT
Benefícios:
- Força conversas explícitas sobre incerteza antes que o trabalho comece
- Revela o caminho crítico, para que as equipes saibam onde focar a gestão de riscos
- Funciona bem para projetos novos ou intensivos em pesquisa sem linhas de base históricas
- A estimativa de três pontos tem base estatística, não é apenas uma intuição
- Conecta-se naturalmente a frameworks de competência em gerenciamento de projetos que exigem agendamento ajustado ao risco
Limitações:
- Demorado para configurar em projetos com centenas de tarefas
- Exige estimativas honestas; se as equipes subestimam os números pessimistas, o modelo não tem valor
- Não mostra alocação de recursos ou custos; combine com um Gantt para isso
- A fórmula assume uma distribuição beta, que pode não corresponder ao comportamento real das tarefas
- Manter manualmente uma grande rede PERT é suscetível a erros; o software é quase obrigatório acima de 20 tarefas
Exemplos de gráfico PERT
Exemplo 1: Lançamento de software
Uma pequena equipe está lançando uma nova funcionalidade. Veja a tabela de estimativas PERT:
| Tarefa | Predecessoras | O (dias) | M (dias) | P (dias) | TE (dias) |
|---|---|---|---|---|---|
| A: Aprovação de requisitos | -- | 1 | 2 | 5 | 2,33 |
| B: Design de UI | A | 2 | 4 | 8 | 4,33 |
| C: Desenvolvimento backend | A | 3 | 6 | 12 | 6,50 |
| D: Desenvolvimento frontend | B | 2 | 4 | 9 | 4,50 |
| E: Integração + QA | C, D | 2 | 5 | 10 | 5,33 |
| F: Deploy em staging + UAT | E | 1 | 2 | 4 | 2,17 |
Caminhos:
- A - B - D - E - F = 2,33 + 4,33 + 4,50 + 5,33 + 2,17 = 18,66 dias
- A - C - E - F = 2,33 + 6,50 + 5,33 + 2,17 = 16,33 dias
Caminho crítico: A - B - D - E - F com 18,66 dias. A tarefa de backend (C) tem 2,33 dias de Float.
Exemplo 2: Fase de obra de um escritório
Uma equipe de infraestrutura está fazendo o acabamento de um novo andar:
| Tarefa | Predecessoras | O (dias) | M (dias) | P (dias) | TE (dias) |
|---|---|---|---|---|---|
| A: Alvarás aprovados | -- | 5 | 10 | 20 | 10,83 |
| B: Demolição | A | 2 | 3 | 6 | 3,33 |
| C: Instalação elétrica | B | 3 | 5 | 9 | 5,33 |
| D: Instalação de HVAC | B | 4 | 7 | 14 | 7,67 |
| E: Drywall + acabamentos | C, D | 3 | 6 | 10 | 6,17 |
| F: Mobiliário + configuração de TI | E | 2 | 4 | 7 | 4,17 |
Caminhos:
- A - B - C - E - F = 10,83 + 3,33 + 5,33 + 6,17 + 4,17 = 29,83 dias
- A - B - D - E - F = 10,83 + 3,33 + 7,67 + 6,17 + 4,17 = 32,17 dias
Caminho crítico: A - B - D - E - F com 32,17 dias. A parte elétrica (C) tem 2,34 dias de Float.
PERT vs. CPM na prática
PERT e CPM são métodos complementares, não concorrentes. Use o PERT quando:
- O projeto é inédito e as estimativas carregam alta incerteza (P&D, eventos pela primeira vez, software greenfield)
- Você quer comunicar uma faixa às partes interessadas, não apenas uma data única
- A equipe tem especialistas que conseguem gerar estimativas confiáveis de O, M, P
Passe para o CPM quando:
- Você tem dados históricos sólidos sobre durações de tarefas (projetos de construção repetitivos, linhas de manufatura)
- A simplicidade importa; uma estimativa de ponto único é mais fácil de explicar a patrocinadores não técnicos
- Você está integrando com ferramentas de nivelamento de recursos ou acompanhamento de custos que esperam dados determinísticos
Muitas equipes usam os dois: PERT durante a fase de planejamento para definir o cronograma, depois CPM à medida que o projeto entra em execução e os dados reais substituem as estimativas. Uma Matriz RACI sólida e um quadro Kanban funcionam junto ao PERT para manter a propriedade e o trabalho diário visíveis sem sobrecarregar o diagrama de rede.
Perguntas frequentes
O que significa PERT? PERT significa Program Evaluation and Review Technique (Técnica de Avaliação e Revisão de Programa). O nome reflete suas origens no gerenciamento de programas governamentais, onde "programa" designava uma grande iniciativa abrangendo muitos contratos e organizações.
Quem inventou o gráfico PERT? O PERT foi desenvolvido em 1958 pelo Escritório de Projetos Especiais da Marinha dos EUA, em parceria com consultores de gestão da Booz Allen Hamilton e da Lockheed. A equipe principal de desenvolvimento incluiu Willard Fazar e D.G. Malcolm. Foi criado especificamente para o programa de Mísseis Balísticos da Frota Polaris.
O PERT ainda é utilizado hoje? Sim, embora seja menos comum como ferramenta independente. Muitas plataformas de gerenciamento de projetos incorporam a estimativa de três pontos no estilo PERT em seus mecanismos de agendamento sem chamá-la de "PERT". Projetos de defesa, aeroespacial e grandes obras de infraestrutura ainda o utilizam explicitamente. No desenvolvimento de software, ele aparece em algumas técnicas de estimativa ágil (Story Points de três pontos) e em modelos formais de risco.
Qual é a diferença entre PERT e Gantt? Um gráfico de Gantt plota tarefas em um cronograma de calendário com barras mostrando duração. Um gráfico PERT mostra tarefas como nós em uma rede, enfatizando sequência e dependências em vez de datas de calendário. O Gantt é melhor para o acompanhamento diário; o PERT é melhor para planejamento em condições de incerteza e para encontrar o caminho crítico.
Qual software pode construir um gráfico PERT? A maioria das ferramentas dedicadas de gerenciamento de projetos suporta visualizações de rede no estilo PERT: Microsoft Project, Lucidchart, Smartsheet, ProjectLibre (código aberto) e OmniPlan. Ferramentas gerais de diagramação como draw.io ou Miro permitem construir redes PERT manualmente. Planilhas (Excel, Google Planilhas) funcionam para redes pequenas quando combinadas com uma coluna de fórmula para o TE.
Conclusão
A incerteza de cronograma não é um problema que você pode ignorar. Um gráfico PERT força a conversa sobre como seria o "concluído" de forma realista em condições favoráveis, normais e adversas. Essa honestidade, incorporada em um diagrama de rede, é o que permite às equipes se comprometer com uma data que podem realmente defender, em vez de uma que simplesmente esperavam alcançar. Comece com uma lista de tarefas e três perguntas por tarefa. O caminho crítico vai mostrar onde concentrar o restante das suas energias.

Senior Operations & Growth Strategist
On this page
- O que é um gráfico PERT?
- Fatos Relevantes
- Gráfico PERT vs. gráfico de Gantt vs. método do caminho crítico vs. diagrama de rede
- A fórmula de estimativa de três pontos
- Como construir um gráfico PERT em 6 passos
- Passo 1: Liste todas as tarefas
- Passo 2: Identifique as dependências
- Passo 3: Estime os tempos das tarefas (O, M, P)
- Passo 4: Desenhe a rede
- Passo 5: Calcule o caminho crítico
- Passo 6: Atualize à medida que o projeto avança
- Benefícios e limitações dos gráficos PERT
- Exemplos de gráfico PERT
- Exemplo 1: Lançamento de software
- Exemplo 2: Fase de obra de um escritório
- PERT vs. CPM na prática
- Perguntas frequentes
- Conclusão