DPMO e Nível Sigma: Como Medir a Qualidade do Processo
Turn this article into takeaways for your work.
Each assistant summarizes the article only for you and suggests best practices for your work.
DPMO (Defeitos Por Milhão de Oportunidades) é o número que informa exatamente quão confiável é o seu processo. Não "razoavelmente bom" ou "tivemos um trimestre difícil". Um único número, comparável entre qualquer processo, qualquer setor, qualquer tamanho de equipe.
A maioria das equipes de operações acompanha contagens de defeitos. Mas contagens brutas enganam. Uma fábrica que produz 100 unidades com 5 defeitos parece igual a um call center que atende 100 chamadas com 5 erros. Mas se a fábrica tem 10 pontos de checagem por unidade e o call center tem só 2 por chamada, seus níveis reais de qualidade são completamente diferentes. O DPMO corrige isso. Ele normaliza os defeitos pelo número de oportunidades em que um defeito poderia ocorrer, e depois escala para um milhão, para que os números continuem legíveis mesmo em ambientes de alta qualidade e baixo defeito.
Uma vez que você tenha o DPMO, pode convertê-lo em um nível sigma, que informa a quantos desvios-padrão seu processo está do limite de defeitos. Esse número sigma é o que permite comparar com padrões do setor e definir metas de qualidade significativas.
O Que É o DPMO?
DPMO (Defeitos Por Milhão de Oportunidades) é uma métrica de qualidade padronizada que conta quantos defeitos ocorreriam se um processo rodasse um milhão de vezes, ajustado pelo número de oportunidades de ocorrência de um defeito em cada unidade.
Três termos definem o cálculo:
- Defeito: qualquer output que não atenda a um requisito ou especificação do cliente. Uma peça arranhada, um endereço errado em uma etiqueta, um SLA perdido em um ticket de suporte.
- Unidade: um item sendo processado. Um produto, um documento, uma transação, uma ligação de cliente.
- Oportunidade: um ponto dentro de uma unidade em que um defeito pode ocorrer. Um formulário de pedido com 10 campos tem 10 oportunidades. Uma placa de circuito com 200 soldas tem 200.
O insight-chave é que o DPMO conta os pontos potenciais de falha, não apenas as falhas em si. Uma unidade complexa, com muitas etapas, tem muitas oportunidades, então um único defeito pesa menos do que pesaria em uma unidade mais simples. Essa equidade é o que torna o DPMO útil em diferentes processos.
O DPMO se conecta diretamente ao nível sigma, a classificação abreviada no Six Sigma. Um nível sigma mais alto significa menos defeitos por milhão de oportunidades. A meta Six Sigma de 3,4 DPMO corresponde a seis sigma.
Principais Dados
- O padrão Six Sigma tem como meta 3,4 DPMO, o que corresponde a um nível de qualidade de processo de 6 sigma. Esse número considera um deslocamento de 1,5 sigma, que engenheiros da Motorola constataram que processos reais sofrem ao longo do tempo. (Fonte: Motorola, 1986, quando Bill Smith formalizou a metodologia.)
- Um processo operando em 3 sigma produz aproximadamente 66.807 DPMO, o que significa que 6,7% dos outputs são defeituosos. Essa é a linha de base em que muitos fabricantes operam, sem saber, antes de iniciar programas formais de qualidade.
- Em 4 sigma, um processo produz aproximadamente 6.210 DPMO, ou 99,38% de outputs bons. Isso soa impressionante até você aplicá-lo a um hospital que faz 300.000 procedimentos por ano: 4 sigma significaria cerca de 1.863 erros por ano.
Como Calcular o DPMO
A fórmula é direta:
DPMO = (Defeitos / (Unidades x Oportunidades por Unidade)) x 1.000.000
Passo a passo com um exemplo real:
Suponha que sua equipe de contas a pagar processe 2.000 faturas por mês. Cada fatura tem 8 campos que poderiam conter um erro (nome do fornecedor, valor, número do PO, data, código fiscal, condições de pagamento, dados bancários, assinatura de aprovação). Sua equipe registra 48 erros neste mês.
- Defeitos: 48
- Unidades: 2.000
- Oportunidades por unidade: 8
- Total de oportunidades: 2.000 x 8 = 16.000
DPMO = (48 / 16.000) x 1.000.000 = 3.000
Um DPMO de 3.000 coloca essa equipe entre 4 e 5 sigma. É um desempenho sólido, mas ainda há espaço para melhorar em direção à meta de 3,4 DPMO.
Duas métricas relacionadas:
- DPU (Defeitos Por Unidade): total de defeitos dividido pelo total de unidades. No exemplo acima, DPU = 48 / 2.000 = 0,024. O DPU não considera a complexidade, então é menos útil para comparações entre processos.
- Taxa de defeitos: o DPU expresso em porcentagem. Aqui, 2,4% das faturas contêm ao menos um erro. Bom para relatórios em linguagem simples para stakeholders não técnicos.
Use o DPMO quando quiser fazer benchmarking ou comparação. Use a taxa de defeitos quando precisar explicar o número em uma revisão de negócios.
Conversão de DPMO para Nível Sigma
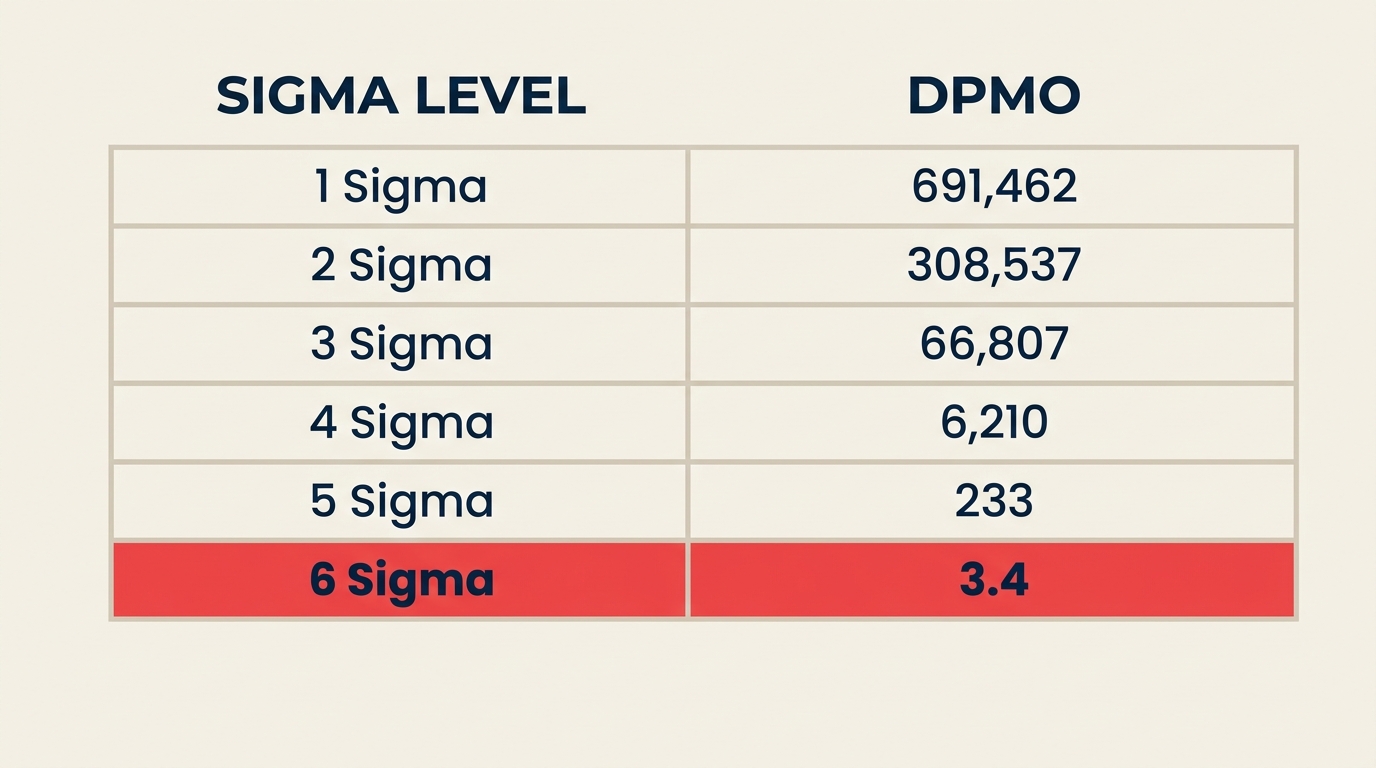
A tabela de conversão abaixo usa os valores padrão de curto prazo com o deslocamento de 1,5 sigma aplicado, que é a convenção da indústria estabelecida pela Motorola. Esse deslocamento considera a deriva natural que ocorre em processos reais ao longo do tempo.
| Nível Sigma | DPMO (aprox.) | Rendimento % |
|---|---|---|
| 1 sigma | 691.462 | 30,9% |
| 2 sigma | 308.538 | 69,1% |
| 3 sigma | 66.807 | 93,3% |
| 4 sigma | 6.210 | 99,38% |
| 5 sigma | 233 | 99,977% |
| 6 sigma | 3,4 | 99,9997% |
Algumas coisas se destacam nessa tabela. O salto de 3 sigma para 4 sigma corta o DPMO em mais de 90%. O salto de 5 para 6 sigma corta mais 98,5%. As melhorias no topo da escala são exponencialmente mais difíceis de alcançar e exponencialmente mais valiosas em processos de alto risco.
Em projetos DMAIC, a equipe calcula o DPMO de linha de base na fase Measure, e depois define uma meta específica de melhoria sigma na fase Improve. A tabela de conversão dá a essa meta um número de DPMO concreto para alcançar.
DPMO vs PPM vs DPU
Essas três métricas costumam ser usadas de forma intercambiável, mas medem coisas diferentes.
| Métrica | O que conta | Ajusta pela complexidade? | Melhor para |
|---|---|---|---|
| DPMO | Defeitos por milhão de oportunidades | Sim | Benchmarking entre processos |
| PPM (Peças Por Milhão) | Unidades defeituosas por milhão de unidades | Não | Manufatura simples com um único tipo de defeito |
| DPU (Defeitos Por Unidade) | Média de defeitos em cada unidade | Não | Acompanhamento interno, trabalho de causa raiz |
O PPM conta unidades defeituosas (unidades que têm pelo menos um defeito), enquanto o DPMO conta defeitos individuais em todas as oportunidades. Se uma única fatura tem três erros, o PPM conta isso como uma unidade defeituosa. O DPMO conta os três defeitos contra todas as oportunidades disponíveis.
Essa distinção importa. Em uma análise de capacidade do processo, você quer saber com que frequência seu processo falha no nível da tarefa, não apenas se uma unidade passou ou não. O DPMO dá a você essa resolução.
Por Que o Nível Sigma Importa
O nível sigma traduz o DPMO em um benchmark que a liderança pode usar para tomar decisões.
Benchmarking entre equipes e setores. Uma pontuação de 4 sigma significa a mesma coisa, seja você medindo um processo de implantação de software ou um fluxo de aprovação de empréstimo. Isso elimina o ruído das contagens absolutas de defeitos e dá a você um número comparável.
Custo da Má Qualidade (COPQ). Pesquisas de Joseph Juran e da American Society for Quality mostram consistentemente que organizações de sigma mais baixo gastam de 20 a 40% da receita corrigindo defeitos, retrabalho e falhas. Empresas que operam em 6 sigma costumam ter COPQ abaixo de 1% da receita. O nível sigma torna essa diferença de custo visível e quantificável.
Definição de metas. Quando uma equipe conhece seu nível sigma atual, pode definir uma meta de melhoria específica. "Reduzir o DPMO de 6.210 para 233" é um projeto. "Melhorar a qualidade" não é. O controle estatístico de processo e os gráficos de controle então dão a você a camada de monitoramento para verificar se a melhoria se sustenta.
Priorização de investimentos. Ir de 3 sigma para 4 sigma em um processo cirúrgico vale muito mais do que alcançar o mesmo ganho em uma tarefa administrativa de baixo risco. O nível sigma ajuda você a alocar o investimento em qualidade onde ele produz mais impacto.
Erros Comuns
Contar mal as oportunidades. Esse é o erro mais frequente. As equipes contam oportunidades demais ou de menos (subestimando ou inflando a qualidade). A contagem correta é o número de formas pelas quais um defeito poderia ocorrer, por unidade, com base nos requisitos do cliente. Se um cliente só se importa com cinco campos de um formulário, conte cinco oportunidades, não quinze etapas internas.
Confundir DPMO com PPM. Assumir que DPMO e PPM são intercambiáveis funciona bem em cenários simples, com um defeito por unidade. Mas em produtos ou serviços complexos, o PPM pode fazer a qualidade parecer melhor do que realmente é. Uma unidade com três defeitos ainda é uma unidade defeituosa no PPM, mas contribui com três defeitos no DPMO.
Ignorar o deslocamento de 1,5 sigma. Algumas equipes calculam o nível sigma a partir de tabelas estatísticas de livro-texto, sem aplicar o deslocamento de 1,5. O resultado parece melhor do que a realidade. A pesquisa original da Motorola mostrou que os processos derivam ao longo do tempo, e o deslocamento de 1,5 considera essa deriva. A tabela de conversão neste artigo já o inclui.
Definir defeitos de forma inconsistente. Se a sua definição de defeito muda entre períodos de medição, a tendência do seu DPMO perde o sentido. Escreva uma definição operacional clara antes de começar a contar e mantenha-a.
Usar DPMO em amostras minúsculas. O DPMO é uma taxa escalada para um milhão. Se você processa 50 unidades por mês, um único defeito extra faz o número oscilar em 20.000 DPMO. Em volumes pequenos, acompanhe DPU ou taxa de defeitos, e agregue dados por períodos mais longos antes de converter para DPMO.
Melhores Práticas
Defina sua unidade de medição e as oportunidades antes de coletar dados. Isso parece óbvio, mas pular essa etapa é como as equipes acabam recalculando tudo do zero depois da primeira revisão. Escreva, obtenha o acordo dos stakeholders e documente no seu mapa de processo.
Separe os tipos de defeito ao diagnosticar. Um único DPMO agregado esconde quais tipos de defeito impulsionam o número. Uma análise de Pareto das categorias de defeito mostra onde focar. O princípio de Pareto costuma se confirmar: 20% dos tipos de defeito respondem por 80% do DPMO.
Recalcule o DPMO depois de mudanças no processo. O DPMO é uma linha de base e um checkpoint, não um cálculo único. Depois de qualquer melhoria DMAIC ou mudança de design DMADV, meça o novo DPMO para confirmar que o nível sigma realmente mudou.
Use gráficos de controle para monitoramento contínuo. Calcular o DPMO mensalmente e traçá-lo ao longo do tempo cria uma tendência. Combine isso com o controle estatístico de processo para detectar mudanças antes que se tornem problemas. Um gráfico de controle mostrando o DPMO em alta é um alerta antecipado. Um gráfico de controle mostrando estabilidade abaixo da meta é prova de que suas melhorias se sustentaram.
Conecte o nível sigma a resultados de negócio. As equipes de qualidade costumam apresentar o DPMO isoladamente. A abordagem mais eficaz é traduzir o nível sigma em custo, satisfação do cliente ou tempo de ciclo. Uma mudança de 3 sigma para 4 sigma no processamento de pedidos significa cerca de 60.000 defeitos a menos por milhão de pedidos. Atribua um custo por defeito, e você tem um business case.
Perguntas Frequentes
O que é o deslocamento de 1,5 sigma e por que ele importa?
O deslocamento de 1,5 sigma vem da observação empírica da Motorola de que processos reais derivam ao longo do tempo. Até um processo bem controlado verá sua média deslocar-se em até 1,5 desvio-padrão entre a operação de curto e longo prazo. Para considerar isso, o Six Sigma converte o nível sigma de curto prazo em um equivalente de longo prazo, subtraindo 1,5 do valor teórico. É por isso que um processo "6 sigma" tem 3,4 DPMO em vez de 0,002 DPMO (o valor estatístico puro, sem deslocamento). O deslocamento mantém as metas de nível sigma realistas para ambientes de produção reais.
Um nível sigma mais alto sempre vale a pena buscar?
Nem sempre. O custo para ir de 4 sigma a 5 sigma é substancialmente maior do que ir de 3 para 4. E o valor depende inteiramente das consequências de um defeito. Aviação, farmacêutica e processos cirúrgicos justificam investimentos em 6 sigma porque defeitos podem ser fatais. O processamento de documentos de back-office em 4 sigma pode ser inteiramente apropriado se o custo de retrabalho for baixo e o impacto no cliente for mínimo. Use o framework dos belts de Six Sigma para combinar o nível de rigor com o nível de risco.
O DPMO pode ser usado para processos de serviço, não só manufatura?
Sim. O DPMO se aplica em qualquer lugar em que você possa definir uma unidade, contar defeitos e identificar oportunidades discretas. Call centers o usam para informações incorretas fornecidas por chamada. Equipes de software o usam para defeitos de código por ponto de função. Serviços financeiros o usam para erros por transação. A matemática não muda. O trabalho está em definir "defeito" e "oportunidade" de forma que reflita o que o cliente realmente valoriza.
Qual é uma boa meta de DPMO para minha equipe?
Não há uma resposta universal. A meta certa depende do seu setor, do seu nível sigma atual e do custo dos defeitos no seu contexto. Um ponto de partida prático: meça seu DPMO atual, determine seu nível sigma na tabela de conversão e defina uma meta de melhorar um nível sigma em um período definido. Ir de 3 sigma (66.807 DPMO) para 4 sigma (6.210 DPMO) é uma meta significativa e alcançável para a maioria dos projetos de melhoria.
Como o DPMO se relaciona com a capacidade do processo (Cpk)?
Ambos medem o quão bem um processo atende às especificações, mas de ângulos diferentes. O Cpk (índice de capacidade do processo) compara a dispersão do output do seu processo com a largura dos seus limites de especificação e produz uma razão. O DPMO conta defeitos reais normalizados para um milhão de oportunidades. Na prática, você pode converter entre os dois. Um Cpk de 2,0 corresponde aproximadamente a 6 sigma. Um Cpk de 1,33 mapeia para cerca de 4 sigma. Equipes que usam análise de capacidade do processo costumam acompanhar os dois: Cpk durante o monitoramento contínuo e DPMO para relatórios de projeto e benchmarking.
O DPMO dá a você um número com o qual realmente pode fazer algo. Ele transforma impressões vagas de qualidade em um benchmark, e um nível sigma transforma esse benchmark em uma meta. Comece com uma definição clara da sua unidade e das suas oportunidades, calcule seu DPMO atual, encontre seu nível sigma na tabela de conversão, e você terá uma linha de base sobre a qual construir.

Senior Operations & Growth Strategist
On this page
- O Que É o DPMO?
- Como Calcular o DPMO
- Conversão de DPMO para Nível Sigma
- DPMO vs PPM vs DPU
- Por Que o Nível Sigma Importa
- Erros Comuns
- Melhores Práticas
- Perguntas Frequentes
- O que é o deslocamento de 1,5 sigma e por que ele importa?
- Um nível sigma mais alto sempre vale a pena buscar?
- O DPMO pode ser usado para processos de serviço, não só manufatura?
- Qual é uma boa meta de DPMO para minha equipe?
- Como o DPMO se relaciona com a capacidade do processo (Cpk)?