Desdobramento da Função Qualidade (QFD) e Casa da Qualidade
Turn this article into takeaways for your work.
Each assistant summarizes the article only for you and suggests best practices for your work.
O desdobramento da função qualidade (Quality Function Deployment, QFD) é o método estruturado que transforma o que os clientes querem, cômodo por cômodo, nas especificações técnicas que suas equipes de engenharia e operações conseguem realmente construir. Ele fecha a lacuna entre um cliente dizer "eu quero que dure mais" e um engenheiro saber exatamente qual classificação de resistência de material buscar. Sem essa tradução, as equipes de produto otimizam especificações que parecem importantes internamente, mas não se conectam aos fatores de decisão de compra que realmente importam.
O QFD foi desenvolvido por Yoji Akao no Japão no final da década de 1960 e implantado pela primeira vez na divisão do Estaleiro de Kobe da Mitsubishi Heavy Industries em 1972. A Toyota o adotou logo depois, reduzindo os custos de partida em novos lançamentos de modelos em mais de 60% em uma década. O método se espalhou para fabricantes americanos ao longo da década de 1980, impulsionado principalmente pela Ford e pela Xerox.
O que é desdobramento da função qualidade?
O desdobramento da função qualidade (QFD) é uma metodologia de planejamento estruturada que converte requisitos do cliente (chamados de "os quês") em características técnicas específicas (chamadas de "os comos") em cada estágio do desenvolvimento de produto ou serviço. O resultado de cada fase se torna a entrada da fase seguinte, de modo que a intenção do cliente sobrevive do conceito até a produção final.
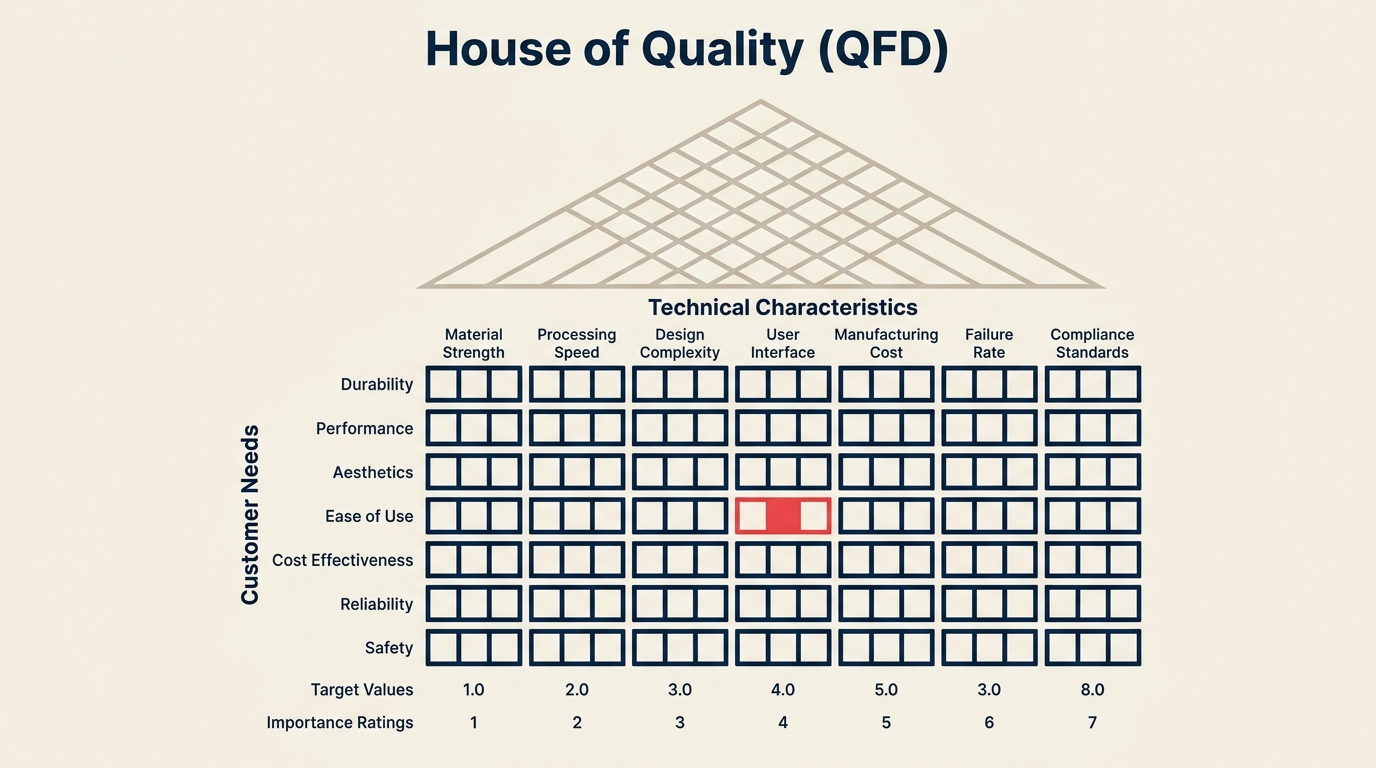
O elemento central do QFD é a Casa da Qualidade (House of Quality, HoQ), uma matriz que mapeia visualmente as necessidades do cliente em relação aos parâmetros técnicos de design. Ela é chamada de "casa" porque o diagrama inclui um telhado triangular que mostra as correlações entre as próprias características técnicas, situado sobre a matriz retangular principal como um telhado sobre um edifício.
O QFD se conecta estreitamente à pesquisa de Voz do Cliente (Voice of the Customer, VoC). A VoC coleta a linguagem bruta do cliente. O QFD transforma essa linguagem em metas de engenharia acionáveis. Ele também se alimenta diretamente das árvores CTQ, que decompõem necessidades amplas do cliente em características de qualidade mensuráveis. Esses CTQs se tornam as entradas de linha do lado esquerdo da Casa da Qualidade.
Dados-chave
- A Toyota reduziu as mudanças de engenharia na pré-produção em 61% e os custos de partida em 61% depois de implementar o QFD no início da década de 1980 (Hauser & Clausing, Harvard Business Review, 1988).
- A Ford relatou uma redução de 40% nos problemas de produção inicial em veículos projetados usando QFD, em comparação com veículos projetados sem ele (American Supplier Institute, 1987).
- Um estudo com 35 empresas que usam QFD constatou que o tempo de ciclo de desenvolvimento de produto caiu em média 33% (consórcio de pesquisa GOAL/QPC, Quality Progress).
A Casa da Qualidade explicada
A Casa da Qualidade contém seis "cômodos" distintos, cada um carregando um tipo específico de informação. Entender o que vai em cada cômodo mostra exatamente como construir uma.
| Cômodo | O que contém | Propósito |
|---|---|---|
| Necessidades do Cliente (Quês) | Requisitos do cliente verbatim ou sintetizados, agrupados por tema | Define as linhas: estabelece o que o cliente realmente quer |
| Classificações de Importância | Pontuação numérica (1-5 ou 1-10) mostrando o quanto cada necessidade importa | Pondera a análise para que as necessidades de alta prioridade orientem as decisões |
| Características Técnicas (Comos) | Parâmetros de engenharia ou processo que a equipe controla (por exemplo, espessura de parede, tempo de ciclo) | Define as colunas: estabelece o que a equipe pode ajustar |
| Matriz de Relacionamento | Símbolos ou números (forte = 9, moderado = 3, fraco = 1, em branco = 0) em cada interseção linha-coluna | Mostra quais características técnicas afetam quais necessidades do cliente |
| Telhado de Correlação | Grade triangular acima das colunas mostrando correlações positivas/negativas entre características técnicas | Sinaliza trade-offs (melhorar uma especificação pode prejudicar outra) |
| Avaliação Competitiva | Classificações lado a lado do cliente comparando seu produto com os concorrentes em cada necessidade | Mostra onde você tem lacunas e onde já lidera |
| Valores-Alvo | Metas específicas e mensuráveis para cada característica técnica | Converte a análise em metas de engenharia acionáveis |
A matriz de relacionamento é onde ocorre a maior parte do trabalho analítico. Multiplique cada pontuação de relacionamento pela classificação de importância da necessidade do cliente correspondente, depois some cada coluna. A coluna com a pontuação mais alta é a característica técnica com maior impacto na satisfação do cliente. É para lá que o foco de engenharia deve ir primeiro.
As quatro fases do QFD
A maioria das implantações de QFD usa uma cascata de quatro fases. O resultado da Fase 1 alimenta a entrada da Fase 2, e assim por diante, de modo que a intenção do cliente se propaga até o chão de fábrica.
| Fase | Entrada (De) | Saída (Para) | Foco |
|---|---|---|---|
| Fase 1: Planejamento do Produto | Necessidades do cliente (VoC, árvores CTQ) | Características e metas do produto | "O que o produto precisa fazer?" |
| Fase 2: Planejamento do Design | Características do produto da Fase 1 | Especificações de peças/componentes | "Quais peças alcançam essas características?" |
| Fase 3: Planejamento do Processo | Especificações de peças da Fase 2 | Parâmetros e controles de processo | "Quais etapas de produção geram essas peças?" |
| Fase 4: Planejamento da Produção | Parâmetros de processo da Fase 3 | Planos de controle de qualidade e instruções para operadores | "Como garantimos que o processo permaneça sob controle?" |
A maioria das equipes completa a Fase 1 (a Casa da Qualidade clássica) e para por aí. Isso é um ponto de partida útil, mas o real poder vem de encadear as quatro fases, porque isso garante que o que o operador da linha de montagem faz na quinta-feira de manhã remonte diretamente a um requisito que um cliente declarou em um grupo focal seis meses antes.
Erros comuns
Listar características em vez de necessidades. As necessidades do cliente devem ser expressas como resultados ("abre suavemente no frio"), não como características do produto ("usar graxa premium"). Características pertencem às colunas de características técnicas.
Pular a avaliação competitiva. Equipes que omitem o benchmarking costumam investir em melhorias técnicas em áreas onde já estão à frente da concorrência. A coluna competitiva revela onde fechar uma lacuna realmente muda o comportamento de compra.
Tratar todos os relacionamentos como fortes. Quando toda célula da matriz de relacionamento recebe um "9," a matemática de priorização desmorona. Seja disciplinado: a maioria das células deve ficar em branco ou receber pontuação fraca.
Construir o telhado e ignorá-lo. O telhado de correlação, que mostra conflitos entre características técnicas, é frequentemente construído e depois nunca usado. Correlações negativas (melhorar a Especificação A degrada a Especificação B) exigem decisões explícitas de design, não silêncio.
Fazer uma vez e parar. Uma Casa da Qualidade é um documento vivo. As prioridades do cliente mudam. Os produtos concorrentes mudam. Atualize as classificações de importância e os benchmarks competitivos pelo menos uma vez por geração de produto.
Como construir uma Casa da Qualidade
Passo 1: Reúna as necessidades do cliente
Conduza uma pesquisa de Voz do Cliente: entrevistas, pesquisas, grupos focais, análise de tickets de suporte. Capture a linguagem verbatim. Agrupe declarações relacionadas em temas e sintetize cada tema em uma declaração de necessidade clara. Busque de 10 a 30 declarações de necessidade. Poucas demais e você perde nuances; muitas demais e a matriz se torna ingerenciável.
Passo 2: Classifique a importância das necessidades
Peça aos clientes (ou use dados proxy de comportamento de compra, frequência de reclamações ou pesquisa de mercado) para classificar a importância de cada necessidade em uma escala de 1-5 ou 1-10. Isso se torna seus pesos de importância. Eles orientam toda decisão de priorização a jusante, então dedique tempo a eles.
Passo 3: Defina as características técnicas
Liste os parâmetros de engenharia ou processo que sua equipe realmente controla: dimensões, tolerâncias, materiais, tempos de ciclo, temperaturas de processo, tempos de resposta de software. Cada característica deve ser mensurável e ter uma direção de melhoria definida (mais é melhor, menos é melhor, ou o alvo é o ideal).
Passo 4: Construa a matriz de relacionamento
Percorra cada célula: essa característica técnica afeta essa necessidade do cliente? Se sim, atribua uma pontuação: forte (9), moderada (3) ou fraca (1). Deixe a célula em branco se não houver relacionamento relevante. Essa etapa exige participação multifuncional. Engenheiros, gerentes de produto e líderes de qualidade devem preencher a matriz juntos.
Passo 5: Pontue e priorize
Para cada coluna de característica técnica, multiplique cada pontuação de relacionamento pela classificação de importância da necessidade do cliente correspondente, depois some a coluna. O resultado é a importância relativa daquela característica técnica para a satisfação geral do cliente. Normalize as pontuações em porcentagens para facilitar a comparação.
Passo 6: Complete o telhado de correlação
Para cada par de características técnicas, avalie se melhorar uma impacta positivamente a outra (marque com um "+" ou "++"), entra em conflito com ela ("-" ou "--"), ou não tem relação (deixe em branco). Correlações negativas exigem resolução explícita na fase de design.
Passo 7: Realize o benchmarking competitivo
Classifique seu produto atual e seus dois ou três principais concorrentes em cada necessidade do cliente, usando uma escala de 1-5. Plote essas classificações no cômodo de avaliação competitiva. Lacunas entre onde você está e onde os concorrentes estão (especialmente em necessidades de alta importância) se tornam suas metas de design de maior prioridade.
Passo 8: Defina metas técnicas
Para cada característica técnica, defina um valor-alvo específico e mensurável. Eles vêm das pontuações de priorização, das lacunas do benchmarking competitivo e da viabilidade de engenharia. As metas se tornam as saídas da Fase 1 e as entradas da Fase 2.
Exemplo de QFD
Aqui está uma Casa da Qualidade simplificada para uma garrafa de água reutilizável, mostrando cinco necessidades do cliente mapeadas em relação a quatro características técnicas.
| Necessidade do Cliente | Importância | Espessura da Parede (mm) | Força de Vedação da Tampa (N) | Peso da Garrafa (g) | Textura da Superfície (aderência 1-10) |
|---|---|---|---|---|---|
| Não vaza | 9 | 3 | 9 | 1 | 0 |
| Mantém a bebida gelada por 12h+ | 8 | 9 | 3 | 3 | 0 |
| Fácil de carregar | 6 | 1 | 0 | 9 | 9 |
| Parece durável | 7 | 9 | 3 | 3 | 3 |
| Fácil de abrir com uma mão | 8 | 0 | 9 | 0 | 9 |
| Pontuação Ponderada | 189 | 225 | 111 | 141 |
Lendo as pontuações ponderadas: a força de vedação da tampa (225) tem a ligação mais forte com a satisfação geral do cliente, seguida pela espessura da parede (189), textura da superfície (141) e peso da garrafa (111). Os recursos de engenharia devem priorizar as especificações de força de vedação da tampa primeiro. Isso atende diretamente às duas necessidades de maior importância (não vaza, fácil de abrir com uma mão) ao mesmo tempo.
Melhores práticas
Comece pequeno, depois expanda. Construa sua primeira Casa da Qualidade para uma única linha de produto ou um único segmento de clientes. Uma primeira execução focada é muito mais útil do que uma matriz extensa que nunca é concluída.
Equipe multifuncional desde o dia um. O QFD fracassa quando apenas a equipe de qualidade preenche a matriz. Você precisa de dados de voz do cliente (gestão de produto ou sucesso do cliente), expertise técnica (engenharia ou operações) e contexto estratégico (liderança de produto ou vendas) na mesma sala.
Vincule o QFD a projetos de DMADV e Six Sigma. As saídas da Fase 1 do QFD mapeiam diretamente para as fases de Definir e Medir do DMADV. Ao projetar um novo produto ou processo do zero, o QFD é como você garante que os CTQs que está otimizando são os que os clientes realmente valorizam.
Use o Modelo Kano para classificar as necessidades primeiro. Antes de ponderar as necessidades do cliente por importância, realize uma análise Kano para separar necessidades básicas (esperadas, não geram encantamento se presentes), necessidades de desempenho (quanto mais, melhor) e necessidades de encantamento (inesperadas, geram encantamento). Necessidades básicas recebem classificações de importância altas por padrão; necessidades de encantamento podem receber importância moderada, mas alto peso estratégico.
Revisite após movimentos competitivos. Um concorrente lançando um produto melhor muda o cômodo de benchmarking competitivo. Reavalie as classificações de importância e as metas sempre que o mercado mudar. Programas de Gestão da Qualidade Total usam o QFD como uma ferramenta de planejamento recorrente, não um exercício único.
Conecte ao Mapeamento do Fluxo de Valor. Depois da Fase 3 (planejamento do processo), os parâmetros de processo que você identificou são exatamente as entradas que seu mapa de fluxo de valor deve medir. Isso cria uma ligação direta entre o requisito do cliente, a etapa do processo e a análise de desperdício do fluxo de valor.
Perguntas frequentes
Qual é a diferença entre QFD e a Casa da Qualidade?
O QFD é a metodologia completa de quatro fases. A Casa da Qualidade é a matriz específica usada na Fase 1 do QFD. As pessoas costumam usar os termos de forma intercambiável porque a Fase 1 é a parte mais comumente implementada do framework, mas a Casa da Qualidade é uma ferramenta dentro do sistema QFD mais amplo.
Quanto tempo leva para construir uma Casa da Qualidade?
Uma equipe multifuncional focada com bons dados de VoC pode completar a Fase 1 em duas a quatro oficinas de meio período. Produtos maiores, com mais de 20 necessidades do cliente e mais de 15 características técnicas, levam mais tempo. O erro comum é tentar completá-la sozinho ou em uma única sessão maratona. Distribua ao longo de sessões, com trabalho de preparação entre elas.
Quando usar QFD em vez de apenas um documento de requisitos?
Use o QFD quando precisar tomar decisões explícitas de trade-off entre características técnicas concorrentes, quando quiser garantir que as prioridades de engenharia remontem a dados do cliente (não a suposições internas), ou quando estiver entrando em um mercado competitivo em que o benchmarking contra alternativas importa. Um documento de requisitos diz o que construir; o QFD diz por que esses requisitos são priorizados daquela forma.
O QFD pode ser usado para serviços, não apenas produtos?
Sim. O QFD de serviços substitui dimensões físicas por atributos de serviço: tempo de espera, qualidade do roteiro de interação, tempo de atividade do sistema, taxa de resolução. A estrutura da matriz é idêntica. Muitos bancos, hospitais e empresas de logística usam o QFD para desenhar processos de serviço.
Como o QFD se conecta às árvores CTQ?
Uma árvore CTQ costuma ser o trabalho preparatório para uma Casa da Qualidade. A árvore CTQ pega uma necessidade ampla do cliente e a decompõe em características de qualidade mensuráveis. Essas características mensuráveis se tornam as entradas de linha (necessidades do cliente) do lado esquerdo da matriz Casa da Qualidade. Juntas, formam um pipeline limpo: a pesquisa VoC alimenta a árvore CTQ, que alimenta a Casa da Qualidade, que alimenta a especificação de engenharia.
O QFD não vai dizer o que seus clientes querem. É para isso que serve a pesquisa de Voz do Cliente. Mas, uma vez que você sabe o que eles querem, o QFD dá a estrutura para transformar esse conhecimento em decisões técnicas que realmente são construídas. Equipes que pulam essa etapa costumam construir produtos tecnicamente excelentes que ainda assim decepcionam os clientes, porque a excelência foi direcionada para os alvos errados.

Senior Operations & Growth Strategist
On this page
- O que é desdobramento da função qualidade?
- A Casa da Qualidade explicada
- As quatro fases do QFD
- Erros comuns
- Como construir uma Casa da Qualidade
- Passo 1: Reúna as necessidades do cliente
- Passo 2: Classifique a importância das necessidades
- Passo 3: Defina as características técnicas
- Passo 4: Construa a matriz de relacionamento
- Passo 5: Pontue e priorize
- Passo 6: Complete o telhado de correlação
- Passo 7: Realize o benchmarking competitivo
- Passo 8: Defina metas técnicas
- Exemplo de QFD
- Melhores práticas
- Perguntas frequentes