What Is Hockey-Stick Growth?
Turn this article into takeaways for your work.


Each assistant summarizes the article only for you and suggests best practices for your work.
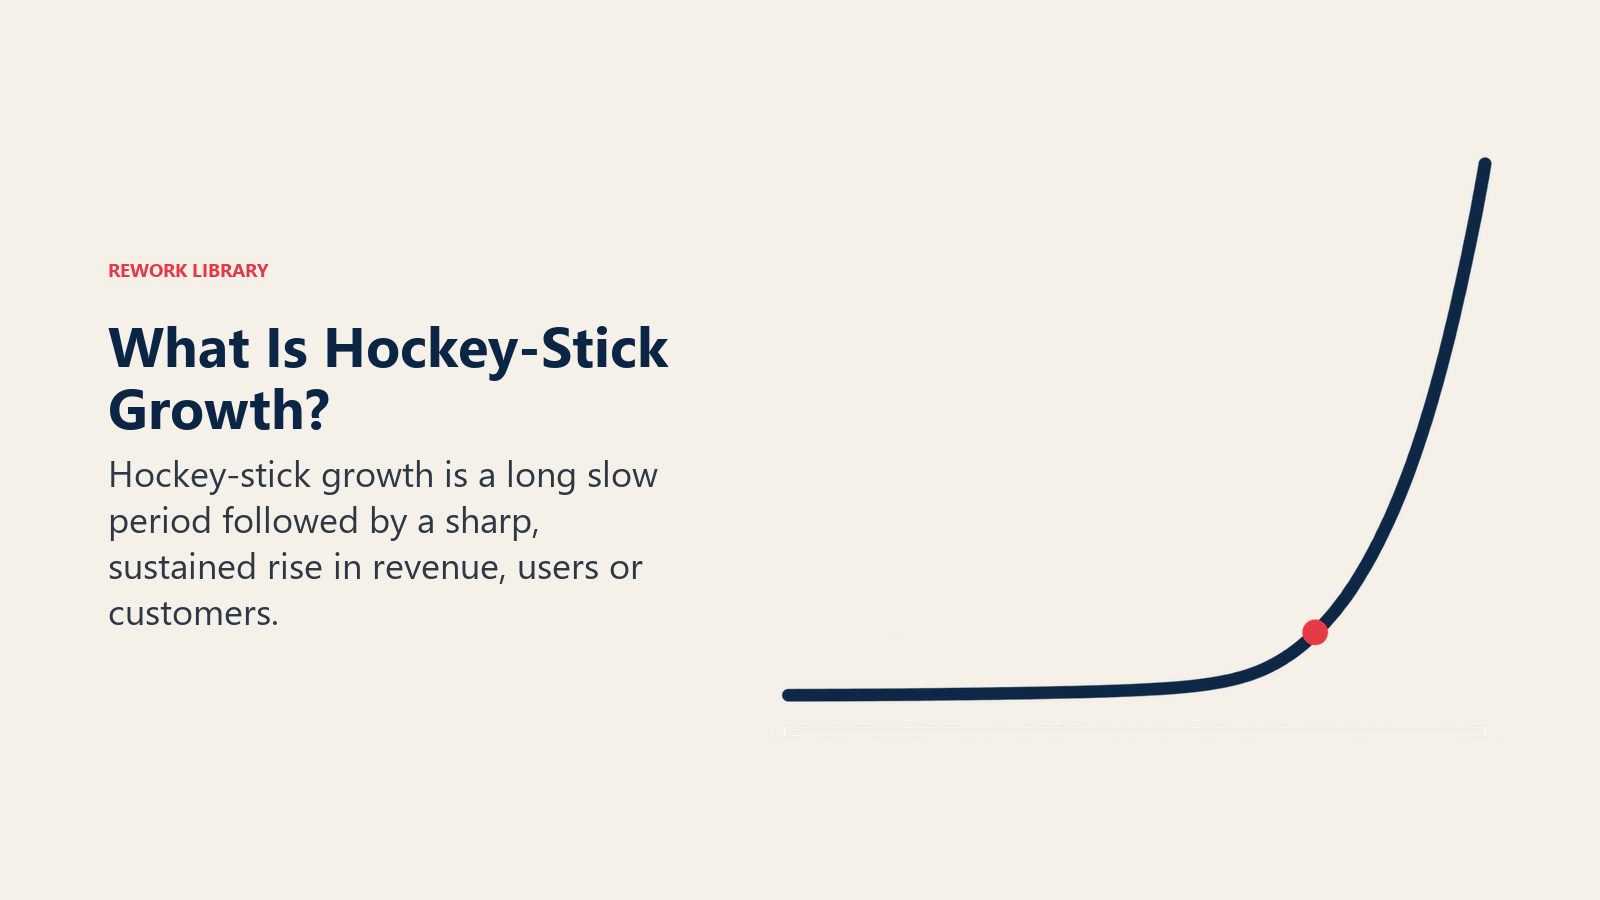
Hockey-stick growth is a pattern where a company's key metric (revenue, users, or customers) stays low and nearly flat for a long time, then bends sharply upward. Plot it on a chart and it looks like a hockey stick lying on its side: a long shaft, then a blade that points at the ceiling.
The shape matters because it describes how most successful startups actually feel from the inside. Months of work seem to produce almost nothing. Then something clicks, and the same effort produces results that look out of proportion. Founders love the picture. Investors have also seen it in so many pitch decks that they treat it with suspicion. Both reactions are reasonable, and this article explains why.
The shape of the curve
A hockey stick has three parts:
- The shaft. A long period of slow or no growth. The company is still finding out what customers want and how to reach them.
- The bend (the inflection). Something changes. Growth rate rises and stays higher.
- The blade. Rapid growth that keeps going for a while.
Paul Graham of Y Combinator describes nearly the same thing in his essay "Startup = Growth". He says the growth of a successful startup usually has three phases: an initial period of slow or no growth while the startup works out what it's doing, then a period of rapid growth once it figures out how to make something lots of people want and how to reach them, and finally slower growth as it becomes a big company. Together, he writes, those phases make an S-curve. The hockey stick is the first two phases seen up close, before the curve flattens.
One important point: the "flat" part is rarely flat in percentage terms. A company that goes from 10 customers to 11 has grown 10%. It only looks flat because the numbers are small, which leads to the next section.
Why it happens
Hockey-stick growth usually comes from a few causes, often more than one at once.
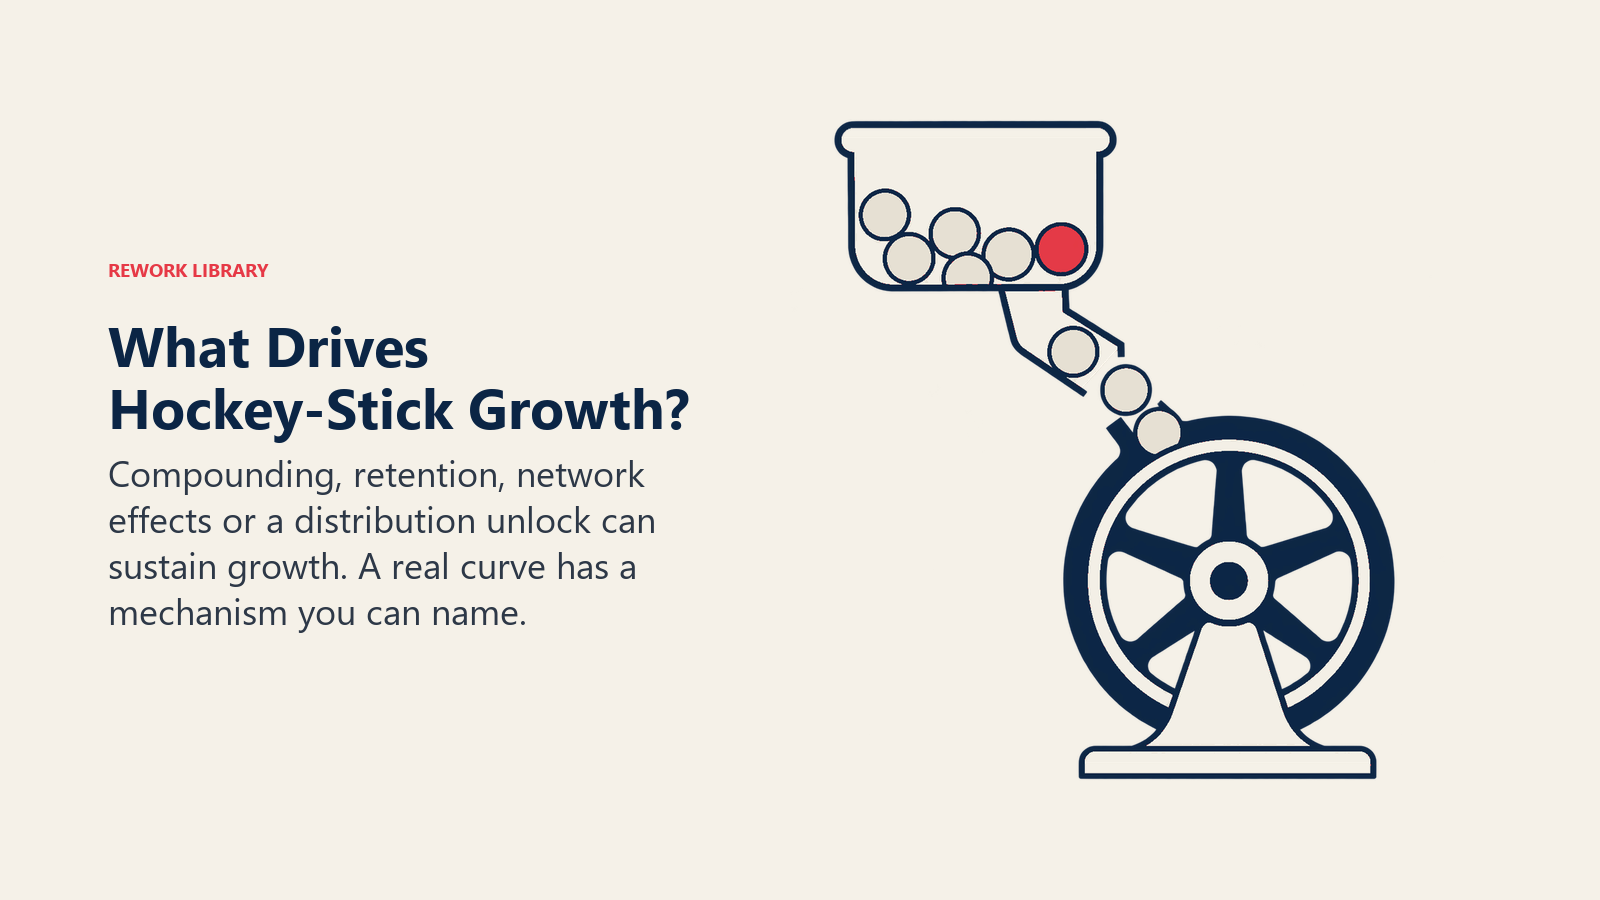
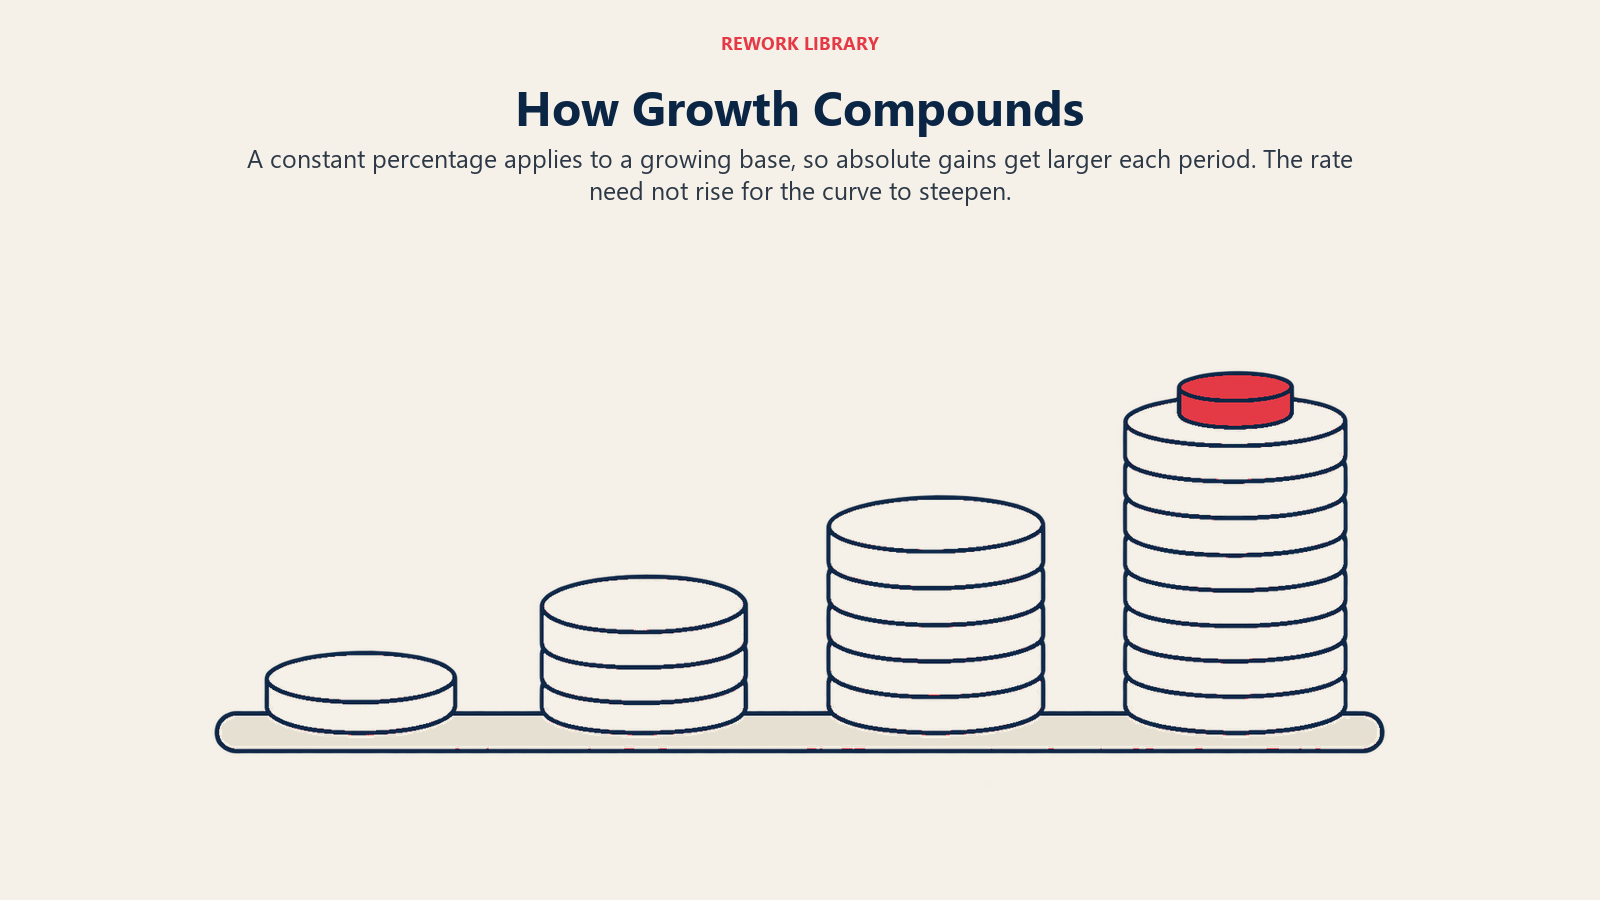
Compounding. If growth is a steady percentage of what you already have, the absolute gains get bigger every period even though the rate hasn't changed. This is the plain math of exponential growth, and it's the most common reason a curve looks flat and then steep. More on this below.
Product-market fit. Before a product fits a real need, each new customer takes effort and many leave. Once it fits, customers stay, tell others, and pay. Retention improves, so the same acquisition effort builds on a base instead of refilling a leaky bucket. See product-market fit for SaaS for how teams measure that.
Network effects. When each new user makes the product more valuable to existing users, growth feeds itself. Marketplaces, messaging tools, and social products can sit quietly for a long time and then take off once enough people are on board. Read more on network effects and on viral growth and network effects in SaaS.
A distribution unlock. Sometimes the product was fine all along and the bottleneck was reaching people. A new channel, a partnership, a platform integration, or a change in how the category buys can suddenly open a large audience. The curve bends because reach changed, not because the product did.
Notice what these have in common: each one is a mechanism. A real hockey stick has a reason you can name.
The math of compounding
Compounding is why small differences in weekly growth rate produce wildly different outcomes. If a metric grows at a constant weekly rate r, then after 52 weeks it has multiplied by (1 + r) raised to the 52nd power.
The table below uses our own arithmetic. It's illustrative, not data from any company: it assumes a starting monthly revenue of $10,000 and a perfectly steady weekly growth rate, which real businesses never achieve. We computed each figure as 10,000 × (1 + rate)^weeks.
| Weekly growth | Multiple after 26 weeks | Multiple after 52 weeks | Illustrative revenue after 52 weeks |
|---|---|---|---|
| 1% | 1.30x | 1.68x | $16,777 |
| 5% | 3.56x | 12.64x | $126,428 |
| 7% | 5.81x | 33.73x | $337,253 |
| 10% | 11.92x | 142.04x | $1,420,429 |
Paul Graham's essay has a similar table of yearly multiples, and his figures agree with ours: 1% a week grows about 1.7x a year, 5% grows 12.6x, 7% grows 33.7x, and 10% grows 142x. He also points out that our intuitions are poor here, and that small differences in growth rate produce qualitatively different outcomes.
Now look at when the growth happens. Take the 7% case, checked at each quarter of the year:
| Week | Multiple of starting revenue | Illustrative monthly revenue |
|---|---|---|
| 0 | 1.00x | $10,000 |
| 13 | 2.41x | $24,098 |
| 26 | 5.81x | $58,074 |
| 39 | 13.99x | $139,948 |
| 52 | 33.73x | $337,253 |
Total gain over the year is about $327,000. Only about 15% of it arrives in the first half of the year, and about 60% arrives in the final quarter. Nothing changed about the rate. On a normal (linear) chart, that's a hockey stick built purely from a constant percentage. On a log chart, the same data is a straight line. That's a useful test, and we'll come back to it.
What Y Combinator says about weekly growth rates
Paul Graham wrote his essay in September 2012, drawing on how YC measures startups. A few specifics from it:
- YC measures growth rate per week during the program, partly because there's so little time before Demo Day and partly because early startups need fast feedback from users.
- He writes that a good growth rate during YC is 5 to 7 percent a week, that 10% a week is exceptional, and that managing only 1% is a sign a startup hasn't figured out what it's doing.
- He says the best thing to measure is revenue, and for startups that aren't charging yet, active users.
- A rate is a ratio. "We get about a hundred new customers a month" isn't a growth rate, because a constant number of new customers means the rate is shrinking.
Two cautions. These numbers describe the early period of a startup in an accelerator, usually from a tiny base. A company with $50 million in revenue can't compound at 7% a week for a year, because the arithmetic would give it more than 33 times that revenue. And the essay is a guideline from one source, not a law. It's best read as a way to focus a team on a single number.
Why pitch-deck hockey sticks get a skeptical reception
Almost every investor deck has a revenue projection that bends sharply upward in year three. Investors know why: they need big outcomes to make their returns work, so a deck that shows a large opportunity is more attractive. They also know most projections never come true.
Two practitioners put it bluntly. Mark Greenough, a financial consultant who writes that he has sat on the investors' side of the table, says that in many pitch sessions nobody in the room believes the hockey-stick numbers, and that he consistently more than halved a revenue projection before discounting it. Michael Luni Libes, writing in an Unreasonable Group guide, says no savvy investor ever believes those projections, and that the result is often an unjustified, unrealistic series of revenues. Neither is a venture firm's formal policy, so treat them as informed opinion from people who've reviewed many plans.
The practical takeaway for founders: a projection that bends upward without a stated reason reads as a wish. A better version names the mechanism. What changes in month 14 that makes growth faster? Is it a new channel, a pricing change, a product release, a partnership? If you can't point to it, the curve is decoration.
For context on how much money early rounds involve, see seed-stage startups, and for how long a round lasts, track your burn rate and runway. A shaft that lasts longer than your runway never becomes a blade.
Real inflection or one-off spike?
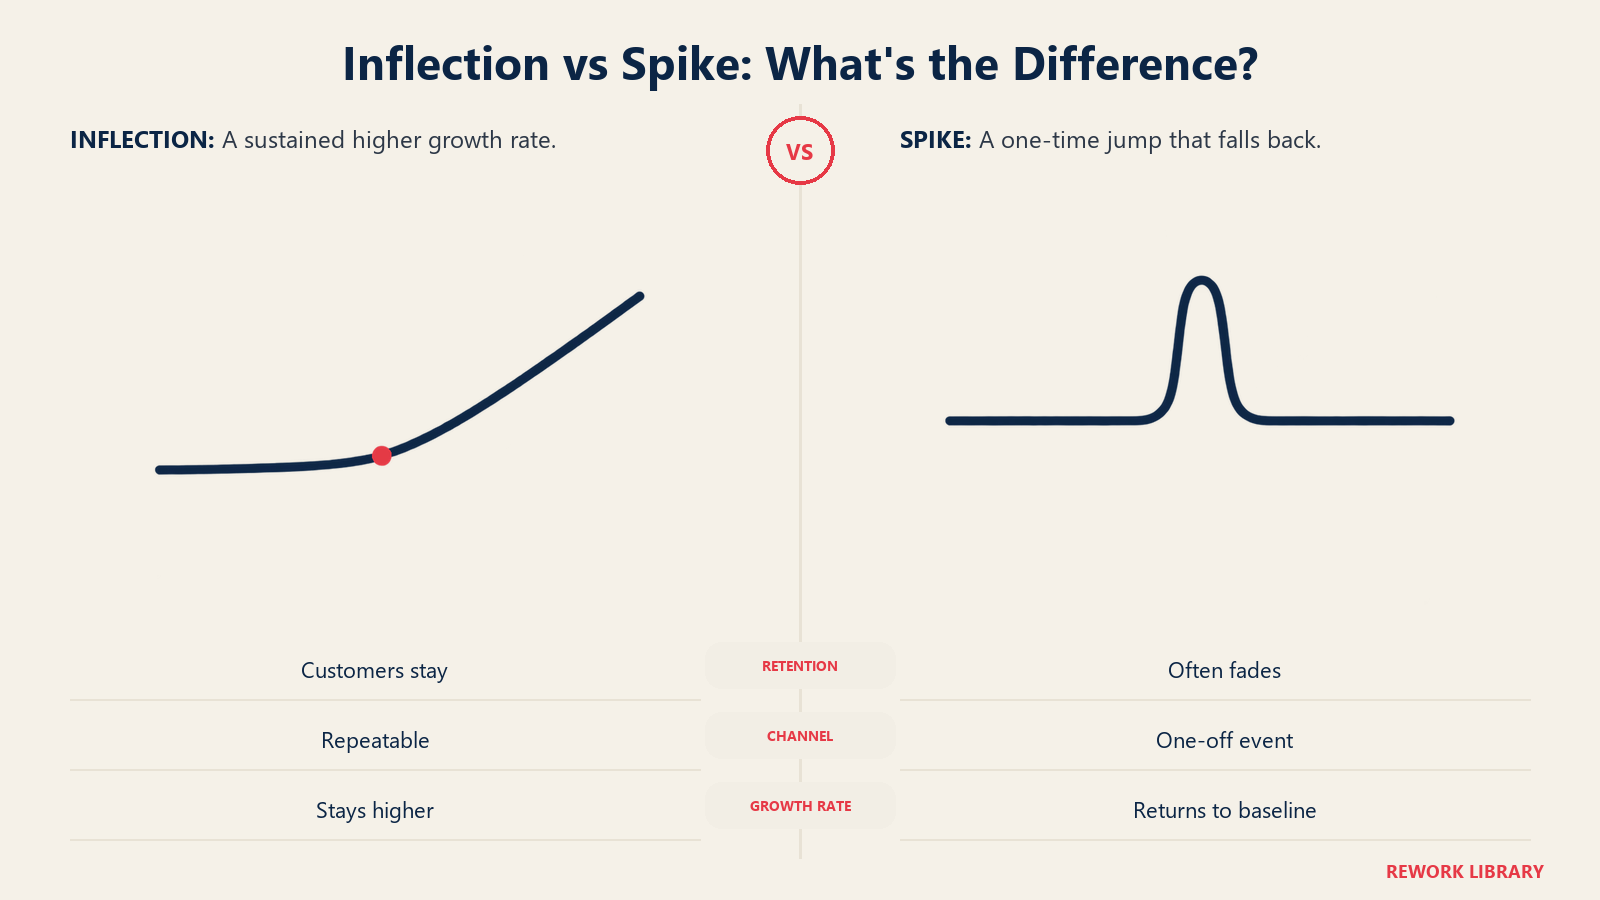
Not every upward jump is a hockey stick. A spike from a press mention, a viral post, a big promotion, or a single large customer looks great for a week, then falls back. A true inflection holds. Here's how to tell them apart.
Check cohort retention. Group customers by the month they joined and watch how many are still active later. If new cohorts retain as well as older ones (or better), the new users are real. If each cohort drops to near zero, you're pouring water into a leaky bucket and the "growth" is acquisition spend.
Look for a repeatable channel. Ask whether you could produce the same result again on purpose. If the surge came from one lucky event, it's a spike. If it came from something you can run next week (an outbound motion, a partner referral loop, a content engine), it's an inflection.
Look at the rate, not the total. A true inflection raises the percentage growth rate and holds it for several periods. A spike raises the total once and then the rate drops back to what it was, or lower.
Check the economics. Growth bought with heavy discounts or unprofitable spending can look like a hockey stick without being one. Compare what it costs to win a customer with what that customer is worth, using unit economics.
Use a log chart. Plot the metric on a logarithmic axis. Steady compounding shows up as a straight line. A true acceleration shows up as the line bending upward, and a spike shows up as a bump that the line then returns from.
You can also read the stage you're in. Companies in the shaft are usually still searching, which is covered in early-stage vs growth-stage. Pushing hard to scale before the retention signs appear is a common way to burn money without bending the curve.
Key Facts: Hockey-Stick Growth
- Hockey-stick growth is a flat, slow period followed by a sharp, sustained rise in a metric such as revenue or users.
- Paul Graham says the growth of a successful startup usually has three phases: slow or no growth, rapid growth, then slowing as it becomes a large company (Startup = Growth).
- In the same essay, he says 5 to 7 percent weekly growth is good during YC, 10% is exceptional, and 1% suggests the startup hasn't yet figured out what it's doing.
- A steady 5% weekly growth rate compounds to about 12.6x in a year, and 7% to about 33.7x (Graham's table, which our own calculation matches).
- Constant percentage growth looks flat and then steep on a linear chart, but is a straight line on a log chart.
- A real inflection shows stable cohort retention, a repeatable channel, and a sustained higher growth rate.
Related reading
