What Is TAM, SAM and SOM? Sizing a Market
Turn this article into takeaways for your work.


Each assistant summarizes the article only for you and suggests best practices for your work.
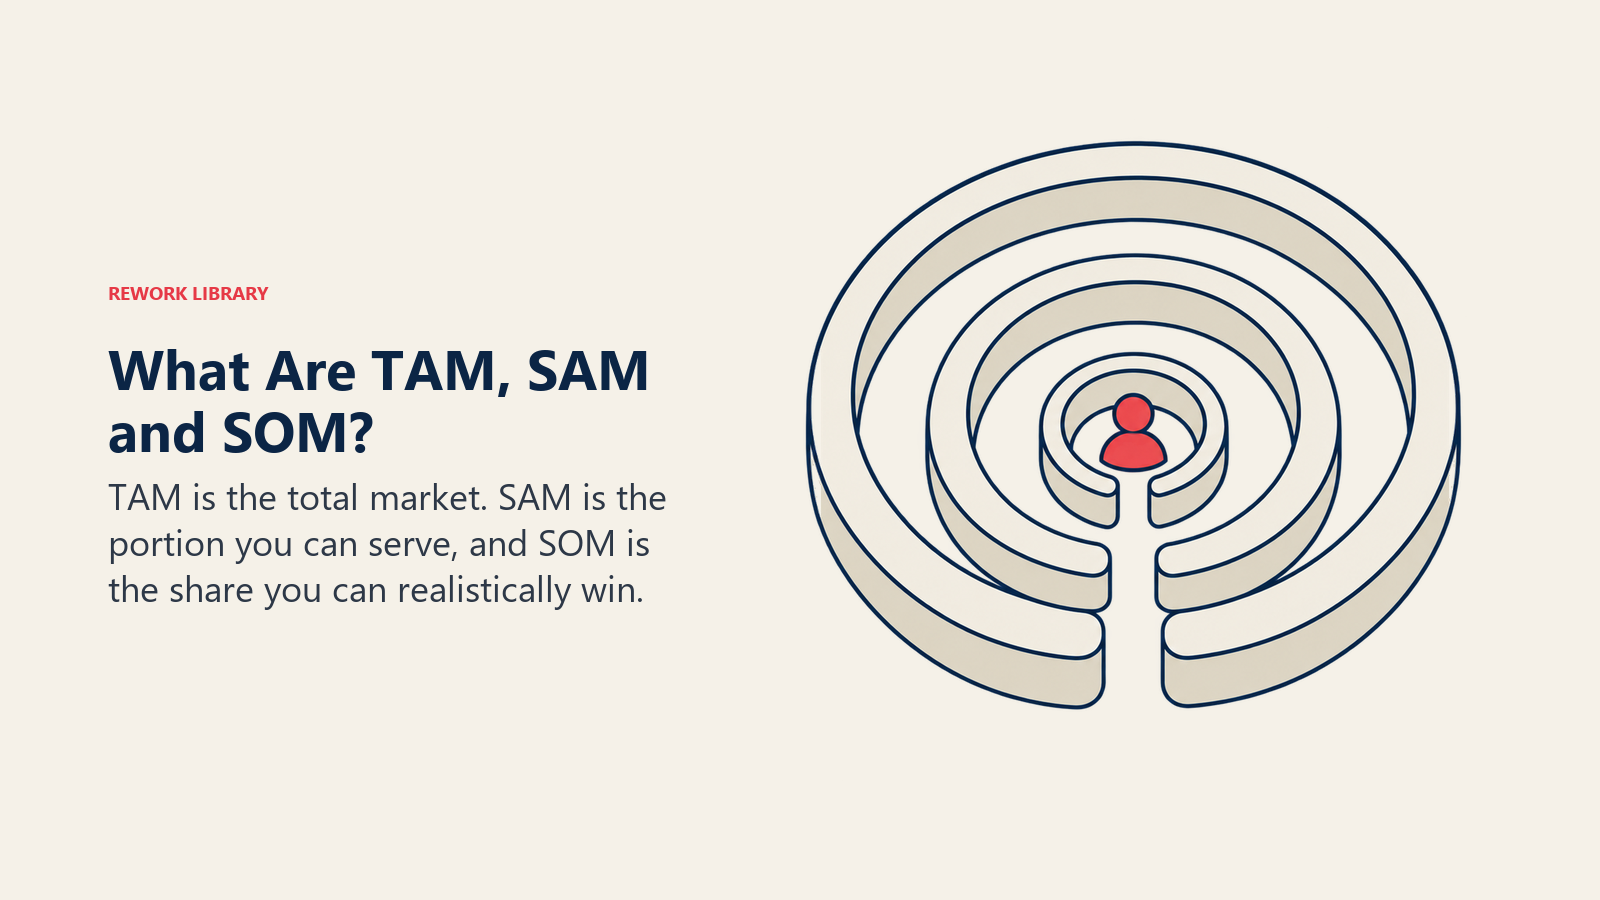
TAM, SAM and SOM are three nested estimates of market size. TAM (total addressable market) is the revenue available if every possible customer bought your type of product. SAM (serviceable addressable market) is the slice you can actually reach with your product, price and geography. SOM (serviceable obtainable market) is the part of that slice you can realistically win in a defined period.
Think of three circles, each inside the last. The outer one is the biggest number and the least useful. The inner one is the smallest and the one your plan has to defend.
What each term means
| Term | Plain question it answers | What narrows it |
|---|---|---|
| TAM | If everyone who could use this did, how much revenue is that? | Product category only |
| SAM | Which of those buyers can we serve with this product, in the places we sell? | Geography, segment, product fit, price |
| SOM | How much of the SAM can we win in the next few years? | Sales capacity, competition, channels, time |
Some writers expand SAM as "serviceable available market" and others say "serviceable addressable market." They mean the same thing. What matters is that you state your definition and keep it consistent through the deck or plan.
One more point that trips people up: these are revenue pools, not your revenue. A $2 billion SAM doesn't mean your company is worth anything close to that. It means there's room to build something, which is the only job a market-size number has.
Three ways to size a market
Top-down. You start from an industry figure (say, total spend on a software category) and take a percentage. It's fast and easy to source. It's also the weakest method, because the percentage at the end is a guess dressed as a result.
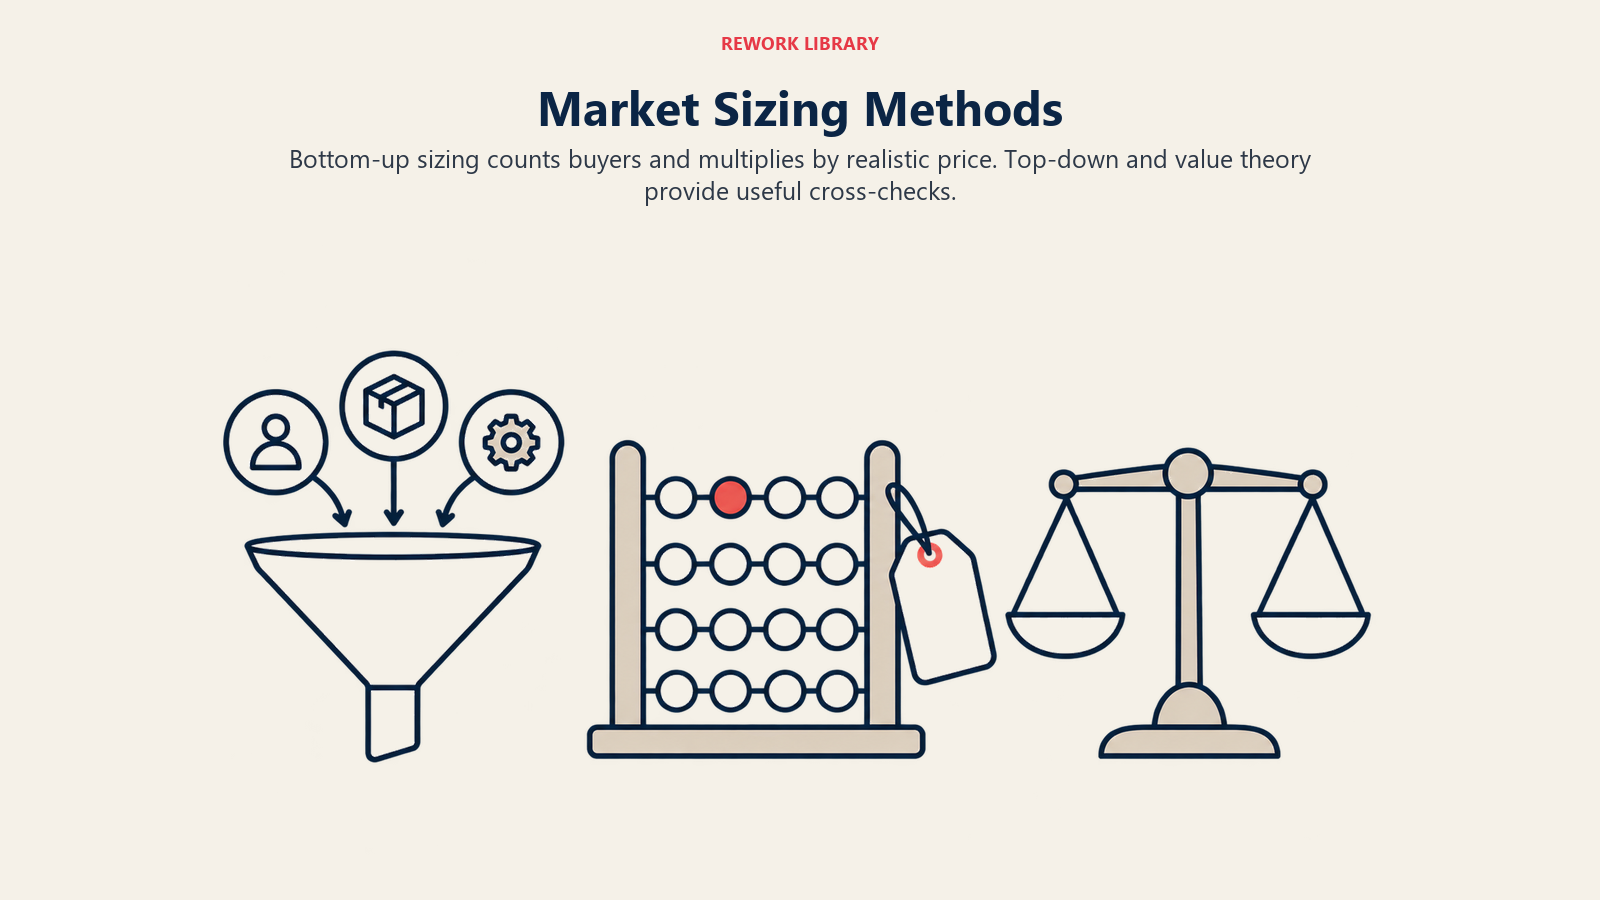
Bottom-up. You count actual buyers and multiply by what each would pay. For example: number of target companies, times the share that fit your product, times your realistic annual price. Every input is something you can check or test, which is why investors trust it more.
Value theory. You estimate the value your product creates for a customer (hours saved, losses avoided) and price a share of it. It suits new categories where no market report exists, but it needs evidence that customers will actually pay that share. Treat it as a cross-check, not a primary method.
The best practice is to run bottom-up as your main number and use a top-down figure only as a sanity check. If the two differ by 10x, find out why before you show either.
An illustrative bottom-up example
This is our own made-up arithmetic to show the mechanics. It isn't research and the numbers aren't real.
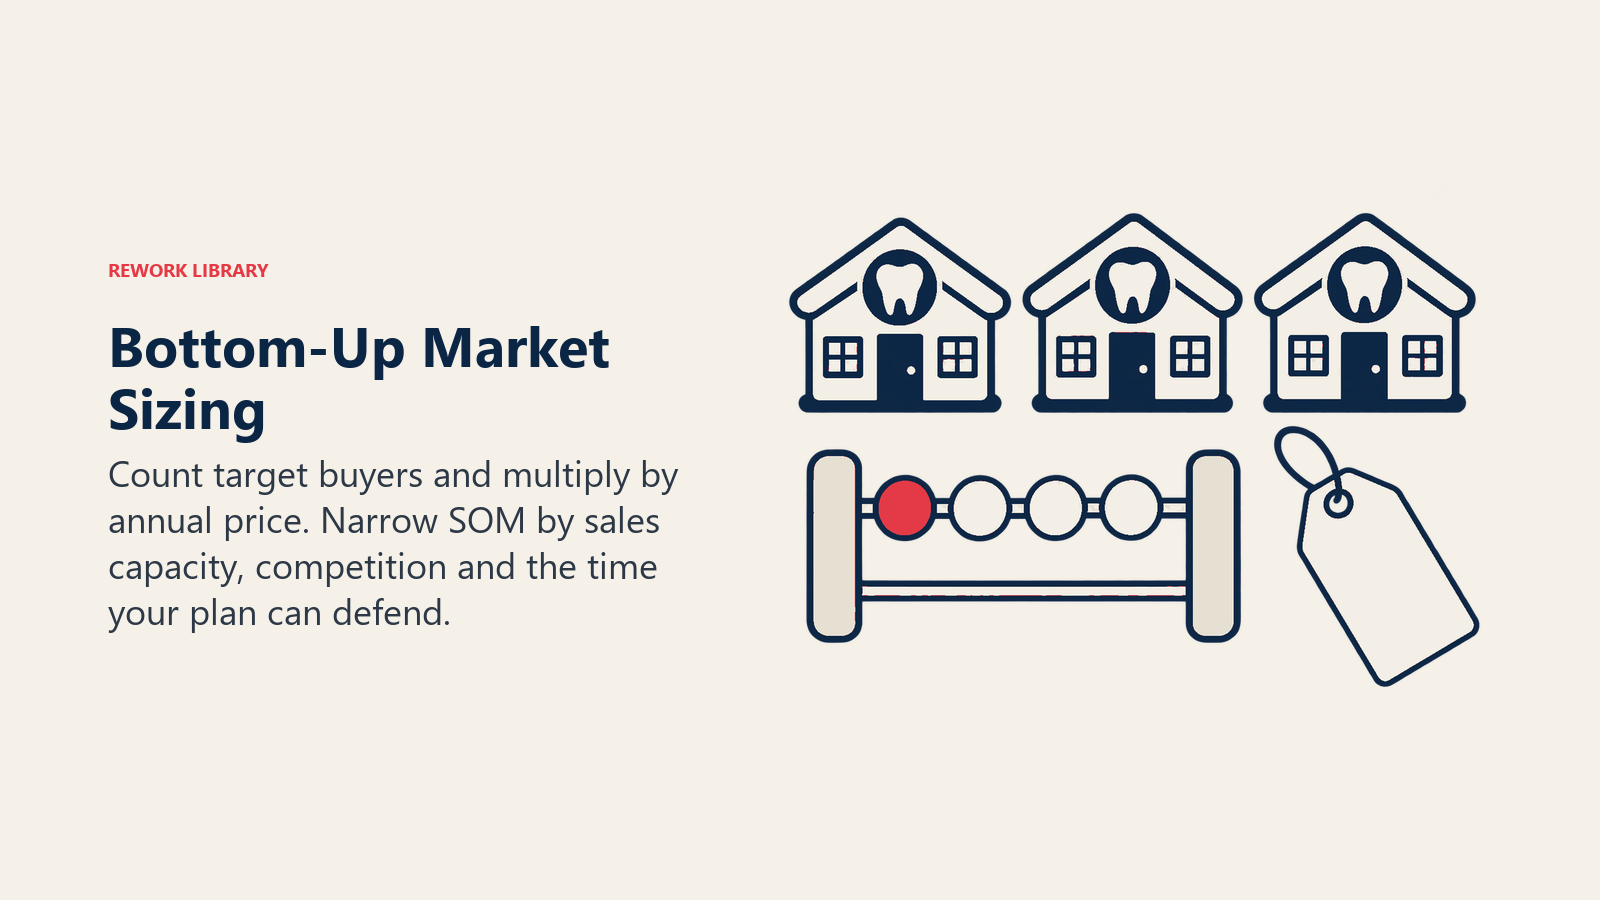
Imagine a company selling scheduling software to independent dental practices in one country.
| Step | Illustrative input | Result |
|---|---|---|
| Dental practices in the country | 40,000 | 40,000 |
| Price per practice per year | $3,000 | TAM = $120 million |
| Practices in the regions you sell in, with 3+ staff | 12,000 | SAM = $36 million |
| Practices you could realistically win in 3 years (sales capacity, churn, competitors) | 600 | SOM = $1.8 million |
Notice what carries the weight. TAM is just count times price. SAM comes from filters you can defend (region, practice size). SOM comes from your own capacity: how many reps or how much marketing you can fund, how long a sale takes, how many customers you keep. A SOM of 600 practices over three years is a sales-plan statement, and an investor can poke at every part of it.
If you can't explain where each input came from, the table will fall apart in a meeting. That's the point of building it this way.
Where founders get bottom-up counts
For US businesses, government data is free and credible. The SBA's market research guide points to free federal statistics, and its list includes NAICS industry classification codes, the U.S. Census Business Builder for data on your potential business market, and Statistics of U.S. Businesses. Look up your target customers' NAICS code first, then pull counts of businesses by size and location.
Outside the US, national statistics offices usually publish something equivalent. Search for business registers or establishment counts by industry and region.
Where no dataset fits, build counts from the ground: trade association member lists, license registries, directories, or a hand count in one city that you then scale up and label as an assumption. Whatever you use, keep the source next to the number.
Common mistakes
- The "1% of a huge market" line. Saying "the market is $50 billion, so 1% is $500 million" tells an investor nothing about how you'd win a single customer. It's a weak spot in a market-size slide because it skips the hard part. Replace it with a count of customers and a plan to reach them.
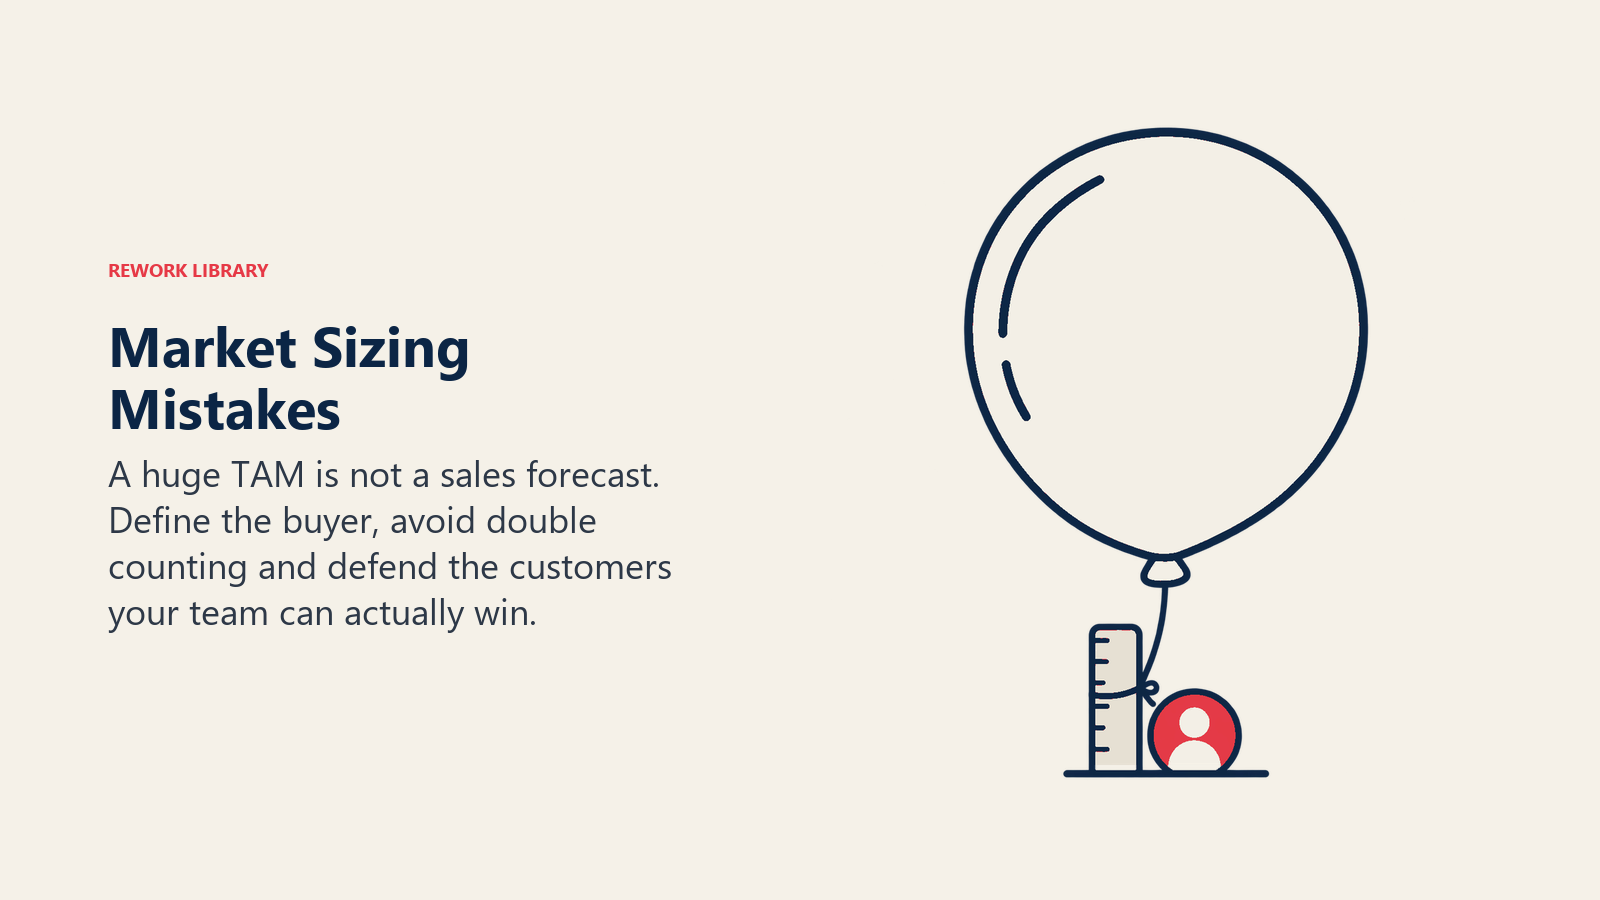
- Confusing TAM with revenue. TAM is the pool. Your forecast has to come from SOM and your sales plan, not from the outer circle.
- Defining the market so broadly it isn't yours. If your product serves dental practices, the whole healthcare IT market isn't your TAM. Match the market to the product you sell today and the one you can credibly add next.
- Double counting. Counting the same buyer under two segments, or counting both the company and each of its employees at full price, inflates every circle. Define the unit of purchase (company, seat, location) and stick to it.
- Ignoring pricing reality. A TAM at list price for a customer who'd never pay it is fiction. Use a price you've seen customers accept, or flag it as an assumption.
- Static numbers. Markets grow, shrink and get redefined. Say the year behind each input.
- Sizing only the category that exists. New products sometimes create their own demand. That's real, but it's an argument you have to make with evidence, not a reason to skip the math.
How investors read market size
Investors want to see that the market is big enough to produce a large outcome, and that you understand who your customers are. Sequoia's guide to writing a business plan lists "Market potential" as one of the sections, and its instruction is short: identify your customer and your market, and note that some of the best companies invent their own markets. Sequoia doesn't ask for a number in that line. It asks for clarity about who the customer is.
In practice that means your market slide earns trust when it shows three things:
- A specific buyer, not "SMBs" or "enterprises" in general.
- A count and a price you can trace to a source or a clearly marked assumption.
- A path from the first customers to a bigger SAM, so the story doesn't stop at the beachhead.
Early investors such as an angel investor will often spend only a minute on this slide. Make it fast to read and hard to attack. A lead investor in a later round will go deeper and test your inputs against their own research.
Connecting market size to the rest of your plan
Market size doesn't live alone. It has to agree with other numbers in the same document:
- Your SOM needs a go-to-market strategy that explains how customers get found and closed.
- Your price and customer count need to survive contact with unit economics. If acquiring each customer costs more than they pay over their lifetime, a large TAM won't help.
- Your customer acquisition cost determines how fast the SOM can actually be captured with the cash you have.
- At the idea stage, a rough bottom-up count is enough to decide whether the problem is worth pursuing. Detailed models can wait.
- Whatever market you claim feeds into the story behind your valuation.
Key Facts: TAM, SAM and SOM
- TAM is the total revenue available for a product category. SAM is the part you can serve. SOM is the part you can realistically win in a set period.
- Bottom-up sizing (count of buyers times price) is easier to defend than a top-down percentage of an industry report.
- Sequoia's business-plan guide includes "Market potential" and asks founders to identify their customer and their market (Sequoia Capital).
- The SBA lists NAICS codes, the Census Business Builder and Statistics of U.S. Businesses among free federal sources for market research (SBA).
- The worked example in this article is illustrative arithmetic, not research data.
- TAM is a pool of revenue, not a forecast of your revenue.
Related reading
