加重パイプライン:確率ベースの商談評価とforecast手法
Turn this article into takeaways for your work.
Each assistant summarizes the article only for you and suggests best practices for your work.
加重パイプラインとは、各商談の金額にクローズ確率を掛け合わせた売上forecast手法です。合計金額は生のpipeline残高ではなく、期待される受注額を示します。200万円の商談が30%の確率であれば、60万円として計算されます。この確率調整済みの視点により、現実的にクローズできる金額が明確になるため、財務担当役員や収益責任者は総pipeline額ではなくこの指標を重視します。
営業部長が宣言します。「Q2のpipelineは4.2億円です。目標は1.2億円ですから、余裕があります。」
しかし四半期終了の3週間前、受注額はわずか6,000万円。「確実」と思われていた商談の半数が先送りになりました。役員会は非常に厳しい雰囲気になります。
このような事態が起きるのは、多くの企業が総pipeline額を追っているためです。この数字は意味を持ちません。クローズ確率に関わらず、すべての商談を等しく扱うからです。ディスカバリー段階(成約確率10%)の1,000万円の商談も、契約審査段階(成約確率90%)の1,000万円の商談も、同じ価値として計上されます。dashboardには豊富なpipelineが表示されますが、forecastは実態とかけ離れています。
加重パイプラインは、商談金額にクローズ確率を掛け合わせることでこの問題を解決します。pipelineに含まれているものと実際に受注できるものの違いを明確に示すのがこの手法です。予測可能な収益を求めるCFOや、forecast未達に悩むCROにとって、加重パイプラインは任意の分析ツールではなく、事業運営の基盤です。
加重パイプラインとは何ですか?
加重パイプラインは、各商談のクローズ可能性に基づき、商談金額に確率の乗数を適用するものです。すべての商談を額面通りに合計するのではなく、それぞれの期待値を計算します。
計算式はシンプルです。
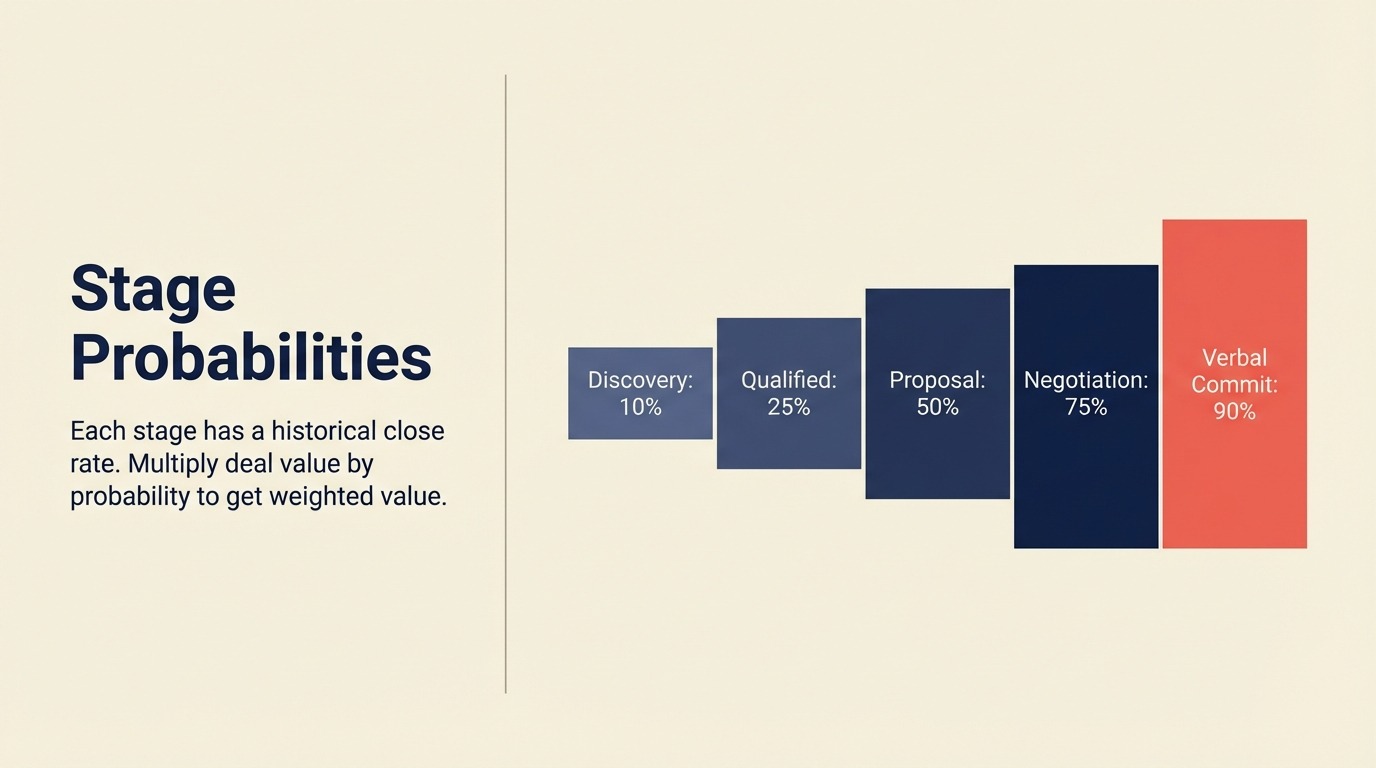
加重値 = 商談金額 × クローズ確率
確率30%の200万円の商談は、加重pipelineに60万円を計上します。確率80%の50万円の商談は40万円を計上します。この確率調整済みの視点により、理論的に追いかけている金額ではなく、現実的にクローズできる金額が明確になります。
総pipeline額が誤解を招く理由
総pipeline額は3つの問題を引き起こします。
初期段階の商談が多いことによる偽りの安心感。 ディスカバリー段階に500万円の商談が10件ある担当者のpipelineは5,000万円と表示されます。ディスカバリーからのコンバージョン率が15%であれば、実際の価値は750万円です。quota達成を計画する際には、この差は非常に大きなものになります。
質と量を区別できない。 2人の担当者がいずれも2億円のpipelineを持っているとします。1人は平均確率20%の商談が40件、もう1人は平均確率70%の商談が8件あります。総pipeline額では両者は同等に見えます。しかし加重パイプラインで見ると、後者の担当者は前者の3〜4倍の売上をクローズすることがわかります。
カバレッジモデルのズレ。 総pipeline額に対して3倍のカバレッジを設定している場合、初期段階を過剰に積み上げ、後期段階が不足するという事態が生じます。加重モデルを使えば、ステージ確率に基づいた適切なカバレッジが実現します。
その結果、営業リーダーは採用、quota設定、担当区域の判断を、商談が成熟するにつれて消えてしまう幻のpipelineに基づいて行うことになります。
確率割り当て手法
加重パイプラインの精度は、確率の割り当て方法に完全に依存します。主要な手法は4種類です。
1. ステージベースの自動割り当て
最も一般的なアプローチで、過去のコンバージョン率に基づき、各pipelineステージに固定確率を割り当てます。商談が「提案」ステージに進むと、そのステージに設定された確率(通常40〜50%)が自動的に付与されます。この手法は、商談の進行を管理するステージゲート基準と密接に連動しています。
メリット:
- シンプルで一貫性があり、担当者の入力が不要
- CRMのワークフローに簡単に実装できる
- 標準化されたforecastカテゴリーを作成できる
- 確率評価から個人のバイアスを排除できる
デメリット:
- 商談固有の状況(競合状況、予算タイミング、チャンピオンの影響力)を無視する
- 同じステージのすべての商談がクローズ確率が等しいと仮定する
- ステージ進行に関するゲームプレイを生む可能性がある
- 担当区域やセグメントの違いに適応できない
ステージベース手法は、取引速度が速く、購買パターンが一定で、担当者の裁量が限定的なトランザクション営業に最適です。
2. 担当者の判断(手動上書き)
担当者が商談の健全性、競合状況、購買者のコミットメントに対する自らの評価に基づき、クローズ確率を手動で設定します。これはステージベースのデフォルト値を上書きまたは補完するものです。
メリット:
- 商談固有の情報(経営幹部のサポート、予算確定、競合の排除)を反映できる
- 担当者の経験と判断を活かせる
- 特殊な状況や前倒しのタイムラインに対応できる
- 商談の動向リアルタイムの変化を反映できる
デメリット:
- バイアスが入る。楽観的な担当者は過大評価し、悲観的な担当者は過小評価する傾向がある
- チーム間で基準が統一されない
- 検証やベンチマーク設定が難しい
- インセンティブによっては、サンドバッグや強気のforecastを生む可能性がある
手動上書きは、商談の複雑さや独自性が高く、標準化された確率が意味をなさない場合、つまりエンタープライズ商談、複雑なサービス、カスタム実装などに適しています。
3. AI/ML予測
機械学習モデルが過去の商談データを分析し、商談特性、購買者行動、エンゲージメントパターン、営業活動、過去の結果など多数のシグナルに基づいてクローズ確率を予測します。
メリット:
- 人間やルールベースのシステムよりはるかに多くの変数を処理できる
- 結果から学習し、精度を継続的に改善する
- 自明でない予測パターンを特定できる
- 確率評価から人的バイアスを排除できる
デメリット:
- 相当量の過去データが必要(通常2年以上、数千件の商談)
- ブラックボックス予測は透明性に欠ける
- データに含まれる過去のバイアスを継続させる可能性がある
- 歴史的パターンのない市場変化や新製品への対応が難しい
AI駆動の確率は、豊富なデータ履歴を持ち、モデルの実装・維持に必要な技術力を持つ、取引速度の高い営業組織に適しています。
4. ハイブリッドアプローチ
成熟したforecast体制のほとんどは、複数の手法を組み合わせたハイブリッドモデルを採用しています。
- ステージベースの確率をベースラインとして使用
- 特定条件が揃った場合(承認済み予算、署名済みLOI、実装日確定)に担当者が上書き
- 担当者の評価と予測確率の乖離をAIモデルが検出してフラグを立てる
- 担当者の上書きがモデル予測と大幅に異なる商談に対してマネージャーがレビュー
この多層アプローチは一貫性、判断力、データドリブンな予測のバランスを取りながら、説明責任を維持します。
標準的なステージ確率
標準確率は、各ステージでの期待コンバージョンに基づいてpipelineをウェイト付けするためのスタートモデルを提供します。
営業プロセスは企業によって異なりますが、業界ベンチマークはステージベースの確率割り当てにおける出発点を提供しています。
ディスカバリー / 初回コンタクト(10〜20%)
商談がpipelineに入ったばかりの段階です。見極めは予備的なものです。購買者は興味を示しましたが、予算、タイムライン、決裁権を確認していません。この段階では、多くの商談が失格または停滞します。
典型的な特徴:
- 初期のニーズ評価が実施済み
- 基本的な適合性を確認済み(適切な企業規模、業種、ユースケース)
- 購買者が探索的な対話に同意済み
- 予算やタイムラインが確認されていない
この段階での効果的な商談の見極めにより、未見極め商談によるpipelineの膨張を防ぎます。
次ステージへのコンバージョン率: 25〜35%
見極め / ニーズ分析(20〜30%)
商談が初期見極めを通過しました。購買者が真の課題、おおよそのタイムライン、予算規模を確認しました。主要なステークホルダーと経済的決裁者を特定済みです。ただし、競合他社の選択肢はまだ存在し、購買者は特定のソリューションアプローチへのコミットを示していません。
典型的な特徴:
次ステージへのコンバージョン率: 40〜50%
提案 / ソリューションプレゼンテーション(40〜50%)
購買者が正式な提案を依頼、またはソリューションプレゼンテーションに参加しました。価格と実装アプローチを提示済みです。商談には勢いがありますが、異論や競合からの圧力は引き続き存在します。
典型的な特徴:
- 正式な提案書を提出済み
- 価格を共有し、議論済み
- 実装計画の概要を提示済み
- 複数のステークホルダーとの面談を実施済み
次ステージへのコンバージョン率: 50〜60%
交渉 / 契約審査(60〜75%)
購買者が積極的に条件を交渉、または契約書の内容を審査しています。法務・調達チームが参加しています。商談は適合性や価値ではなく、条件次第でクローズまたは消失します。値引きや譲歩の議論が進行中です。
典型的な特徴:
- 「Commit」または「Closed Won - Forecast」としてマーク済み
- 法務チームが契約書をレビュー中
- 調達部門が条件を交渉中
- 経営幹部の承認を申請中
- 実装タイムラインを協議済み
次ステージへのコンバージョン率: 70〜85%
口頭合意 / 署名待ち(80〜90%)
購買者が口頭で購入を約束しました。契約条件に合意済みです。署名、最終承認、または支払い処理を待っている状態です。予算凍結、担当役員の離席、買収といった例外的な事情がない限り、商談はクローズします。
典型的な特徴:
- 経済的決裁者からの口頭コミットを取得済み
- すべての異論を解消済み
- 条件を最終決定済み
- 発注番号を受領済み、または署名待ち
- 実装キックオフをスケジュール済み
クローズへのコンバージョン率: 85〜95%
これらの確率はB2Bセールス全体の平均値を示しています。自社の過去データから算出した実際のコンバージョン率を確率割り当ての基準として活用してください。
過去データを使用した確率のカスタマイズ
一般的なステージ確率は出発点であって、絶対的な基準ではありません。成熟したforecast体制では、実際のコンバージョンデータに基づいて確率を調整します。
過去のコンバージョン率の計算
12〜24か月分のクローズ商談(受注と失注の両方)を抽出します。各ステージについて以下を計算します。
ステージコンバージョン率 = (次ステージに進んだ商談数)÷(そのステージに達した商談の総数)
「提案」ステージに達した商談が250件あり、そのうち125件が「交渉」ステージに進んだ場合、提案から交渉へのコンバージョン率は50%です。
各ステージのコンバージョン率を掛け合わせると、各ステージからの累積クローズ確率が求められます。
提案ステージのクローズ確率 = 提案→交渉率 × 交渉→口頭合意率 × 口頭合意→クローズ率
この計算により、業界平均や勘ではなく、過去の結果に基づいた自社のステージ別実際クローズ率が明らかになります。
商談特性別のセグメント分析
集計されたコンバージョン率の背後には大きな差異が隠れています。以下の軸で分析を細分化します。
商談規模: エンタープライズ商談(1,000万円超)はSMB商談(250万円未満)よりもステージ確率が低い傾向がありますが、セールスサイクルは長くなります。
営業セグメント: 新規受注は、アップセルや更新商談とは異なるコンバージョンパターンを示します。
業種: 規制の厳しい業界(医療、金融サービス)は、複雑な承認プロセスのため、初期ステージでの確率が低い傾向があります。
リードソース: 高い購買意欲を持つチャネルからのインバウンド商談(デモリクエスト、価格問い合わせ)は、アウトバウンドのコールドアプローチの2〜3倍のコンバージョン率を示します。
担当者の在籍年数: 1年目の担当者は、ベテラン担当者と比較してコンバージョン率が15〜25%低い傾向があります。
これらの特性に基づいてベース確率を調整する確率マトリクスを作成します。医療業界の1,000万円の新規エンタープライズ商談であれば提案ステージで25%の確率となる一方、既存顧客への300万円のアップセル商談であれば同ステージで60%となる場合もあります。このアプローチは、商談をこれらの特性で整理するための効果的なpipelineセグメンテーションを必要とします。
ステージ別エントリー時のwin rateを追跡する
ステージ間のコンバージョンだけでなく、各ステージに達した商談の最終的なwin rateを追跡します。これにより累積クローズ確率が明らかになります。
- ディスカバリー段階に達した商談:最終的に12%がクローズ
- 見極め段階に達した商談:最終的に28%がクローズ
- 提案段階に達した商談:最終的に45%がクローズ
- 交渉段階に達した商談:最終的に68%がクローズ
- 口頭合意段階に達した商談:最終的に87%がクローズ
これらの累積win rateにより、確率割り当ての妥当性を検証できます。提案ステージに達した商談が45%クローズするのであれば、正確な加重forecastを生成するために提案ステージの確率は約45%に設定すべきです。
加重パイプラインと非加重パイプラインの使い分け
加重・非加重どちらのpipeline表示も、それぞれ明確な目的があります。
非加重pipelineを使うべき場面
キャパシティプランニングと担当者の業務量: 商談の総件数と総額は、クローズ確率に関わらず担当者の忙しさを示します。商談が60件ある担当者は、加重値が同じであっても15件の担当者より多くの時間とサポートが必要です。
マーケティングとリード獲得目標: マーケティングはファネルの上部でボリュームを生成します。その成功指標は作成した総pipeline額を追跡するものであり、確率の割り当ては見極め後の下流で行われるため、加重pipelineは対象外です。
初期ステージのpipeline健全性: ディスカバリーと見極めステージの健全性は、将来の四半期にとって重要です。非加重の初期ステージpipelineは、2〜3四半期先の加重後期ステージpipelineを予測します。
活動を促進するためのインセンティブ設計: 一部の報酬プランでは見込み開拓活動を促進するためにpipeline生成に報酬を与えます。非加重メトリクスは確率操作を排除することでサンドバッグを防ぎます。
加重pipelineを使うべき場面
収益forecast: 加重pipelineは期待受注額と直接相関します。正確なquota達成と収益予測の基盤です。
カバレッジ分析: 目標達成に必要なpipelineの把握は加重pipelineに依存します。200万円の受注が必要で加重pipelineが180万円であれば、総pipeline額に関わらずカバレッジに不足があります。
商談の優先順位付け: 担当者はクローズが近い高確率の商談に集中すべきです。加重値を見ることで、確率15%の200万円の商談よりも確率80%の50万円の商談の方が価値が高いと判断できます。
パフォーマンス評価: 担当者の有効性は、総pipeline膨張よりも加重pipelineの進行で評価する方が適切です。新規商談を追加せずにステージを進めた担当者でも、加重値を向上させることができます。商談の進行管理の実践は加重pipeline成長に直接影響します。
リソース配分: セールスエンジニアリング、ソリューションコンサルティング、経営幹部のスポンサーシップは、初期段階の見込みの薄い商談よりも、確率の高い加重商談を優先すべきです。
最良のforecastシステムは、それぞれの使用場面を明確にしながら両方の視点を提示します。
加重pipelineカバレッジ分析
加重カバレッジ分析は、リスク調整済みpipelineをquotaおよびforecast目標と比較します。
カバレッジ比率(quota達成に必要なpipelineの倍数)は、加重pipelineと非加重pipelineで計算した場合に大きく異なります。
従来の(非加重)カバレッジ
標準的なモデルでは3〜5倍のpipelineカバレッジが必要とされています。
- Quota:100万円
- 必要なpipeline:300〜500万円(総額)
- 前提:総pipelineの20〜33%がクローズ
これは大まかな目安としては機能しますが、精度に欠けます。後期ステージ商談が300万円(目標達成の可能性が高い)と初期ステージ商談が300万円(大幅に未達の可能性が高い)の区別ができません。
加重カバレッジモデル
加重アプローチでは、必要なカバレッジがpipelineの構成によって異なることを認識します。
pipeline の大半が初期ステージの場合(平均確率20%):
- Quota:100万円
- 必要な加重pipeline:100万円(目標達成のため)
- 必要な総pipeline:500万円(非加重)
- カバレッジ倍率:5倍
pipelineの大半が後期ステージの場合(平均確率70%):
- Quota:100万円
- 必要な加重pipeline:100万円
- 必要な総pipeline:140万円(非加重)
- カバレッジ倍率:1.4倍
これにより、単純なカバレッジ比率が誤解を招く理由が明らかになります。必要な倍数は、pipelineの質(ステージ分布とクローズ確率)に完全に依存します。
ステージ別カバレッジ要件
成熟したpipeline管理では、ステージ別にカバレッジ目標を設定します。
- ディスカバリーステージ:10倍カバレッジ(確率10%)
- 見極め:4倍カバレッジ(確率25%)
- 提案:2.5倍カバレッジ(確率40%)
- 交渉:1.5倍カバレッジ(確率67%)
- 口頭合意:1.1倍カバレッジ(確率90%)
バランスの取れたpipelineは、継続的な進行を確保するために各ステージで適切なカバレッジを維持します。提案ステージのカバレッジが2倍を下回ると、初期ステージのpipelineが豊富であっても目標を達成できません。
forecastカテゴリーと加重pipelineの統合
多くのCRMでは商談の確度を分類するforecastカテゴリーを使用しています。Commit、Best Case、Pipeline、Omittedなどです。これらのカテゴリーは確率帯域を通じて加重pipelineと統合されます。
Commit(確率90〜100%)
担当者が今期クローズを保証する商談です。口頭コミットを取得済み、最終審査中、またはすでに受注で署名待ちの状態です。これらの商談が、リーダーシップが役員会に報告する「Commit Forecast」を構成します。
加重pipeline処理: 全額または全額に近い金額(90〜100%の乗数)
Best Case(確率60〜89%)
クローズの可能性が高いが保証されていない商談です。交渉や契約審査において前向きな勢いはありますが、潜在的な障害が残っています。「Best Case Forecast」(Commit+Best Case)を構成します。
加重pipeline処理: 特定ステージに基づく60〜89%の乗数
Pipeline(確率1〜59%)
初期および中期ステージの商談です。正当な可能性はあるが不確実性が高い見極め済みの商談。pipelineカバレッジ分析と将来期間の計画に使用されます。
加重pipeline処理: 特定ステージに基づく1〜59%の乗数
Omitted(確率0%)
担当者が今期クローズしないと判断した商談で、将来四半期への先送りまたは失注の見込みです。現在の期間のforecastからは除外されますが、pipelineの可視性のためにCRMには残ります。
加重pipeline処理: 0%の乗数(加重計算から除外)
このカテゴリーと確率の整合により、forecastの集計値が加重pipelineの計算と一致します。「Commit Forecast」は90〜100%の加重が付いた商談の合計と等しくなり、pipeline分析とforecastレポートの間で内部整合性が保たれます。
確率の上書き:担当者が調整する場面と方法
ステージベースの確率は一貫性を提供しますが、商談固有の状況では手動での上書きが必要になります。重要なのは、上書きが適切な場面について明確なガバナンスを確立し、理由の文書化を求めることです。
確率を上げる正当な理由
予算が書面で確認済み: 購買者が発注番号、承認済みの予算書類、または書面による予算確認を提示した場合。
競合が排除された: 購買者が自社ソリューションのみで進めることを明示し、他の選択肢の評価を中止した場合。
経営幹部によるスポンサーシップを確保: C-levelのチャンピオンが商談を積極的に推進し、特定のタイムラインにコミットしている場合。
法務レビューが進行中: 契約書が法務審査に移行しており、真剣な意図と社内承認のマイルストーンを通過していることを示している場合。
実装日のスケジュール確定: 購買者が実装をスケジュールし、プロジェクトマネージャーをアサインし、またはキックオフ日を設定した場合。
確率を下げる正当な理由
予算への異論: 財務チームがコストに異議を唱えるか、将来期間への先送りを要求している場合。
新たなステークホルダーの登場: 後期段階で、これまで知られていなかった意思決定者が入り、説明が必要になった場合。
競合からの圧力の増大: 強力な競合他社が説得力のある差別化や既存の関係を持って現れた場合。
タイムラインの遅延: 購買者が明確な理由なく、または新しいタイムラインを示さずに目標決定日を先送りした場合。
チャンピオンの退職: 社内の推進者が会社を去り、配置転換され、または影響力を失った場合。
エンゲージメントの欠如: 購買者がアウトリーチへの返答を止め、または複数回ミーティングを延期した場合。
上書きガバナンス
確率操作を防ぐためのガードレールを設定します。
書面による理由を必須とする: 担当者はCRMノートに上書きの具体的な理由を文書化する必要があります。
上書き範囲の制限: マネージャーの承認なしでの上書き範囲を制限します(例:ステージデフォルトから±20%以内)。
マネージャーレビューを自動発動: 大幅な上書き(特に20%超の増加)がある商談はマネージャーのレビューキューに表示されます。
上書きの精度を追跡: 上書き商談と通常商談のクローズ率を測定し、一貫した楽観主義やサンドバッグの傾向がある担当者を特定します。
高額商談の上書きを監査: 一定額(例:1,000万円以上)を超える商談で確率の上書きが行われた場合は、マネージャーまたはVPの承認が必要です。
このガバナンスは、担当者の判断と組織全体の一貫性・説明責任のバランスを取ります。
精度の追跡とモデルの検証
加重pipelineは、確率が現実を反映している場合にのみ価値を発揮します。継続的な検証により、モデルが正確なforecastを生成することを確認します。
forecast対実績の分析
毎期、予測収益(期初の加重pipelineの合計)と実際の受注額を比較します。以下を計算します。
Forecast精度率 = (実際の受注額 ÷ 予測受注額)× 100
成熟した組織では、「Commit」レベルで90〜95%、「Best Case」レベルで80〜85%のforecast精度を目標とします。
精度のトレンドを時系列で追跡します。精度の向上は確率のキャリブレーションが機能している証拠です。精度の低下はモデルのずれや操作のシグナルです。
確率キャリブレーションテスト
各確率帯域(0〜20%、21〜40%、41〜60%、61〜80%、81〜100%)について、実際のクローズ率を計算します。
60〜80%の確率が割り当てられた商談が実際には45%の確率でクローズする場合、確率が過大評価されています。40〜60%の確率の商談が65%でクローズする場合、確率が保守的すぎます。
理想的なキャリブレーション:実際のクローズ率が割り当てられた確率帯域と5〜10%以内で一致している状態です。大きな乖離がある場合は確率の調整が必要です。
ステージ進行の分析
各ステージから次ステージに進んだ商談と、停滞、先送り、または失注した商談を追跡します。
- 次ステージへの進行:確率評価の妥当性を確認
- 将来期間への先送り:現在のタイミングに対して確率が高すぎたことを示す
- 失注:高い確率を保つべきでなかった商談を確認
- 60日以上の停滞:pipelineを膨らませている可能性のある停止商談を示す
ステージベロシティを計算します。受注商談と失注商談それぞれについて各ステージでの平均日数を測定します。早くクローズする受注商談は初期ステージでの滞在期間が短いです。提案ステージに45日以上留まる商談は確率を下げるべきです。パイプラインベロシティメトリクスを理解することで、タイミングベースの確率調整を精緻化できます。
担当者レベルの精度スコアリング
担当者個人のforecast精度を測定し、体系的なバイアスを特定します。
楽観的な担当者: 実際のクローズ率より常に高くforecastする傾向(forecast精度が80%未満)
サンドバッグを行う担当者: forecast以上の成果を常に上げる傾向(forecast精度が120%超)
正確な担当者: 実際の受注額の10%以内でforecastする傾向(精度90〜110%)
このデータをコーチング、報酬調整、および集計forecastにおける担当者上書きへの比重設定に活用します。
加重pipelineの導入:実践的な展開方法
総pipeline額から加重pipelineへの移行には、技術的な設定、プロセスの変更、そして組織全体の連携が必要です。
技術的な設定
CRMの設定:
- ステージ別のデフォルト値を持つ確率フィールドを設定する
- 確率帯域に対するforecastカテゴリーのマッピングを作成する
- 加重pipelineのレポートとdashboardを構築する
- 承認ルーティングを含む上書きワークフローを確立する
データのクリーンアップ:
- pipelineを歪める古い商談(活動なし90日以上)を削除する。pipelineの衛生管理のベストプラクティスを参照
- ステージの定義とエントリー基準を標準化する
- 精度のベースライン設定のために過去の確率データを補完する
プロセスの導入
ステージエントリー基準を定義する: 商談が進行する時期を決定する明確で客観的な基準を設定します(担当者の裁量だけに依存しない)
上書きポリシーを設定する: 手動確率調整が適切な場面と必要な承認レベルを文書化します
forecastのリズムを確立する: 週次の担当者forecast提出、マネージャーによる集計、差異分析を行います
レビューの習慣を作る: pipelineレビューでは加重値、ステージ別カバレッジ、商談の進行に焦点を当てます
組織変革管理
営業チームのトレーニング: 加重pipelineが優れたforecastを生み出す理由と、forecast提出の変化について説明します
マネージャーのスキル強化: 確率のキャリブレーション、上書きガバナンス、および正確なforecastに向けた担当者コーチングについてマネージャーをトレーニングします
経営幹部との整合: リーダーシップが加重metricsと非加重metricsの違いと、それぞれをどの判断に用いるかを理解していることを確認します
インセンティブの整合: 量より質を評価するために、加重pipelineの達成度を報酬に組み込むことを検討します
移行には1〜2四半期かかります。初期は確率のキャリブレーションと行動変容の過程でforecastの変動が生じます。この調整期間を乗り越えることで、3四半期目には精度が大幅に向上します。
まとめ:感覚的な判断から統計的なforecastへ
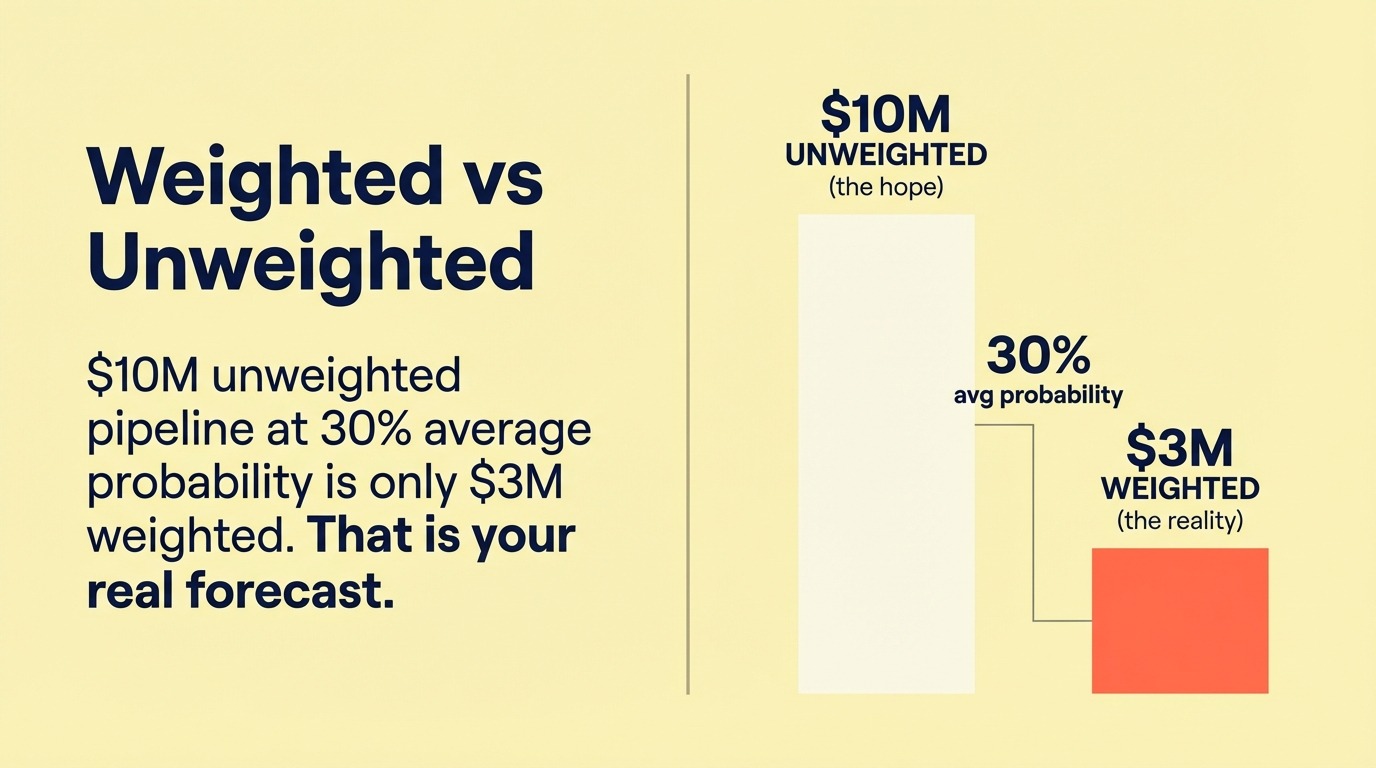
目標を一貫して達成する企業と、結果が大きく変動する企業の違いは何でしょうか。それはforecastの方法論です。総pipeline額は安心感を与えますが、現実を隠してしまいます。加重pipelineは、実際にクローズできるものについての誠実さを強制します。
確率ベースのforecastはpipeline管理を主観的な技術から測定可能なサイエンスへと変革します。会話の焦点を「pipelineは十分か?」(文脈なしでは意味がない)から「Q3目標達成のために提案ステージに十分な加重カバレッジがあるか?」(実行可能で具体的)へとシフトさせます。
規律ある加重pipeline手法を導入した組織は3つの優位性を得ます。
予測可能な収益: forecastが採用、投資、役員会へのコミットを推進できるほど信頼性が高まります。
効率的なリソース配分: 営業サポート、経営幹部のエンゲージメント、商談加速リソースが高確率の商談に集中します。
正確なキャパシティプランニング: 担当区域の設計、quota設定、人員配置の判断が、膨らんだ合計ではなく現実的なpipelineコンバージョンに基づいて行われます。
導入には技術的な設定、プロセスの規律、文化的な変革が必要です。しかし、現状のまま希望と合計値に基づいてforecastし続けることは、変動と目標未達を保証するものです。
加重pipelineは完璧ではありません。確率はすべての商談のニュアンスを捉えることはできません。しかし、すべての商談が等しくクローズできると仮定するよりはるかに正確です。forecastにおいては、おおよそ正しい方が、細かく間違っているよりも価値があります。
予測可能な収益を求めるCFO、forecast未達に悩むCRO、一貫した成長を期待する役員会、全員が同じものを必要としています。総pipeline額という幻想ではなく、確率で加重された現実です。
確率ベースのforecastを導入する準備はできましたか? 完全なforecastシステムを構築するために、pipelineメトリクスの概要とステージベースのforecastをご覧ください。
よくある質問
加重パイプラインとは何ですか? 加重パイプラインは各商談の金額にクローズ確率の乗数を適用し、その結果を合計したものです。100万円の商談をステージに関わらず100万円として計上するのではなく、期待値として計算します(例えば、確率40%の100万円の商談は40万円になります)。合計値は追いかけている金額ではなく、実際に受注できる見込み額を示します。
加重pipelineの値はどのように計算しますか? 各商談について「加重値 = 商談金額 × クローズ確率」の計算式を使い、それらを合計します。確率30%の200万円の商談は60万円、確率80%の50万円の商談は40万円を計上し、合計加重pipelineは100万円になります。
加重pipelineと非加重pipelineの違いは何ですか? 非加重(総額)pipelineはすべての商談を額面通りに合計するもので、キャパシティプランニングとリード獲得目標に有用です。加重pipelineはクローズ確率を考慮して調整するもので、収益forecast、カバレッジ分析、商談の優先順位付けにおいてより適切な基準となります。
各pipelineステージにはどのようなクローズ確率を使用すべきですか? B2Bの一般的なベンチマークでは、ディスカバリーで10〜20%、見極めで20〜30%、提案で40〜50%、交渉で60〜75%、口頭合意で80〜90%程度とされています。ベンチマークを固定値として扱うのではなく、自社の過去のコンバージョンデータを参照してこれらを調整してください。
関連リソース

Senior Operations & Growth Strategist
On this page
- 加重パイプラインとは何ですか?
- 総pipeline額が誤解を招く理由
- 確率割り当て手法
- 1. ステージベースの自動割り当て
- 2. 担当者の判断(手動上書き)
- 3. AI/ML予測
- 4. ハイブリッドアプローチ
- 標準的なステージ確率
- ディスカバリー / 初回コンタクト(10〜20%)
- 見極め / ニーズ分析(20〜30%)
- 提案 / ソリューションプレゼンテーション(40〜50%)
- 交渉 / 契約審査(60〜75%)
- 口頭合意 / 署名待ち(80〜90%)
- 過去データを使用した確率のカスタマイズ
- 過去のコンバージョン率の計算
- 商談特性別のセグメント分析
- ステージ別エントリー時のwin rateを追跡する
- 加重パイプラインと非加重パイプラインの使い分け
- 非加重pipelineを使うべき場面
- 加重pipelineを使うべき場面
- 加重pipelineカバレッジ分析
- 従来の(非加重)カバレッジ
- 加重カバレッジモデル
- ステージ別カバレッジ要件
- forecastカテゴリーと加重pipelineの統合
- Commit(確率90〜100%)
- Best Case(確率60〜89%)
- Pipeline(確率1〜59%)
- Omitted(確率0%)
- 確率の上書き:担当者が調整する場面と方法
- 確率を上げる正当な理由
- 確率を下げる正当な理由
- 上書きガバナンス
- 精度の追跡とモデルの検証
- forecast対実績の分析
- 確率キャリブレーションテスト
- ステージ進行の分析
- 担当者レベルの精度スコアリング
- 加重pipelineの導入:実践的な展開方法
- 技術的な設定
- プロセスの導入
- 組織変革管理
- まとめ:感覚的な判断から統計的なforecastへ
- よくある質問
- 関連リソース