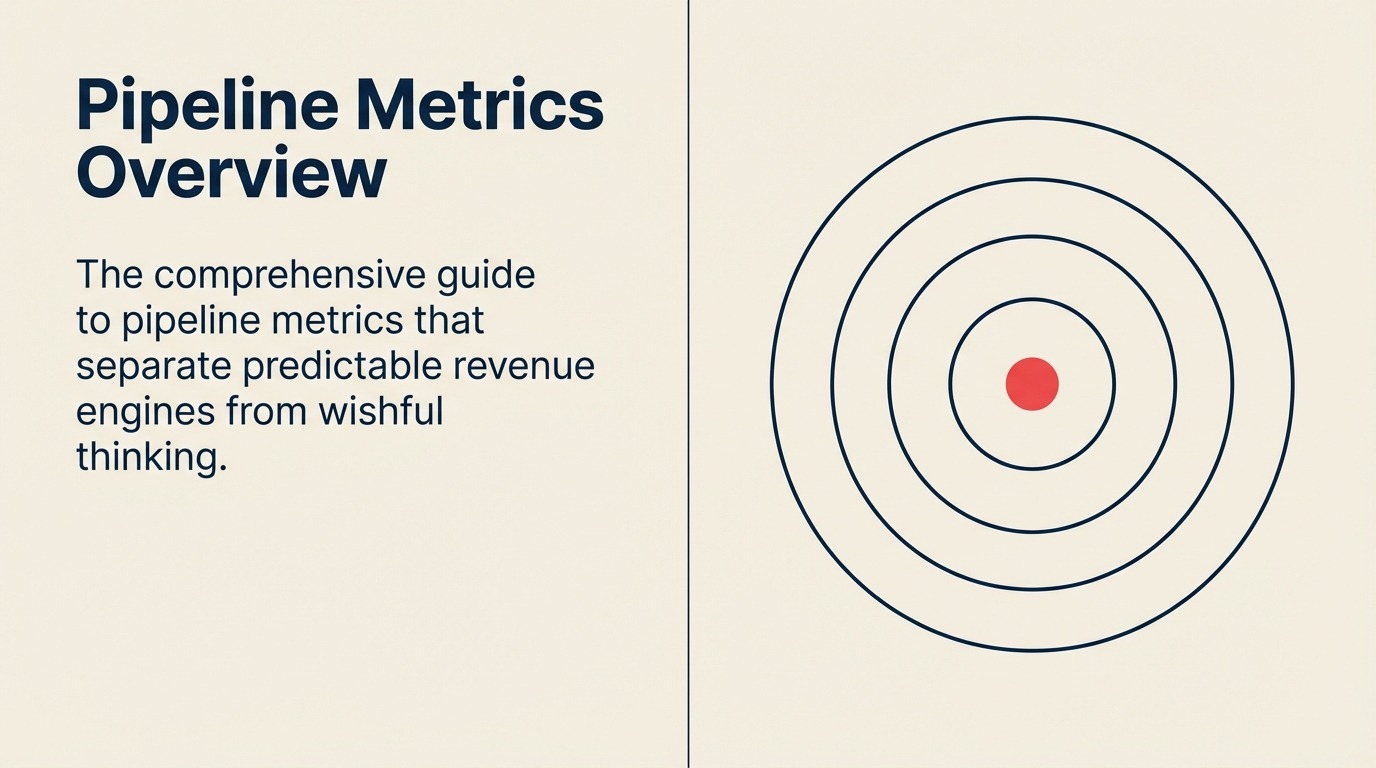
パイプライン指標の概要: 収益の健全性を映すダッシュボード
Turn this article into takeaways for your work.
Each assistant summarizes the article only for you and suggests best practices for your work.
ピーター・ドラッカーの言葉は的を射ています。「測定されるものは管理される」。
しかし、不都合な真実があります。多くの収益リーダーは、間違ったものを測定しています。あるいは測定対象が多すぎるか、来四半期に何が起こるかではなく、3か月前に何が起きたかを教えてくれるものばかり測定しています。
パイプライン指標は、ダッシュボード上の単なる数字ではありません。それは、収益エンジンが全開で稼働しているのか、静かに壊れつつあるのかを明らかにします。継続的に目標を達成する企業と、毎四半期慌ただしく走り回る企業の違いは何でしょうか。それは運のよさではありません。測定に対する規律です。
予測可能な収益を構築するには、実際に重要な指標がどれか、それをどう正しく算出するか、そしてそれがパイプラインの健全性について何を語っているのかを理解する必要があります。
パイプライン指標が本当に役立つ条件とは
すべての指標が等しく価値を持つわけではありません。優れたパイプライン指標には3つの共通する特徴があります。
実行可能であること。 優れた指標は、何が起きたかだけでなく、何を変えるべきかを教えてくれます。「今月新規に創出されたパイプラインが目標を30%下回っている」はアクションを促します。「Salesforce内の商談総数」はアクションを促しません。
先行指標であること。 遅行指標(受注収益、勝率)は、すでに起きたことを教えてくれます。先行指標(新規パイプライン創出、初期段階のコンバージョン)は、これから起きることを予測します。両方が必要ですが、先行指標は介入する時間を与えてくれます。
比較可能であること。 担当者、地域、製品、期間で分解できる指標は、意味のある分析を可能にします。「全体の勝率は25%です」は興味深い情報です。「北東地域における5万ドル未満の商談の勝率が32%から18%に低下しました」は調査を要求します。
すべてをカバーする4つのカテゴリー
パイプライン指標は、ボリューム、質、ベロシティ、コンバージョンの4つに分類すると管理しやすくなります。
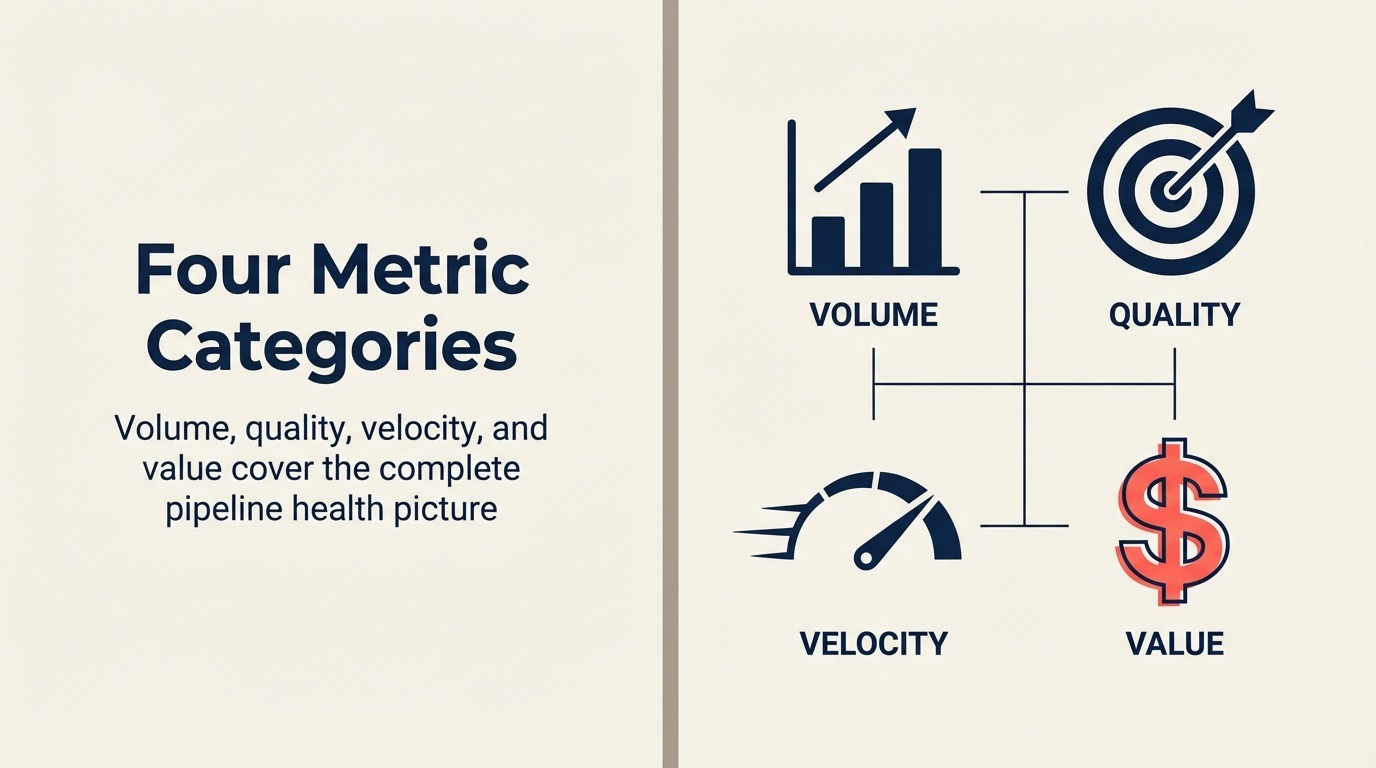
すべてのパイプライン指標は、この4つのカテゴリーのいずれかに分類されます。これらを習得すれば、健全性の全体像を理解できます。
ボリューム指標: 量と流れ
ボリューム指標は、どれだけのパイプラインがあり、それが自社のシステム内でどう動いているかを測定します。収益という貯水池の水位と流量を確認しているようなものだと考えてください。
質指標: コンバージョンと勝率
質指標は、パイプラインが本物の商談で満たされているのか、それとも根拠のない期待で満たされているのかを明らかにします。本気の購入者と冷やかしを見分け、実際に成約する商談の種類を教えてくれます。
ベロシティ指標: 速度と効率
ベロシティ指標は、商談がパイプラインをどれだけ速く通過するかを追跡します。速ければ良いとは限りませんが、自社の自然なペースを理解することで、ボトルネックや予測パターンが明らかになります。
金額指標: 規模と収益ポテンシャル
金額指標は、商談規模、分布パターン、確率調整済みの収益見込みといった商談の経済性を測定します。ここでボリュームが現実と向き合うことになります。
ボリューム指標: パイプラインの量を理解する
ボリューム指標は、「十分なパイプラインがあるか」という根本的な問いに答えます。
パイプライン総額
ステージや確度にかかわらず、パイプライン内のすべての進行中商談の合計額です。
重要な理由: これは自社の商談機会の全体像です。確度調整はされていませんが、特定期間における最大の収益ポテンシャルを示します。
算出方法: Status = Openとなっているすべての商談金額の合計
ベンチマーク範囲:
- B2B SaaS: 四半期収益目標の3〜5倍
- エンタープライズソフトウェア: 四半期収益目標の4〜6倍
- トランザクション型販売: 月間収益目標の2〜3倍
警告サイン: パイプライン総額が目標の3倍未満であれば、悪い月が一度来ただけで目標未達に陥ります。
ステージ別パイプライン
セールスプロセスの各ステージごとに分解されたパイプライン金額です。
重要な理由: この分布は、パイプラインが全体的に健全なのか、それとも初期段階や後期段階に偏っているのかを明らかにします。バランスの悪いパイプラインは、予測の問題や目標未達を生みます。
理想的な分布(7ステージのパイプラインの場合):
- 初期段階(1〜3): 40〜50%
- 中間段階(4〜5): 30〜35%
- 後期段階(6〜7): 20〜25%
効果的なパイプラインステージの設計方法を理解することは、意味のある分布目標を設定する助けになります。
警告サイン:
- 初期段階が60%超 = コンバージョンの問題
- 後期段階が15%未満 = 短期的な収益リスク
- 後期段階が40%超 = サンドバッギングまたは商談の停滞
新規パイプライン創出(期間比較)
特定期間内にパイプラインに追加された新規商談の金額です。
重要な理由: これは将来の収益を予測する先行指標です。今日の新規パイプライン創出が減少していれば、来四半期の目標未達を意味します。
算出方法: Created Dateが期間内に含まれる商談金額の合計
ベンチマーク範囲:
- 受注収益とパイプラインの自然減少分に等しいか、それを上回るべき
- 健全な水準: 四半期ごとに四半期目標の100〜125%を創出
- 高成長企業: 目標の150〜200%
追跡頻度: 戦術的な調整には週次、戦略的な計画には月次
パイプラインの追加対離脱
新規に追加された商談と、離脱した商談(受注、失注、対象外)を踏まえたパイプライン金額の純増減です。
重要な理由: パイプライン総額は問題を隠してしまうことがあります。毎月200万ドルを追加していても250万ドルを失っていれば、見出しの数字は安定して見えても、実際にはパイプラインは縮小しています。
算出方法:
パイプライン純増減 = 新規創出商談
                    + 受注商談
                    - 失注商談
                    - 対象外となった商談
健全なパターン: 純増減がプラスで、受注が離脱全体の20〜30%を占める
警告サイン: 2期連続で純増減がマイナスであれば、需要創出に問題がある兆候です
進行中商談数
パイプライン内の進行中商談の総数です。
重要な理由: パイプライン総額と組み合わせることで、平均商談規模と担当者のキャパシティが明らかになります。80件の進行中商談を抱える担当者と15件しか抱えていない担当者とでは、業務量がまったく異なります。
ベンチマーク範囲:
- エンタープライズAE: 進行中商談15〜30件
- ミッドマーケットAE: 進行中商談30〜50件
- SMB AE: 進行中商談50〜100件以上
警告サイン:
- 多すぎる場合: 注意が分散し、優先順位付けができていない
- 少なすぎる場合: 需要創出の問題、または過度に厳しい見極め
質指標: コンバージョンと勝率を測定する
質指標は、本物の商談とパイプラインの水増しとを見分けます。ボリューム指標がしっかりした土台の上に築かれているのか、それとも希望的観測に基づいているのかを明らかにします。優れた商談の見極めの実践は、これらの指標を直接改善します。
ステージ間コンバージョン率
あるステージから次のステージへ進む商談の割合です。
重要な理由: 全体の勝率は遅行指標です。ステージ間コンバージョンは、商談が正確にどこで滞留しているかを示し、具体的なコーチングの機会やプロセス上の問題を明らかにします。
算出方法: (次のステージに進んだ商談数 ÷ 現在のステージに入った商談数)× 100
ベンチマーク範囲(B2B SaaS):
- ディスカバリー → 見極め: 60〜70%
- 見極め → 提案: 50〜60%
- 提案 → 交渉: 60〜70%
- 交渉 → 受注: 70〜80%
分析テクニック: これらを週次で追跡してください。いずれかのステージ間コンバージョンが15%低下したら、直ちに調査すべき早期警告シグナルです。
全体の勝率
正常に成約に至った商談の割合です。
重要な理由: 勝率は、ターゲティング、見極め、セールス実行がうまく機能しているかどうかを明らかにします。パイプライン全体にとって究極の質指標です。
算出方法: (受注商談数 ÷ 総クローズ商談数)× 100
ベンチマーク範囲:
- エンタープライズB2B: 25〜35%
- ミッドマーケットB2B: 30〜40%
- トランザクション型B2B: 40〜50%
- 高速サイクルSaaS: 20〜25%
重要な注意点: 勝率は常に、未加工のリードではなく見極め済みの商談から測定してください。未検証の商談を含めると、指標が人為的に低くなります。信頼できる基準値を確立したら、勝率改善の戦略に取り組みましょう。
セグメント・担当者・製品別の勝率
意味のあるカテゴリーごとに分解された勝率です。
重要な理由: 全体の勝率は重要なパターンを覆い隠します。全体では30%の勝率でも、エンタープライズでは45%、SMBでは18%というように、ターゲティングの問題が隠れているかもしれません。
追跡すべき重要なセグメント:
- 企業規模(従業員数、売上高)
- 業界バーティカル
- 地理的リージョン
- 製品・ソリューションの種類
- 営業担当者
- リードソース
- 商談規模の区分
アクションのトリガー:
- セグメント間で20%以上の差 → ターゲティングまたはリソース配分の問題
- 担当者間で30%以上の差 → コーチングまたはテリトリー品質の問題
- 特定セグメントでの低下傾向 → 市場適合性または競合圧力の問題
失注分析と理由
商談が失注に至った理由を分類したものです。
重要な理由: 「競合に負けました」だけでは改善に役立ちません。「5万ドル未満の商談で価格面から競合Xに負けました」であれば、具体的に解決すべき対象が見えてきます。
標準的な失注カテゴリー:
- 名指しの競合に敗北
- 現状維持(意思決定なし)に敗北
- 予算・タイミングの問題
- 製品適合性・機能の問題
- 価格・価値認識の問題
- キーパーソンの離脱または組織変更
ベンチマーク範囲:
- 競合による失注: 30〜40%
- 現状維持による失注: 25〜35%
- 予算・タイミング: 15〜25%
- 製品・価格: 10〜15%
分析テクニック: 失注理由を月次で追跡してください。「競合Xによる失注」が四半期で15%から30%に急増した場合、競合上のポジショニングに変化が起きています。体系的な失注分析を実施することで、対処可能なパターンが明らかになります。
商談品質スコア
複数の要因に基づいて商談の健全性を示す複合スコアです。
重要な理由: すべてのパイプラインが同じ価値を持つわけではありません。関与するステークホルダーがいて競合評価が行われ、短期的なタイミングを持つ10万ドルの商談と、散発的な接触しかなくタイムラインが曖昧な10万ドルの商談は、まったく異なるものです。
一般的なスコアリング要因:
- ステークホルダーの関与度(頻度、役職の高さ)
- 競合状況(既存ベンダー、評価ステータス)
- 予算の確認状況
- タイムラインの明確さ
- 意思決定プロセスの理解度
- 課題の深刻さ
- キーパーソンの強さ
ベンチマークの考え方: 0〜100でスコアリングし、70以上を高品質な商談とみなします。パイプラインのうち70以上のスコアを持つ割合を追跡してください。
目標値: 後期段階のパイプラインの40〜60%が70以上のスコアを持つべきです
ベロシティ指標: 速度と効率を追跡する
ベロシティ指標は、パイプラインがどれだけ効率的にコンバージョンしているかを明らかにします。速ければ良いとは限りませんが、自社の自然なペースを理解することで、より良い予測が可能になり、隠れたボトルネックが明らかになります。
平均セールスサイクル期間
商談作成から成約(受注または失注)までの平均期間です。
重要な理由: セールスサイクルの長さは、キャッシュフロー、予測精度、担当者のキャパシティプランニングを左右します。180日のサイクルであれば、今日下した意思決定が半年後の収益に影響します。
算出方法: すべてのクローズ済み商談における(成約日 - 作成日)の平均
ベンチマーク範囲:
- エンタープライズB2B: 6〜18か月
- ミッドマーケットB2B: 3〜6か月
- SMB B2B: 1〜3か月
- 高速サイクルSaaS: 15〜45日
分析のヒント:
- 商談規模別にセグメント化する(大型商談ほど時間がかかる)
- 時間の経過に伴う傾向を追跡する(サイクルの長期化は問題の兆候)
- 受注と失注のサイクル長を比較する(失注が速い場合は見極めの問題)
各ステージの滞在期間
商談が各パイプラインステージに滞在する平均日数です。
重要な理由: 全体のセールスサイクル長は重要なパターンを隠してしまいます。平均120日のサイクルは問題なさそうに見えますが、実際には商談があるステージに90日もとどまっていることに気づくかもしれません。それがボトルネックです。
算出方法: ステージごとの(ステージ退出日 - ステージ進入日)の平均
ベンチマークの考え方: 自社の基準値を確立し、そこからの変動を追跡してください。通常14日かかるステージが突然28日かかるようになったら、問題の兆候です。
警告サイン:
- 初期段階が長すぎる = 見極めの問題
- 後期段階が長引く = 交渉の問題または商談の停滞
- 中間段階での滞留 = バリュープロポジションまたはキーパーソンの問題
ステージゲート基準を導入することで、商談が効率的にステージを進むようになります。
パイプラインベロシティ
商談金額、勝率、サイクル長を組み合わせた複合指標です。
重要な理由: この単一指標は、パイプラインが効率的に収益へと転換しているかどうかを捉えます。ベロシティが高いほど、より短い時間でより多くの収益が生まれます。
算出方法:
パイプラインベロシティ = (商談数 × 平均商談金額 × 勝率) ÷ セールスサイクル期間(日数)
例:
(100件の商談 × 5万ドル × 勝率30%) ÷ 90日 = 1日あたり16,667ドル
ベンチマークの考え方: 基準値を確立し、月次で追跡してください。絶対値ではなく傾向に注目します。
改善のレバー:
- 商談数を増やす(需要創出)
- 平均商談金額を増やす(ターゲティング、パッケージング)
- 勝率を上げる(見極め、セールス実行)
- サイクル長を短縮する(ボトルネックの解消)
関連記事: パイプラインベロシティ: ボリューム、金額、速度を組み合わせた指標
商談の加速と減速
そのステージにおける過去の平均よりも速く、あるいは遅く進んでいる商談です。
重要な理由: 加速している商談は強い購買意欲のシグナルであり、特別な注意を払うべきです。減速している商談はリスクを抱えており、介入が必要です。
算出方法:
- 現在のステージ滞在期間を過去の平均と比較する
- 20%以上速い(加速)または遅い(減速)商談にフラグを立てる
アクションのトリガー:
- 加速している商談: 優先順位を上げ、リソースを確保する
- 減速している商談: 担当者に確認し、障害を特定する
停滞商談の割合
定義された期間内に意味のある活動やステージ進行がなかった商談です。
重要な理由: 停滞商談はゾンビパイプラインです。パイプライン総額を水増ししますが、成約する可能性は低いものです。この指標はパイプラインハイジーンを促します。
算出方法: (30日以上活動やステージ変化のない商談数 ÷ 進行中商談総数)× 100
ベンチマーク: パイプライン全体の20%未満であるべき
警告サイン: 停滞商談が30%を超えると、パイプラインは水増しされており、予測は誤っています
対策: 担当者に停滞商談の見極め、前進、あるいは対象外化を求める月次パイプラインレビューを導入してください。定期的な商談滞留管理の実践は、パイプラインの健全性と正確性を保ちます。
金額指標: 商談の経済性を理解する
金額指標は、商談規模、分布、確率調整済みの収益見込みといった、パイプラインの経済的特性を明らかにします。
平均商談規模
受注商談の平均金額です。
重要な理由: 商談規模は、セールスサイクル、勝率、担当者のキャパシティ、収益の予測可能性、そのすべてに影響します。これを追跡することで、ターゲティングや製品構成のずれが明らかになります。
算出方法: 受注商談の総収益 ÷ 受注商談数
ベンチマークの考え方: セグメント別(エンタープライズ、ミッドマーケット、SMB)に基準値を確立し、月次の変動を追跡してください。
警告サイン:
- 低下傾向: 下位市場へのずれ、または値引き圧力
- ばらつきの増加: ターゲティングの一貫性欠如
- セグメントの縮小: 得意領域における市場の飽和
的を絞った商談規模の最適化の取り組みは、この指標を体系的に改善できます。
商談規模の分布
商談規模の区分ごとに分解されたパイプライン金額です。
重要な理由: 平均商談規模は分布パターンを隠してしまいます。1,000万ドルの平均は素晴らしく見えますが、実は商談の半分が100万ドル未満で、残り半分が2,000万ドル超だとしたらどうでしょうか。これらはまったく異なるセールスモーションを必要とします。
標準的な区分:
- エンタープライズ: 5万ドル未満、5万〜25万ドル、25万〜100万ドル、100万ドル以上
- ミッドマーケット: 1万ドル未満、1万〜5万ドル、5万〜10万ドル、10万ドル以上
- SMB: 5千ドル未満、5千〜2.5万ドル、2.5万〜5万ドル、5万ドル以上
理想的な分布: ターゲットセグメントに60〜70%、それより上に20〜30%、それより下に10〜20%
アクションのトリガー: パイプラインの40%超がターゲットセグメント外にある場合、ターゲティングの問題があります
ウェイテッドパイプライン金額
各ステージの勝率で調整されたパイプライン金額です。
重要な理由: パイプライン総額はすべての商談を等しく扱います。ウェイテッドパイプラインは、初期段階の商談が後期段階の商談より成約しにくいという現実を反映します。
算出方法: (商談金額 × ステージ勝率)の合計
例:
- ディスカバリー(確度20%): 100万ドル × 0.20 = 20万ドル
- 提案(確度50%): 50万ドル × 0.50 = 25万ドル
- 交渉(確度75%): 40万ドル × 0.75 = 30万ドル
- ウェイテッドパイプライン合計: 75万ドル
ベンチマーク: 自信を持った予測のためには、ウェイテッドパイプラインが四半期目標の100〜125%であるべきです
関連記事: ウェイテッドパイプライン: 総額を超えて見るべきもの
パイプラインカバレッジ比率
パイプライン総額と収益目標の比率です。
重要な理由: この単一指標は「目標達成に十分なパイプラインがあるか」という問いに答えます。収益リーダーが最初に確認するものです。
算出方法: パイプライン総額 ÷ 収益目標
ベンチマーク範囲:
- エンタープライズ: カバレッジ4〜6倍
- ミッドマーケット: カバレッジ3〜4倍
- SMB・トランザクション型: カバレッジ2〜3倍
警告サイン:
- 3倍未満: 深刻なパイプラインギャップ、目標達成は困難
- 7倍超: 水増し、見極め不足、またはサンドバッギング
関連記事: パイプラインカバレッジ分析: 本当に必要なパイプラインの量とは
期待収益(確率調整済み)
特定期間内のウェイテッドパイプライン金額の合計です。
重要な理由: これは統計的な予測、つまり過去のコンバージョンパターンに基づいて成約が見込める金額です。
算出方法: その期間に成約予定の商談について(商談金額 × 勝率)の合計
ベンチマーク: コミット予測の80〜90%と一致すべきです
差異分析:
- 期待収益 > 予測 = 保守的(またはサンドバッギング)
- 期待収益 < 予測を10%以上下回る = 積極的すぎる(またはパイプラインの問題)
先行指標対遅行指標: 何が予測し、何が報告するか
先行指標は将来の収益を予測する助けとなり、遅行指標はすでに起きたことを説明します。
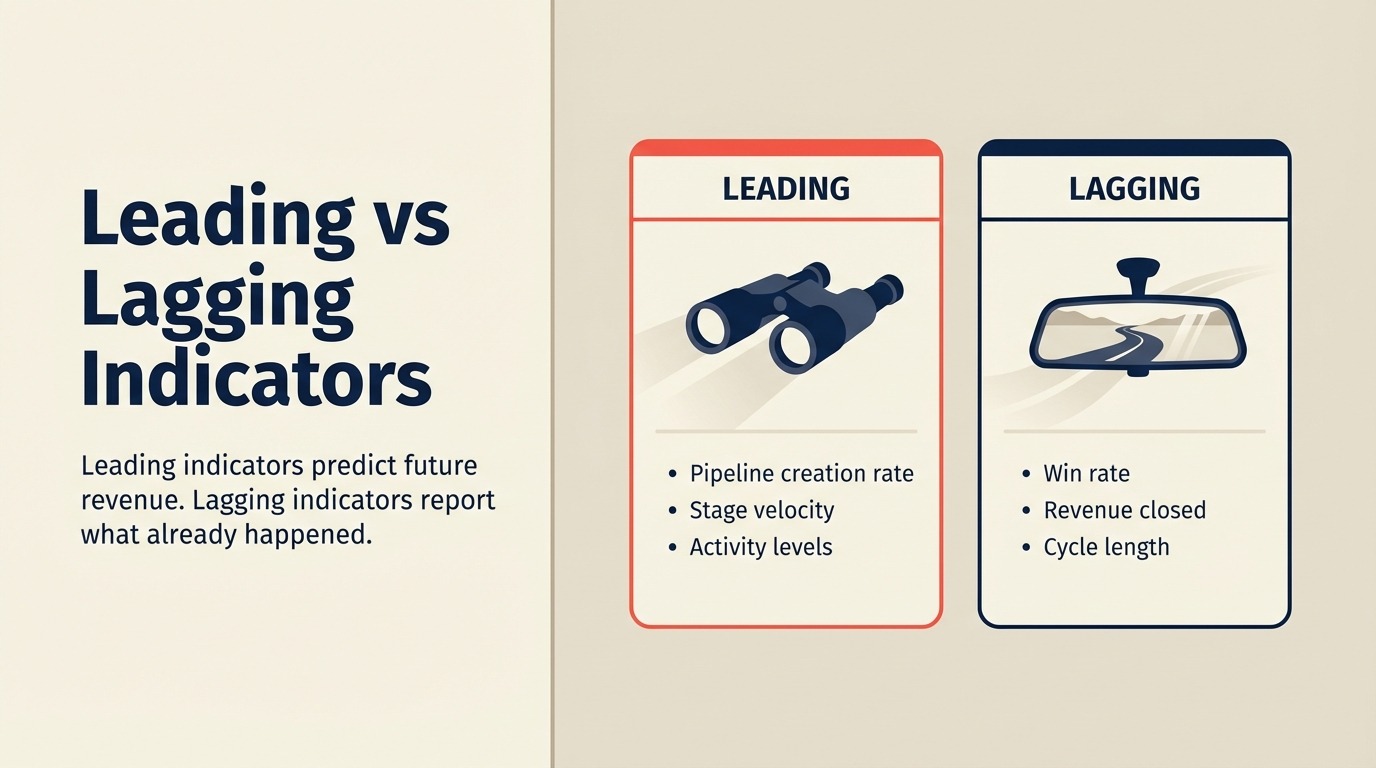
先行指標と遅行指標の違いを理解することは、主体的なパイプライン管理にとって不可欠です。
先行指標: これから起こること
先行指標は将来のパフォーマンスを予測します。介入する時間を与えてくれます。
新規パイプライン創出: 今日のパイプライン創出が来四半期の収益を左右します。今月の新規パイプラインが30%減少したら、60〜90日後には目標未達になります。
初期段階のコンバージョン率: ディスカバリーから見極めへのコンバージョンの変化は、90〜180日後の受注収益に現れます。
活動レベル: 完了したディスカバリーコール、送付済みの提案書、設定されたデモは、30〜60日先のパイプラインの健全性を予測します。
商談品質スコア: 初期段階での品質スコアの上昇は、60〜90日後の勝率上昇を予測します。
パイプラインカバレッジの傾向: カバレッジ比率の低下は、1四半期先の目標未達を予測します。効果的なパイプライン創出戦略は、カバレッジのギャップが収益不足になる前に対処します。
遅行指標: すでに起きたこと
遅行指標は結果を報告します。成果を理解するためには不可欠ですが、問題を修正する時間は与えてくれません。
勝率: すでに成約したことを教えてくれます。勝率が低下する頃には、その商談はすでに失われています。
受注収益: 究極の遅行指標です。パフォーマンス評価には役立ちますが、介入には使えません。
平均商談規模: 完了した商談を反映します。パターン分析には有用ですが、主体的な管理には使えません。
セールスサイクル長: 過去のパフォーマンスを示します。現在進行中の商談をセグメント化して分析する場合にのみ実行可能です。
バランスの取れたダッシュボードのアプローチ
効果的なパイプラインダッシュボードは、先行指標と遅行指標のバランスを取ります。
- 先行指標60%: 主体的な管理のため
- 遅行指標40%: パフォーマンスのアカウンタビリティのため
バランスの取れた指標セットの例:
- 先行指標: 新規パイプライン創出、初期コンバージョン率、パイプラインカバレッジ、活動指標
- 遅行指標: 勝率、受注収益、平均商談規模
業界・セグメント別の指標ベンチマーク
パイプライン指標は業界や商談セグメントによって大きく異なります。汎用的なベンチマークは誤った目標設定につながります。
B2B SaaSのベンチマーク
エンタープライズSaaS(ACV 10万ドル以上):
- 勝率: 25〜30%
- セールスサイクル: 6〜12か月
- パイプラインカバレッジ: 4〜5倍
- ステージ間コンバージョン: 50〜60%
ミッドマーケットSaaS(ACV 1万〜10万ドル):
- 勝率: 30〜35%
- セールスサイクル: 3〜6か月
- パイプラインカバレッジ: 3〜4倍
- ステージ間コンバージョン: 55〜65%
SMB SaaS(ACV 1万ドル未満):
- 勝率: 35〜45%
- セールスサイクル: 1〜3か月
- パイプラインカバレッジ: 2〜3倍
- ステージ間コンバージョン: 60〜70%
エンタープライズソフトウェアとサービス
複雑なエンタープライズ商談(50万ドル以上):
- 勝率: 20〜25%
- セールスサイクル: 9〜18か月
- パイプラインカバレッジ: 5〜6倍
- ステージ間コンバージョン: 45〜55%
プロフェッショナルサービス:
- 勝率: 30〜40%
- セールスサイクル: 2〜4か月
- パイプラインカバレッジ: 3〜4倍
- ステージ間コンバージョン: 60〜70%
業界による違い
金融サービス: サイクルが長い(コンプライアンス対応)、勝率は高め(関係性主導)
ヘルスケア: サイクルが長期化しやすい(調達プロセス)、勝率は中程度(臨床検証が必要)
テクノロジー: サイクルが短い(意思決定が速い)、勝率は低め(競争が激しい)
製造業: サイクルは中程度(評価期間あり)、勝率は高め(代替選択肢が少ない)
対策: 汎用的なソフトウェア業界の平均値ではなく、自社の業界とディールセグメントに合致する企業を基準にベンチマークしてください。
ダッシュボード設計: 3つの対象に向けた3つのビュー
効果的なパイプライン指標には、対象ごとに目的化されたダッシュボードが必要です。1つのダッシュボードですべての対象に対応することはできません。
エグゼクティブビュー: 戦略的な健全性
対象: CEO、CRO、取締役会
更新頻度: 月次(一部の指標は週次)
主要指標:
- 受注収益対目標(現状と傾向)
- パイプラインカバレッジ比率
- 新規パイプライン創出(期間比較)
- ウェイテッドパイプライン金額
- 勝率(全体およびセグメント別)
- セールスベロシティの傾向
設計原則:
- ドリルダウン可能な高レベルのサマリー
- 6〜12か月の履歴を示すトレンドライン
- RAGステータス表示(赤・黄・緑)
- 最小限の雑多さと最大限のシグナル
アクションの焦点: 戦略的なリソース配分、需要創出への投資、市場ポジショニング
マネージャービュー: チームパフォーマンス
対象: 営業マネージャー、セールスオペレーション
更新頻度: 週次
主要指標:
- 担当者別パイプライン(総額とウェイテッド)
- 担当者・セグメント別勝率
- ステージ間コンバージョン率
- 担当者別平均セールスサイクル
- 活動指標(通話、面談、提案書)
- 停滞商談の割合
- 担当者別新規パイプライン創出
設計原則:
- 比較可能なビュー(担当者間、チーム対目標)
- 個々の商談リストへのドリルダウン
- 週次の傾向と基準値からの乖離
- 例外レポーティング(パフォーマンス不振者をハイライト)
アクションの焦点: コーチングの機会、商談レビュー、リソース配分、パフォーマンス管理。定期的なパイプラインレビューは、これらの指標を実行可能なチーム改善へと変えます。
担当者ビュー: 個人のアカウンタビリティ
対象: 個々の営業担当者
更新頻度: 日次・リアルタイム
主要指標:
- 個人のパイプライン金額(総額とウェイテッド)
- ステージ別の進行中商談数
- 今日対応が必要な商談
- 進行中商談のステージ滞在期間
- 個人の勝率とクォータ達成率
- 今四半期のパイプラインカバレッジ
- 活動の完了状況(目標対比)
設計原則:
- アクション志向(今日何をすべきか)
- モバイル対応
- リアルタイム更新
- ゲーミフィケーション要素(進捗バー、達成表示)
アクションの焦点: 日々の優先順位付け、商談進行、活動の完了、クォータ追跡
指標運用の落とし穴: 避けるべきこと
優れた指標であっても誤用される可能性があります。以下のよくある落とし穴に注意してください。
バニティメトリクス(見栄えだけの指標)
印象的に見えるものの、意思決定を促さない指標です。
例:
- 文脈のないパイプライン総額
- コンバージョンとの関連がない活動件数
- 金額や質を考慮しない商談件数
対策: ボリューム指標は常に質・コンバージョン指標と組み合わせてください。
指標のごまかし
担当者が成果ではなく測定指標を最適化しようとすると、指標は悪い行動を促してしまいます。
例:
- サンドバッギング(来四半期を楽にするために商談を意図的に抑える)
- パイプラインの水増し(商談金額を膨らませる、見込みの薄い商談を追加する)
- 見極め前の早すぎるステージ進行
対策:
- 先行指標と遅行指標を一緒に測定する
- パイプラインハイジーンの要件(経過日数の上限、活動要件)を導入する
- 指標に適切な重み付けをする(パイプライン量よりも勝率を重視する)
過度な最適化
一つの指標に集中しすぎて、他の指標が犠牲になることです。
例:
- 対応時間への過度なこだわり → フォローアップの質より量を優先してしまう
- 勝率の最適化 → 商談を選り好みし、ボリューム目標を逃す
- パイプラインカバレッジの最大化 → 質の低いパイプラインの蓄積
対策: カテゴリー全体(ボリューム、質、ベロシティ、金額)を測定するバランスの取れたスコアカードを導入してください。
行動を伴わない測定
指標を熱心に追跡しても、その洞察に基づいて行動しないことです。
例:
- コンバージョン率の低下に気づいても根本原因を調査しない
- パイプラインカバレッジの低下を見ても需要創出を調整しない
- 担当者間のばらつきを特定してもコーチングしない
対策: すべての指標ダッシュボードは、特定の閾値で定義されたアクションをトリガーすべきです。
セグメンテーションの軽視
集計された指標は重要なパターンを覆い隠します。
例:
- エンタープライズとSMBのパフォーマンスが大きく異なるのに全体勝率だけを見る
- 製品ラインごとに異なるパターンがあるのに平均セールスサイクルだけを見る
- 地域ごとに状況が異なるのにパイプライン総額だけを見る
対策: 常に関連する軸(セグメント、担当者、製品、地域、ソース)でセグメント化してください。丁寧なパイプラインセグメンテーションは、意味のある比較分析を可能にします。
コンバージョン率分析: 深掘り
質指標の項目で簡単に触れましたが、コンバージョン率分析は、最もレバレッジの高い分析実践の一つとして特別な注目に値します。
関連記事: コンバージョン率分析: パイプラインの漏れを見つける
結論: 収益を動かすものを測定する
パイプライン指標は学術的な演習ではありません。収益エンジンがどこで成功し、どこで壊れつつあるかを正確に明らかにする診断ツールです。
継続的に目標を達成する企業には、魔法のような営業チームや幸運なタイミングがあるわけではありません。彼らには測定の規律があります。正しい指標を追跡し、適切にセグメント化し、明らかになったことに基づいて行動しているのです。
基本から始めましょう。
- ボリューム指標は「十分にあるか」に答えます
- 質指標は「それは本物か」に答えます
- ベロシティ指標は「効率的か」に答えます
- 金額指標は「その価値はどれほどか」に答えます
3つの対象それぞれに向けたダッシュボードを構築してください。経営層には戦略的なシグナルが、マネージャーにはパフォーマンス分析が、担当者には日々のアカウンタビリティが必要です。
最も重要なのは、見せかけの測定を避けることです。取締役会の資料で見栄えが良いからではなく、意思決定を促すからこそ指標を追跡してください。
測定するパイプライン指標が、達成する収益の成果を決定づけます。賢く選んでください。
パイプライン指標を最適化する準備はできましたか? セールスパイプラインとは何かという基礎知識が測定フレームワークとどうつながるか、そしてパイプラインカバレッジ分析が目標達成に十分なパイプラインがあるかをどう明らかにするかをご覧ください。
関連記事:

Senior Operations & Growth Strategist
On this page
- パイプライン指標が本当に役立つ条件とは
- すべてをカバーする4つのカテゴリー
- ボリューム指標: 量と流れ
- 質指標: コンバージョンと勝率
- ベロシティ指標: 速度と効率
- 金額指標: 規模と収益ポテンシャル
- ボリューム指標: パイプラインの量を理解する
- パイプライン総額
- ステージ別パイプライン
- 新規パイプライン創出(期間比較)
- パイプラインの追加対離脱
- 進行中商談数
- 質指標: コンバージョンと勝率を測定する
- ステージ間コンバージョン率
- 全体の勝率
- セグメント・担当者・製品別の勝率
- 失注分析と理由
- 商談品質スコア
- ベロシティ指標: 速度と効率を追跡する
- 平均セールスサイクル期間
- 各ステージの滞在期間
- パイプラインベロシティ
- 商談の加速と減速
- 停滞商談の割合
- 金額指標: 商談の経済性を理解する
- 平均商談規模
- 商談規模の分布
- ウェイテッドパイプライン金額
- パイプラインカバレッジ比率
- 期待収益(確率調整済み)
- 先行指標対遅行指標: 何が予測し、何が報告するか
- 先行指標: これから起こること
- 遅行指標: すでに起きたこと
- バランスの取れたダッシュボードのアプローチ
- 業界・セグメント別の指標ベンチマーク
- B2B SaaSのベンチマーク
- エンタープライズソフトウェアとサービス
- 業界による違い
- ダッシュボード設計: 3つの対象に向けた3つのビュー
- エグゼクティブビュー: 戦略的な健全性
- マネージャービュー: チームパフォーマンス
- 担当者ビュー: 個人のアカウンタビリティ
- 指標運用の落とし穴: 避けるべきこと
- バニティメトリクス(見栄えだけの指標)
- 指標のごまかし
- 過度な最適化
- 行動を伴わない測定
- セグメンテーションの軽視
- コンバージョン率分析: 深掘り
- 結論: 収益を動かすものを測定する