失われた Deal の分析: 損失から学んで Win Rate を改善する
Turn this article into takeaways for your work.
Each assistant summarizes the article only for you and suggests best practices for your work.
ここに、winning sales organizations をすべての他と separates するものがあります:彼らは理由の loses を理解することに執着しています。
「自分たちについて悪く感じましょう」in a way ではなく。「系統的に every loss をdissect、identify patterns、underlying issues をfix」in a way で。
ほとんどの企業は lost deals を failures の forget のような扱います。Elite sales operations はそれらを competitive intelligence、product feedback、process improvement opportunities の gold mines のように扱います。
Win rates を改善することが本気である場合、lost deal analysis を真面目にする必要があります。Quarterly review theater ではなく。Actual systematic analysis が変更を駆動する。
勝者が Losses に執着する理由
不快な真実:あなたはあなたの losses からあなたの wins より多くを学びます。
Wins は気分が良い。彼らは何をしているかを validate します。しかし彼らはあなたが vulnerable である場所、what competitors がより良く実行している場所、またはあなたの適格基準が壊れているかもしれない場所についてはあまり伝えられません。
Losses はすべてを伝えます。彼らは reveal します:
あなたの value proposition がfail する place specific competitors に対してです。あなたは integration capabilities で win するよあなたは think するかもしれませんが、70%の deals を lose する Competitor X に because their UI がより clean であり、buyers は technical depth より ease of use についてより care するため。
どの適格基準が actually predict wins を do ではない。あなたは company size を prioritize しているのかもしれませんが、lose の deals が「sweet spot」segment で competitors に who focus on use case maturity の代わりにします。opportunity qualification criteria あなたが revision が必要かもしれません。
製品の gaps がactually costing する revenue を。30%の enterprise deals を lose する場合 because SSO がない、それはもはや「nice to have」feature ではありません。それは product が prioritize が必要な revenue blocker です。
Which sales behaviors は correlate する losses と。多分 deals where reps が executives と early に engage する 60%の win rate を持ち、while those が practitioner level に stay する 75%の time を lose します。そのは anecdotal ではありません。それは how you coach を change が必要な data です。
Organizations が systematically に losses を analyze する 12ヶ月内に15~25%で win rates を improve。Magic を通じてではなく。Patterns を identifying と what が壊れているかをfixing を通じてです。
Loss Analysis の価値
Lost deal analysis は複数の dimensions 全体で価値を provide します:
Win Rate 改善
最も direct impact は future win rates の上です。Deals が lost である理由を understand するとき、あなたができます:
- Focus on winnable opportunities に適格基準を adjust する
- Common objections を address するために messaging を refine する
- Real loss patterns に基づいて reps を train競争力を置く
- Red flags を earlier に identify するために discovery processes を improve する
Competitive Intelligence
あなたの lost deals は continuous feed です competitive intelligence の。あなたは learn:
- Which competitors が win する which scenarios で
- What messaging と positioning を彼らは using している
- どのように they は pricing と packaging offerings を
- What their actual strengths と weaknesses は(not what marketing は says)
この intelligence は analyst reports より valuable です because それは based である actual buyer decisions in your market に。
Process Refinement
Loss analysis はreveal する process gaps:
- Deals lost を「no decision」へ signal する weak urgency-building
- Losses をlate stages で suggest する適格失敗earlier
- Competitive losses を specific segments で indicate する positioning problems
- Budget-related losses は reveal するかもしれません pricing model misalignment
これらの insights は drive する concrete process improvements むしろ vague「we need to do better」declarations より。
Product Feedback
Product gaps は surface する clearly in lost deals。40%の losses in a segment が missing capability を cite するとき、それはnot feature noise—それはaffect がrevenue する strategic product decision です。
Loss analysis はcreate する direct feedback loop から market reality に product roadmap prioritization に。
適格基準の調整
Over time、loss patterns は reveal which deal characteristics が predict する losses。多分 you が pursuing している:
- Companies in industries where you consistently lose する incumbents に
- Deal sizes where your pricing model は not work している
- Use cases そのseemのような good fits ですがnever close
- Loss analysis があなたをhelp する disqualify する these patterns earlier、freeing capacity を higher-probability opportunities に。
Loss Data Capture: 基礎を構築する
Good analysis は good data が start する。あなたは analyze することができません what you は capture しません。
Required Fields
Every lost opportunity は capture が should:
Primary loss reason - Main factor that はcaused する loss。Pattern analysis を enable するために standardized categories を use する。
Specific competitor - Not「another vendor」or「competitive loss。」Actual competitor names。「Lost to Salesforce」はactionable です。「Lost to competition」is useless。
Secondary factors - Many losses は have する multiple contributing factors。Capture してください2~3 をunderstand する complexity を primary reason を超えて。
Stage at loss - When in sales process は did you lose する?Losses at discovery vs.final negotiation は reveal する different problems。Understanding your pipeline stages design は help しますcontextualize して deals が failing している where を。
Customer feedback - Direct quotes から prospect conversations about why they は chose differently した。This qualitative data は add する context を quantitative patterns に。
Rep assessment - Whatは believe する rep わかりますが loss をcaused した?Sometimes this は differ する stated reasons から、そしてthat gap はinformative です。
Deal characteristics - Company size、industry、use case、deal size、sales cycle length。These は enable する segmentation analysis を。
Rep Input Requirements
Make は loss data entry を mandatory にしてください at opportunity closure。Not optional。Not「when you get around to it。」Required fields that block status changes までompleted。
Why?Because memory fades fast。A rep who はclose するそ lost opportunity immediately after loss call は have する relevant context。Three weeks later、it is「price、I think?」
Keep しますinput fields を simple にしてenough that reps は actually complete them(5~7 fields max)ですが structured enough をenable する analysis。
Customer Exit Interviews
For significant losses—enterprise deals、strategic accounts、competitive replacements—conduct してください customer exit interviews。
These は brief です(15~20 minute)conversations と prospect contact after they は decided しましょう go another direction。Ask:
- What はtheir top 3 factors in their decision でしたか?
- How は you compare する chosen vendor に on each factor か?
- What は could have changed their decision をしたか?
- What は did they wish you は asked した during process?
Exit interviews は uncover する truths that reps はmight miss or prospects は did not share directly に during sales process。
Timeline Documentation
Document keymoments in lost deals:
- When was opportunity created した?
- When did competitors enter evaluation か?
- When did momentum stall か?
- What events は precede loss decision をしたか?
Timeline analysis は reveal するwhether you は losing because you は arrived late、moved too slowly、or got out-executed をcritical moments で。This は connect する directly に pipeline velocity optimization へ。
Primary Loss Reasons: Taxonomy
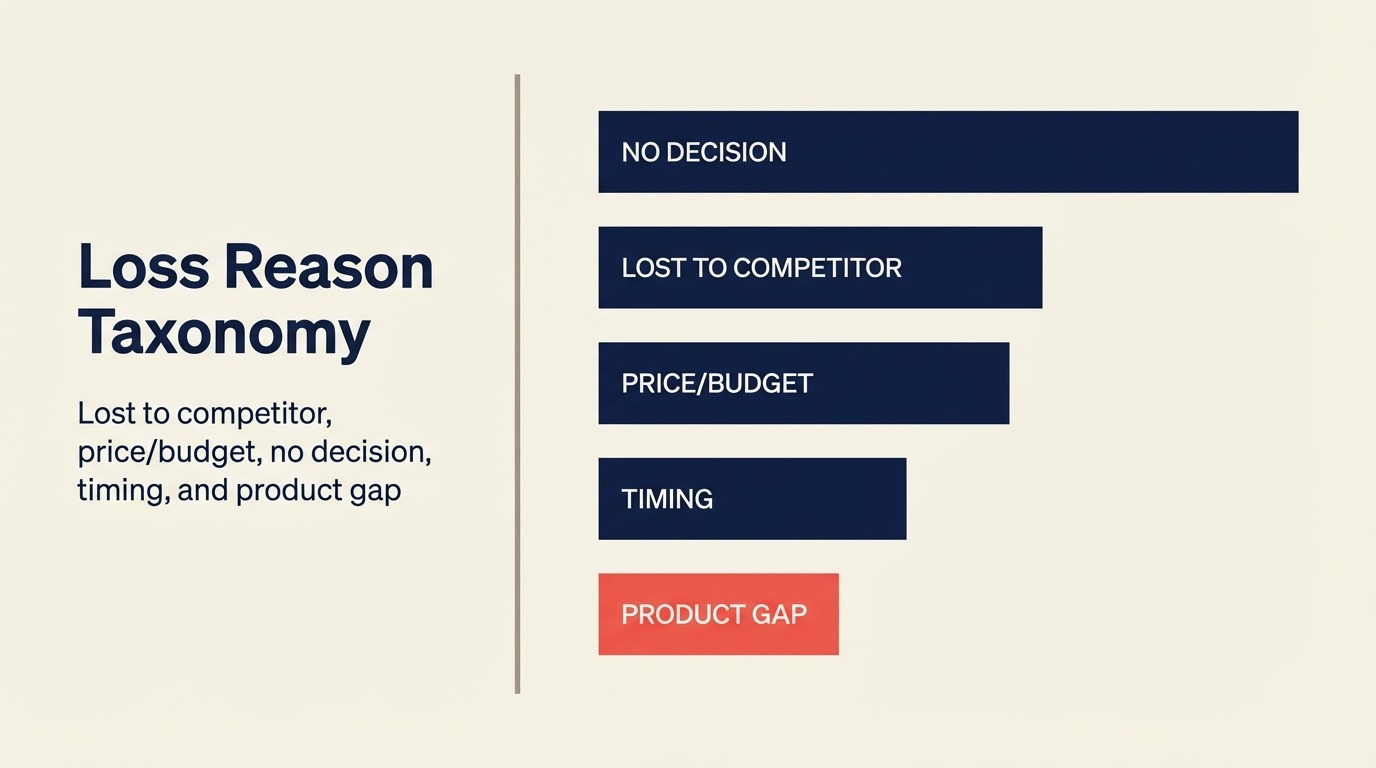
Standardized loss categories は enable pattern analysis。Here は a proven taxonomy:
Lost to Specific Competitor
Prospect は chose した competing solution。Always capture which competitor。これはyour most actionable category です because it は enable する competitive analysis と positioning refinement を。
Price/Budget Constraints
Prospect が could not afford your solution または chose した cheaper alternative primarily based on cost。Distinguish between「too expensive vs.alternatives」と「no budget available。」
No Decision Made
Prospect は did not move forward させたany solution で。これはoften the biggest「competitor」in B2B sales です。Signals weak urgency-building、unclear ROI、または low executive sponsorship。
Timing Issues
Prospect は likes your solution but timing は not work—budget cycles、other priorities、organizational changes。These は often become recycle opportunities。
Poor Fit Identified
Either you or prospect は determined した solution was not good fit を for their use case、technical requirements、または organization。Ideally caught early、ですがsometimes surfaces late。
Internal Champion Left
Person driving deal は left organization или changed roles。New stakeholder は either does not know context または has different priorities。
Product/Feature Gaps
Specific missing capabilities that blocked purchase。Document exactly what was missing so product can prioritize に基づいて deal impact。
Technical/Integration Issues
Your solution が could not integrate した required systems に、had technical limitations、または failed proof-of-concept requirements。
Competitive Displacement
For existing customers、you は lost renewal to competitor。Different dynamics than new business losses。
Vendor Relationship Issues
Trust、responsiveness、または relationship problems caused loss。Rare if you are honest、ですがcritical をidentify when it happens。
Loss Analysis Framework: Patterns を Finding
Raw loss data はjust noise。Structured analysis はturn するit into insights。
Pattern Identification by Loss Category
Start with frequency analysis。Last quarter:
- What percentage of losses は fall into each category か?
- How は compare to previous periods このか?
- Are specific loss reasons increasing or decreasing か?
If 45%の losses は「no decision」and that は up から 30%last quarter、you は have specific problem to address—urgency-building、economic buyer engagement、または適格基準。This kind of trend は should surface in your regular pipeline reviews。
Trend Analysis Over Time
Look at loss patterns across multiple quarters:
- Are competitive losses to Competitor X increasing か?
- Are price-related losses decreasing after your new pricing model launch か?
- Are product gap losses declining as features ship か?
Trend analysis はreveal whether your improvement efforts は working または if problems は growing。
Segmentation Analysis
Break down losses by:
Product/solution - Do certain offerings は have higher loss rates?Why?
Deal size - Do you lose more small deals(<$25K)or large deals(>$250K)?Different loss patterns は require different fixes を。
Industry/vertical - Are losses は concentrated in specific industries か?Might signal positioning problems または competitive strength in those markets।
Sales stage at loss - Losses atdiscovery suggest適格基準の問題。Losses at negotiation suggest competitive or pricing problems。Reviewing stage gate criteria is able can help identify where deals は advancing prematurely。
Rep/team - Are losses は distributed evenly または concentrated with specific reps か?Individual performance issues vs.systemic problems।
Geography/territory - Regional competitive dynamics または market maturity differences।
This segmentation はreveal that your「loss problem」はnot one problem—it は multiple problems requiring targeted solutions।
Competitive Positioning Analysis
For competitive losses、analyze by specific competitor:
- Win rate against Competitor A:35%
- Win rate against Competitor B:58%
- Win rate against Competitor C:22%
Then dig into why:
- What do prospects say Competitor C does better か?
- In what scenarios do you beat Competitor B か?
- What characteristics predict wins vs.losses against each competitor か?
This granular competitive intelligence है should drive differentiated positioning と適格化।
Win/Loss Comparison: What Winners Do Differently
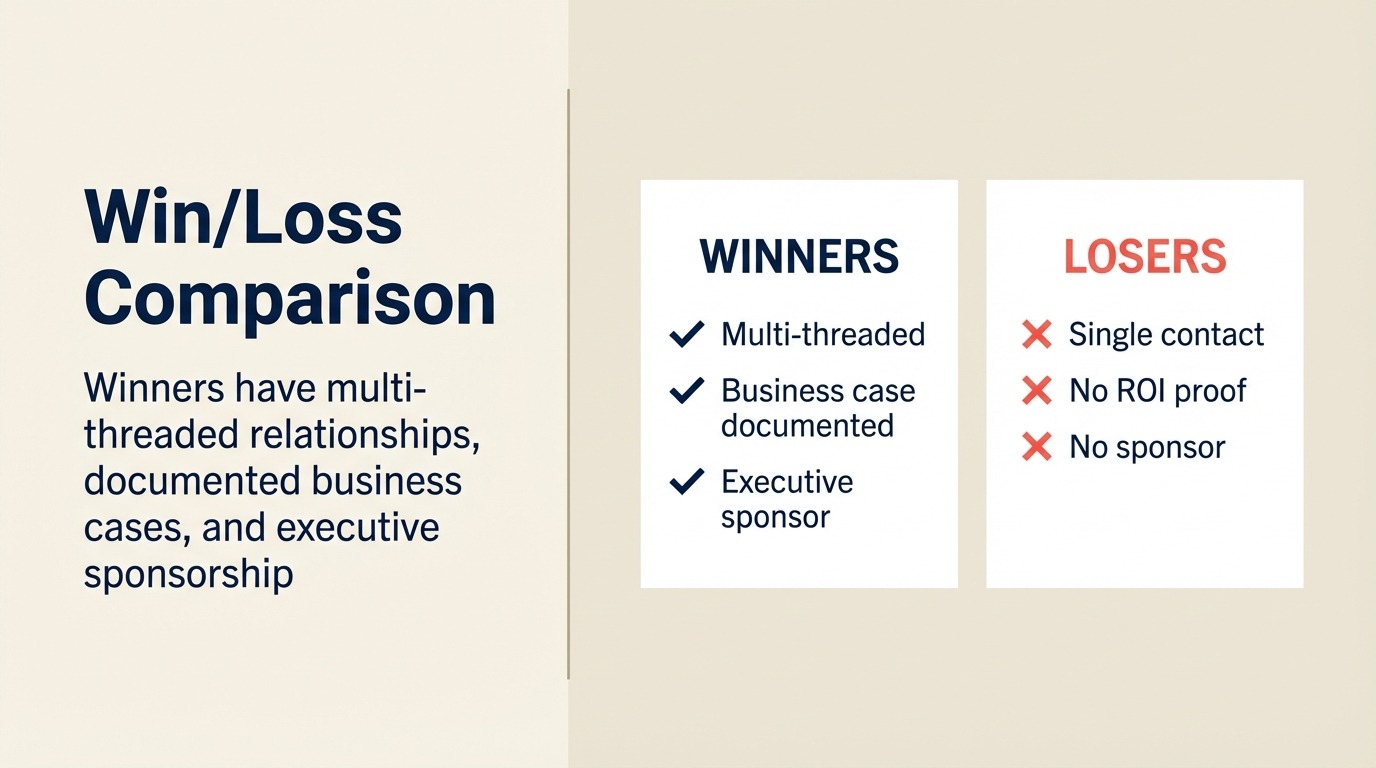
Do not just analyze losses।Compare them to wins।
For deals you won vs.deals you lost to competitors、compare:
Discovery depth - Did winning deals は have more discovery calls か?More stakeholders engaged か?Deeper needs analysis か?
Executive engagement - Did wins have C-level involvement earlier か?More frequently か?
Timeline - Do wins close faster या slower than losses क?Does elongated sales cycle correlate with loss या?
Champion strength - How do you measure champion engagement in wins vs.losses か?
Proof of value - Did wins conduct pilots、POCs、または trials か?Did losses か?
Pricing/negotiation - How much discount was typical in wins vs.losses क?
This comparative analysis हैreveal which behaviors और deal characteristics correlate with winning।Those become pipeline coaching priorities और process refinements।
Loss Prevention Strategies: Addressing Each Category
Generic「improve sales effectiveness」initiatives do not move win rates।Targeted strategies based on loss patterns do।
For「No Decision」Losses
These signal weak value articulation、unclear urgency、या low executive sponsorship।
Strategies:
- Require economic buyer engagement before advancing to later stages
- Implement business case templates that quantify ROI
- Train reps on pain-building and urgency-creation frameworks
- Create decision criteria documentation that locks in evaluation commitment
- Use MEDDIC framework to qualify pain and timeline earlier
For Competitive Losses
Different competitors require different strategies।
Strategies:
- Develop competitor-specific battle cards based on actual loss feedback
- Identify「land mines」to deploy early(topics where competitors are weak)
- Adjust qualification to focus on scenarios where you have higher win rates
- Refine differentiation messaging based on what actually resonates
- Train on competitive judo moves that reframe evaluation criteria
For Price/Budget Losses
Not all price losses are about being too expensive।Some are about demonstrating insufficient value।
Strategies:
- Improve ROI quantification and business case development
- Create flexible packaging that addresses budget constraints
- Qualify budget reality and decision process earlier
- Build champions who can advocate internally for budget approval
- Consider pricing model adjustments if losses concentrate in specific segments
For Product Gap Losses
Direct feedback loop to product、weighted by deal impact।
Strategies:
- Quantify revenue at risk from specific gaps
- Prioritize features based on deal value affected、not volume of requests
- Develop interim workarounds or partner solutions for critical gaps
- Adjust qualification to screen out deals where gaps are blockers
- Set expectations early about roadmap vs.current capabilities
For Timing Issues
These are recycle opportunities、not true losses।
Strategies:
- Create clear recycle workflow with defined follow-up schedule
- Maintain relationship through nurture content until timing aligns
- Identify triggers that signal timing may have changed
- Proper pipeline hygiene ensures recycled deals are tracked separately from true losses
Competitive Loss Analysis: Understanding the Battleground
Deep dive on competitive losses reveals strategic positioning opportunities।
Competitor-Specific Win/Loss Matrices
Create matrix for each major competitor showing:
- Win rate head-to-head
- Common loss reasons when losing to them
- Common win reasons when beating them
- Deal characteristics that predict wins vs.losses
Example:"Against Competitor X、we win 65%of deals in manufacturing vertical with $100K+ budgets when we engage VP-level early।We lose 80%of deals in retail with <$50K budgets when we arrive after they do।"
This specificity drives targeted qualification and positioning।
Message Testing
What do prospects say about competitors who beat you?Create library of:
- Competitor value propositions(in prospect words、not competitor marketing)
- Perceived competitive strengths and weaknesses
- Differentiators that actually influenced decisions
- Objections you failed to overcome
Use this to refine your messaging and train reps on what actually works।
Product Positioning Adjustments
Competitive loss analysis often reveals that your positioning is misaligned with how buyers actually evaluate.|Maybe you lead with「enterprise-grade security」but lose deals to competitors positioning on「ease of implementation।」Buyers care more about getting live quickly than security features(in certain segments)।
Loss data tells you what messaging wins in real evaluations、not what you think should win।
Organizational Learning: Closing the Feedback Loop
Loss analysis only improves win rates if insights drive organizational change।
Feedback to Product
Establish formal process for sharing loss intelligence with product leadership:
- Monthly loss summaries highlighting product gaps by deal value affected
- Quarterly competitive feature analysis based on losses
- Specific customer feedback about product shortcomings
Ensure product prioritization considers revenue impact of losses、not just feature request volume।
Feedback to Marketing
Marketing needs loss intelligence to refine:
- Competitive positioning and battle cards
- Messaging that addresses real objections
- Content that supports sales in deal stages where losses occur
- Lead qualification criteria that screen for lower-probability prospects
Quarterly loss reviews between sales and marketing keep messaging grounded in market reality।
Feedback to Sales Leadership
Sales leadership uses loss analysis to drive:
- Coaching priorities based on behaviors that differentiate wins from losses
- Process improvements targeting stages where losses concentrate
- Qualification criteria adjustments to focus on higher-probability deals
- Territory and rep specialization based on competitive dynamics
Feedback to Individual Reps
Reps should see their individual loss patterns:
- How their loss categories compare to team averages
- Which competitors they lose to most frequently
- Behaviors that correlate with their wins vs.losses
This creates accountability and focuses coaching on specific improvement areas।
Continuous Improvement: Making Loss Analysis Operational
One-time loss analysis does not change outcomes।Systematic、ongoing analysis does।
Regular Review Cadence
Establish rhythms:
- Weekly: Pipeline reviews flag at-risk deals showing loss warning signs
- Monthly: Loss summary by category、trending、and early warning flags
- Quarterly: Deep competitive analysis and process improvement planning
- Annually: Strategic review of win rate trends and multi-year patterns
Deal Inspection Integration
Integrate loss pattern insights into deal inspection process।Use historical loss patterns to identify warning signs in active deals:
- Deals matching characteristics of previous losses get extra scrutiny
- Competitive situations apply learned battle strategies
- Missing elements that correlated with wins trigger coaching interventions
Win Rate Monitoring
Track win rates across multiple dimensions:
- Overall blended win rate
- Win rate by product/solution
- Win rate by segment(industry、deal size、region)
- Win rate by competitor
- Win rate by rep/team
Monitor these over time with clear targets।Win rate improvement should be standing objective tied to loss analysis insights।
Strategy Adjustment Cycles
Quarterly、ask:
- What did we learn from losses this quarter?
- What changes should we make based on those learnings?
- What changes from last quarter improved outcomes?
- What loss patterns persist despite intervention attempts?
Document changes and measure impact।Close loop between analysis and action।
Pipeline Sanitation
Loss analysis informs pipeline sanitation by revealing deal patterns that rarely close:
- Opportunities matching characteristics of common losses should be disqualified earlier
- Qualification criteria should adapt based on what predicts wins vs.losses
- Sales capacity gets redirected from low-probability to high-probability deals
Measurement Framework: Tracking Improvement
Define metrics that prove loss analysis drives results:
Win Rate Trend - Is overall win rate improving quarter-over-quarter?
Loss Category Distribution - Are high-impact loss categories(like「no decision」)decreasing?
Competitive Win Rates - Are you improving against specific competitors?
Time-to-Loss - Are you identifying and disqualifying bad-fit deals faster?
Loss Analysis Completion Rate - Are reps actually completing required loss fields?
Action Item Completion - Are insights from loss analysis generating completed improvement actions?
Revenue Impact - Can you quantify revenue recaptured from loss pattern fixes?
These metrics create accountability around turning loss analysis into business results।For complete view of performance indicators、see pipeline metrics overview।
結論: Losses as Strategic Assets
Elite sales organizations treat lost deals as strategic assets、not embarrassing failures।
They systematically capture loss data、analyze patterns、extract competitive intelligence、drive product prioritization、refine messaging、adjust processes、and coach reps based on what actually happens in competitive evaluations।
They do not lose same deal twice for same reason।
Most organizations treat losses as things to forget।They might ask「why did we lose?」in moment、then move on।No documentation।No pattern analysis।No organizational learning।
Difference in win rates is predictable:15~25%improvement over 12 months for organizations that implement systematic loss analysis、compared to flat or declining win rates for those that do not।
Question is not whether loss analysis is valuable।Data is overwhelming।Question is whether you will build discipline to do it systematically।
Because understanding why you lose is fastest path to winning more।
Ready to improve win rates through systematic analysis? Explore how conversion rate analysis and deal inspection process work together with loss analysis to drive predictable improvement।
Learn more:

Senior Operations & Growth Strategist
On this page
- 勝者が Losses に執着する理由
- Loss Analysis の価値
- Win Rate 改善
- Competitive Intelligence
- Process Refinement
- Product Feedback
- 適格基準の調整
- Loss Data Capture: 基礎を構築する
- Required Fields
- Rep Input Requirements
- Customer Exit Interviews
- Timeline Documentation
- Primary Loss Reasons: Taxonomy
- Lost to Specific Competitor
- Price/Budget Constraints
- No Decision Made
- Timing Issues
- Poor Fit Identified
- Internal Champion Left
- Product/Feature Gaps
- Technical/Integration Issues
- Competitive Displacement
- Vendor Relationship Issues
- Loss Analysis Framework: Patterns を Finding
- Pattern Identification by Loss Category
- Trend Analysis Over Time
- Segmentation Analysis
- Competitive Positioning Analysis
- Win/Loss Comparison: What Winners Do Differently
- Loss Prevention Strategies: Addressing Each Category
- For「No Decision」Losses
- For Competitive Losses
- For Price/Budget Losses
- For Product Gap Losses
- For Timing Issues
- Competitive Loss Analysis: Understanding the Battleground
- Competitor-Specific Win/Loss Matrices
- Message Testing
- Product Positioning Adjustments
- Organizational Learning: Closing the Feedback Loop
- Feedback to Product
- Feedback to Marketing
- Feedback to Sales Leadership
- Feedback to Individual Reps
- Continuous Improvement: Making Loss Analysis Operational
- Regular Review Cadence
- Deal Inspection Integration
- Win Rate Monitoring
- Strategy Adjustment Cycles
- Pipeline Sanitation
- Measurement Framework: Tracking Improvement
- 結論: Losses as Strategic Assets