Awesome KPIs
Turn this article into takeaways for your work.
Each assistant summarizes the article only for you and suggests best practices for your work.
A curated list of the best resources about Key Performance Indicators (KPIs) for business leaders, directors, and managers.
Inspired by awesome lists. Maintained by Rework.
Most companies track too many metrics and act on too few. The right KPIs tell you whether the business is healthy, where growth is stalling, and what decisions to make next. The resources below will help you pick the right indicators, build dashboards people actually use, and move from data collection to data-driven action.
Contents
- Articles
- Books
- Videos & Talks
- Tools & Software
- Templates & Frameworks
- Case Studies & Real-World Examples
- Communities & Newsletters
- Rework Resources
Articles
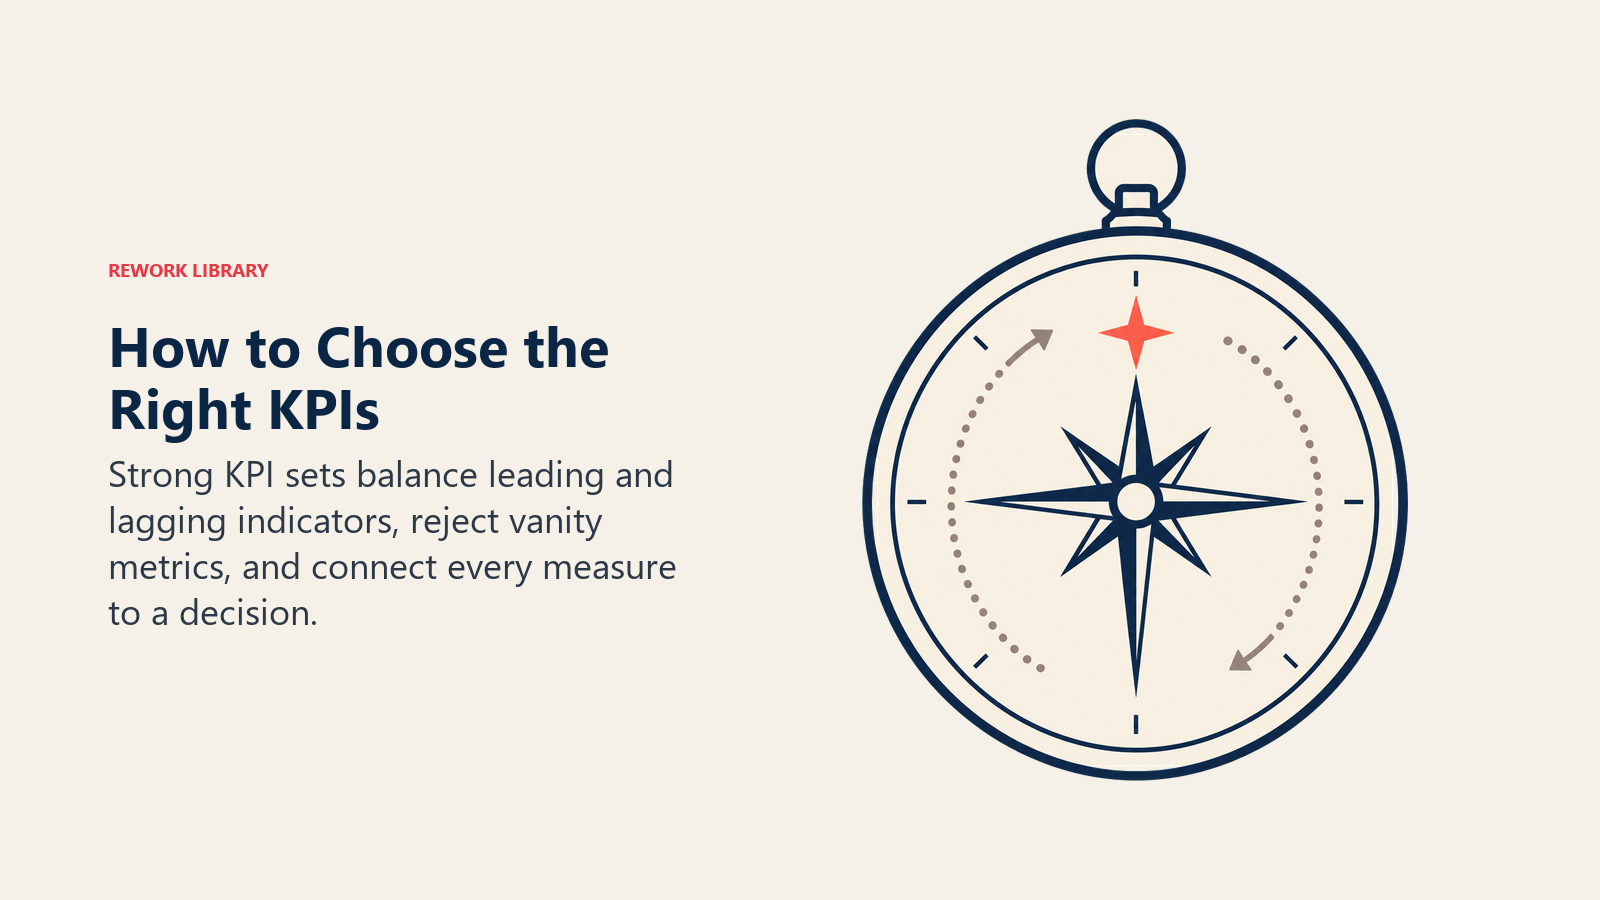
The most useful KPI guidance balances leading and lagging indicators, filters out vanity metrics, and ties every measure to a real decision.
- Key Performance Indicators & Metrics by Bernard Marr - A comprehensive hub covering KPI selection, measurement, and benchmarking.
- The Ultimate KPI Guide by Klipfolio - Plain-language explanation of KPIs with industry examples and dashboard tips.
- How to Choose the Right KPIs by Harvard Business Review - Framework for selecting KPIs that align with strategy, not just activity.
- Leading vs. Lagging Indicators by Bernard Marr - Explains the critical difference between predictive and retrospective metrics.
- Vanity Metrics vs. Actionable Metrics by Klipfolio - Helps teams stop tracking numbers that look good but drive no decisions.
- KPI Benchmarks by Industry by Databox - Aggregated benchmark data across sales, marketing, and ops KPIs by sector.
- How to Build a KPI Dashboard by Geckoboard - Step-by-step guide to building dashboards leaders actually check daily.
- The North Star Metric Explained by Reforge - How to find the single metric that best captures your product's core value.
- Finance KPIs Every CFO Should Track by McKinsey - Key financial indicators and how CFOs and CEOs should align on them.
- Sales KPIs That Actually Predict Revenue by HubSpot - A practical list of leading sales indicators tied to pipeline and close rates.
- Marketing KPIs Beyond Vanity by Content Marketing Institute - Measuring marketing impact with metrics that connect to revenue.
- OKRs vs KPIs: Using Both Together by Perdoo - The clearest explanation of how OKRs and KPIs complement each other.
- Lead Scoring Systems by Rework - How to build a scoring model that prioritizes your highest-value leads, a practical example of leading indicators in action.
Books
- Key Performance Indicators by David Parmenter - The most complete guide to developing, implementing, and using winning KPIs; now in its fourth edition.
- Key Performance Indicators For Dummies by Bernard Marr - Practical coverage of 100+ KPIs across financial, operational, sales, and customer metrics.
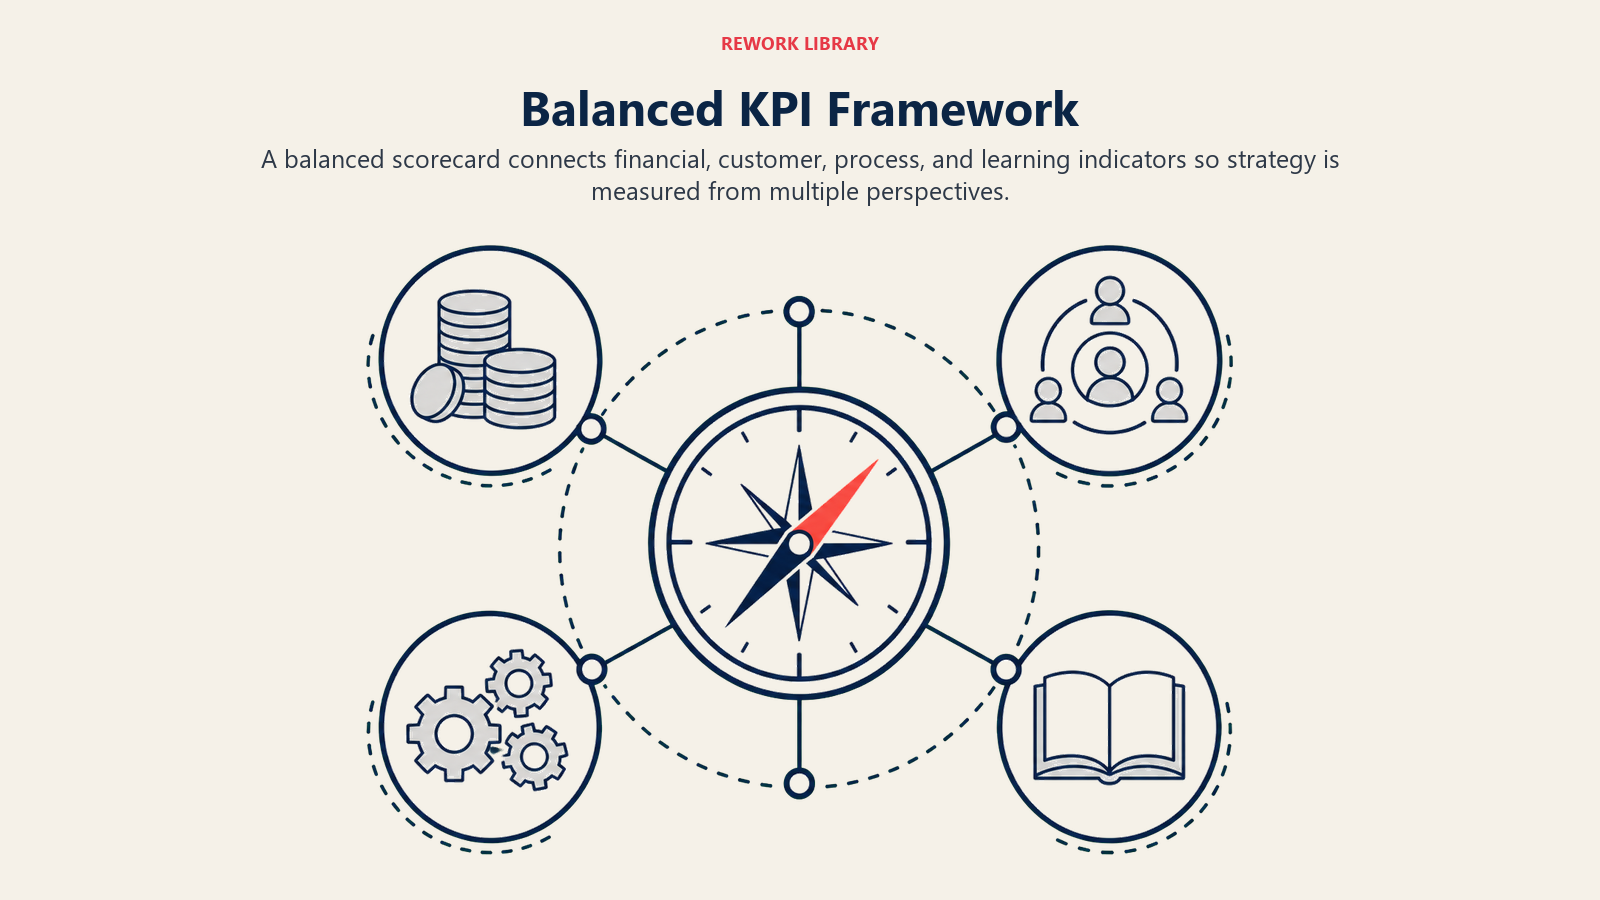
- The Balanced Scorecard by Robert Kaplan & David Norton - The foundational framework for connecting KPIs to strategy across four business perspectives. (classic)
- 25 Need-to-Know Key Performance Indicators by Bernard Marr - A focused guide to the 25 most important metrics for modern businesses.
- Measure What Matters by John Doerr - Covers OKRs but the underlying logic of measurable outcomes applies directly to KPI thinking.
Videos & Talks
- How to Create KPIs That Actually Work by Bernard Marr - A concise walkthrough of KPI selection and measurement methodology.
- The Balanced Scorecard Explained - A visual breakdown of Kaplan & Norton's four-perspective framework for business measurement.
- Finding Your North Star Metric by Reforge - How to identify the one metric that captures your company's core growth engine.
- KPI Dashboard Design Principles by Geckoboard - Practical principles for building dashboards people use to make decisions.
- Data-Driven Leadership (TED-style talk) - How executives use data to make faster, better decisions at scale.
Tools & Software
- Tableau - Industry-leading data visualization platform for building interactive KPI dashboards.
- Microsoft Power BI - Enterprise BI tool that connects to hundreds of data sources for real-time reporting.
- Klipfolio - Cloud-based dashboard tool that connects 130+ data sources for real-time KPI monitoring.
- Databox - Pulls data from 100+ sources into one clean dashboard, ideal for marketing and sales teams.
- Geckoboard - TV-first KPI dashboard designed for shared office displays and remote team visibility.
- Google Looker Studio - Free data visualization tool with native Google integrations and 800+ connectors.
- Domo - Enterprise business intelligence platform with strong data governance and sharing features.
- SimpleKPI - Lightweight KPI tracking tool designed for small teams without a data analyst.
Templates & Frameworks
These frameworks help leaders connect financial, customer, process, and learning measures to the strategy they are meant to guide.
- KPI Template Library by Klipfolio - Hundreds of pre-built KPI definitions organized by department and industry.
- Balanced Scorecard Templates by Cascade - Ready-to-use balanced scorecard frameworks for financial, customer, process, and learning KPIs.
- David Parmenter's KPI Worksheets by David Parmenter - Free worksheets, checklists, and a library of 500+ performance measures.
- Marketing KPI Dashboard Template by Databox - Pre-built templates for tracking marketing performance across channels.
Case Studies & Real-World Examples
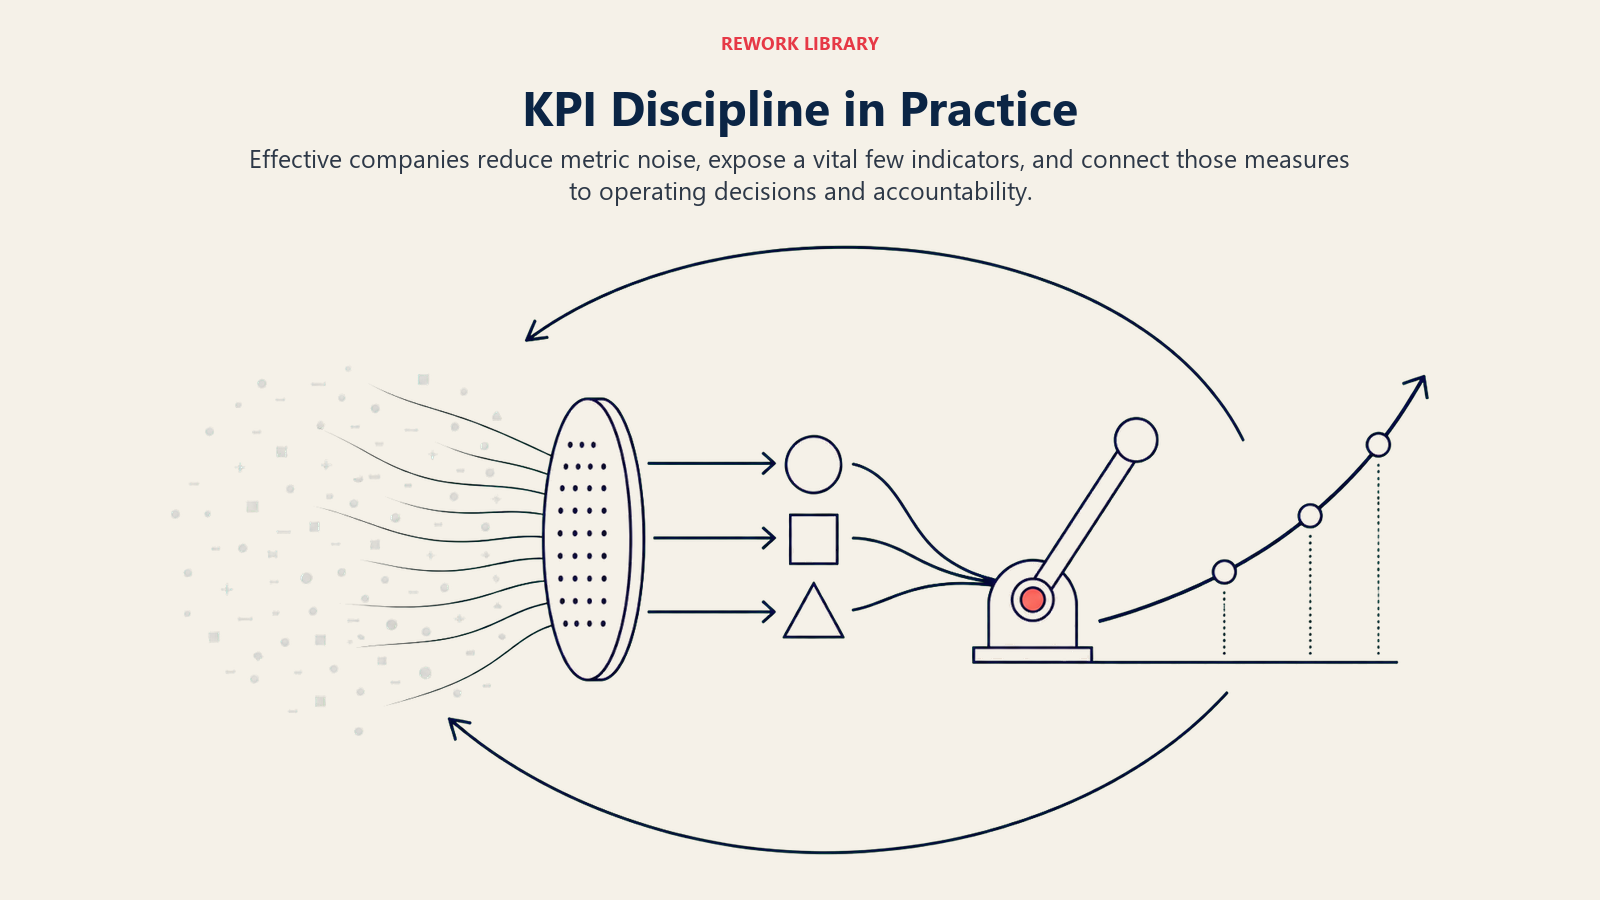
The companies below reduced metric noise, exposed a vital few indicators, and connected those measures to operating decisions and accountability.
- Amazon - Amazon's leadership team famously tracks six-page narrative memos rather than PowerPoint slides, but their underlying KPI discipline is exceptional. Jeff Bezos built the company's retail operation around a small set of obsessively tracked metrics: in-stock rate, customer experience scores, and delivery speed. Their "Flywheel" model, where each KPI feeds the next, is one of the most-studied examples of metric-driven compounding growth in business history. Source
- General Electric (Jack Welch era) - Welch reduced GE's reporting to a handful of "vital few" KPIs, famously insisting every business unit be #1 or #2 in its market or face divestiture. This KPI discipline helped GE grow its market cap from $12 billion in 1981 to $410 billion by 2001. The Welch era remains a textbook case of how ruthless KPI focus at the executive level drives organizational clarity and performance. Source
- Klarna - The Swedish fintech built its growth model around a single customer KPI: "Smoooth" checkout conversion rate. By obsessively tracking and improving this one number across merchant integrations, Klarna grew to 150 million users across 45 countries. Their internal dashboards are reportedly visible across every office, making KPI accountability a cultural norm rather than a quarterly reporting exercise. Source
- Walmart - Walmart's supply chain dominance is built on real-time KPI visibility. Their Retail Link system, deployed in the 1990s, gave suppliers direct access to store-level sales data, a radical move that reduced out-of-stock rates and inventory waste simultaneously. This KPI-sharing approach with the supply chain was a decade ahead of industry practice and is credited with Walmart's ability to undercut competitors on both price and availability. Source
- Monzo - The UK challenger bank made its core KPIs transparent to all employees from day one, publishing a weekly internal "Data Transparency" report covering new accounts, active users, and customer satisfaction. This open-metrics culture accelerated product decision-making and helped Monzo reach 9 million customers within six years without a traditional retail banking branch network. Source
- Airbnb - During the COVID-19 crisis, Airbnb stripped its KPI dashboard from hundreds of metrics down to three: nights booked, gross booking value, and host supply. That radical simplification, imposed by crisis, helped the leadership team make faster decisions and ultimately allowed Airbnb to execute one of the most successful IPOs of 2020 despite a brutal year for travel. Source
Communities & Newsletters
- Bernard Marr's Newsletter - Weekly insights on performance measurement, data strategy, and business intelligence.
- Data + AI Summit Community - Annual conference and community for data leaders building analytics and measurement systems.
- RevOps Co-op - Community for revenue operations leaders who live and breathe performance metrics.
Rework Resources
Explore more performance measurement content on the Rework blog:
- Conversion Rate Analysis - Tracking and improving the metrics that predict pipeline health and revenue.
Contributing
Know a great KPI resource that should be on this list? Let us know.

Senior Operations & Growth Strategist