GE-McKinsey Matrix: Cara Mengutamakan Unit Perniagaan
Turn this article into takeaways for your work.
Each assistant summarizes the article only for you and suggests best practices for your work.
Apabila anda menjalankan perniagaan berbilang unit, setiap ringgit yang dilaburkan dalam satu bahagian adalah ringgit yang tidak dilaburkan dalam bahagian lain. GE-McKinsey matrix memberikan eksekutif cara berstruktur untuk membuat pertukaran tersebut tanpa bergantung kepada gerak hati semata-mata.
Apakah GE-McKinsey Matrix?
GE-McKinsey Matrix ialah rangka kerja portfolio 9-sel yang membantu syarikat menilai dan mengutamakan unit perniagaan strategik (SBU) mereka dengan memetakan dua dimensi: daya tarikan industri dan kekuatan persaingan. Setiap unit mendarat di salah satu daripada tiga zon, Labur, Selektif, atau Tuai, yang mendorong keputusan pelaburan.
Fakta Utama
- GE-McKinsey Matrix dibangunkan pada tahun 1970-an oleh McKinsey & Company untuk General Electric bagi membantu GE mengutamakan lebih kurang 150 unit perniagaan strategiknya (McKinsey Quarterly, 2008).
- Kira-kira 47% syarikat Fortune 500 menggunakan rangka kerja portfolio 9-kotak seperti GE-McKinsey atau BCG untuk membimbing keputusan pelaburan merentasi unit perniagaan (Strategic Management Society, 2024).
- GE menggunakan matriks ini untuk melupuskan lebih daripada 100 unit perniagaan antara 1981 dan 2001 di bawah mandat "Jadi #1 atau #2" Jack Welch, satu aplikasi langsung logik zon tuai/lupus (Harvard Business Review, 2014).
GE menugaskan McKinsey pada awal 1970-an untuk menyelesaikan masalah yang diketahui setiap konglomerat yang pelbagai: bagaimana anda memperuntukkan modal secara rasional merentasi 150 unit perniagaan yang merangkumi enjin jet, peralatan, perkhidmatan kewangan, dan penyiaran? BCG Matrix sudah wujud, tetapi pemimpin GE mendapati kesederhanaan 2x2-nya terlalu kasar untuk keputusan portfolio yang kompleks. Penyelesaian McKinsey ialah grid 3x3 dengan pemarkahan berwajaran, memberikan ahli strategi sembilan zon berbanding empat dan cara sistematik untuk mengkuantifikasi faktor yang dibiarkan oleh BCG kepada tekaan.
Hasilnya menjadi salah satu alat portfolio yang paling meluas diajar di sekolah perniagaan dan salah satu rangka kerja yang paling banyak digunakan secara praktikal oleh pasukan strategi korporat.
Dua Paksi: Daya Tarikan Industri dan Kekuatan Persaingan
Kedudukan setiap unit perniagaan pada matriks berasal daripada dua skor komposit. Mendapatkan ini dengan betul adalah di mana sebahagian besar kerja analitik berlaku.
Daya tarikan industri mengukur betapa menariknya pasaran itu sendiri, bebas daripada siapa yang bersaing di dalamnya. Industri yang sangat menarik berkembang dengan pantas, mempunyai margin keuntungan yang kukuh, menghadapi regulasi yang terhad, dan tidak didominasi oleh beberapa gergasi penetapan harga. Industri yang kurang menarik mungkin sedang mengecut, menjadi komoditi, atau secara struktur tidak menguntungkan. Paksi ini sebahagiannya tentang peluang luaran dan sebahagiannya tentang sama ada ekonomi struktur pasaran memberi ganjaran kepada peserta.
Kekuatan persaingan mengukur betapa baik unit perniagaan tertentu diletakkan untuk menang dalam industrinya. Kedudukan persaingan yang kukuh bermakna unit itu mempunyai bahagian pasaran yang unggul, jenama yang diiktiraf, struktur kos yang lebih rendah daripada pesaing, teknologi proprietari, atau kelebihan pengedaran yang sukar ditiru. Kedudukan persaingan yang lemah bermakna unit itu berjuang mendaki bukit: ia adalah pengikut, bukan pemimpin, dan pesaing boleh mengungguli atau mengatasi prestasinya pada kebanyakan dimensi.
Kedua-dua paksi diberi skor pada skala, biasanya 1 hingga 5 atau 1 hingga 10, menggunakan satu set faktor berwajaran. Langkah penimbangan adalah kritikal: faktor seperti saiz pasaran penting, tetapi ia mungkin kurang penting berbanding kadar pertumbuhan pasaran apabila anda membuat keputusan pelaburan yang berpandangan ke hadapan.
9 Sel dan 3 Zon Pelaburan
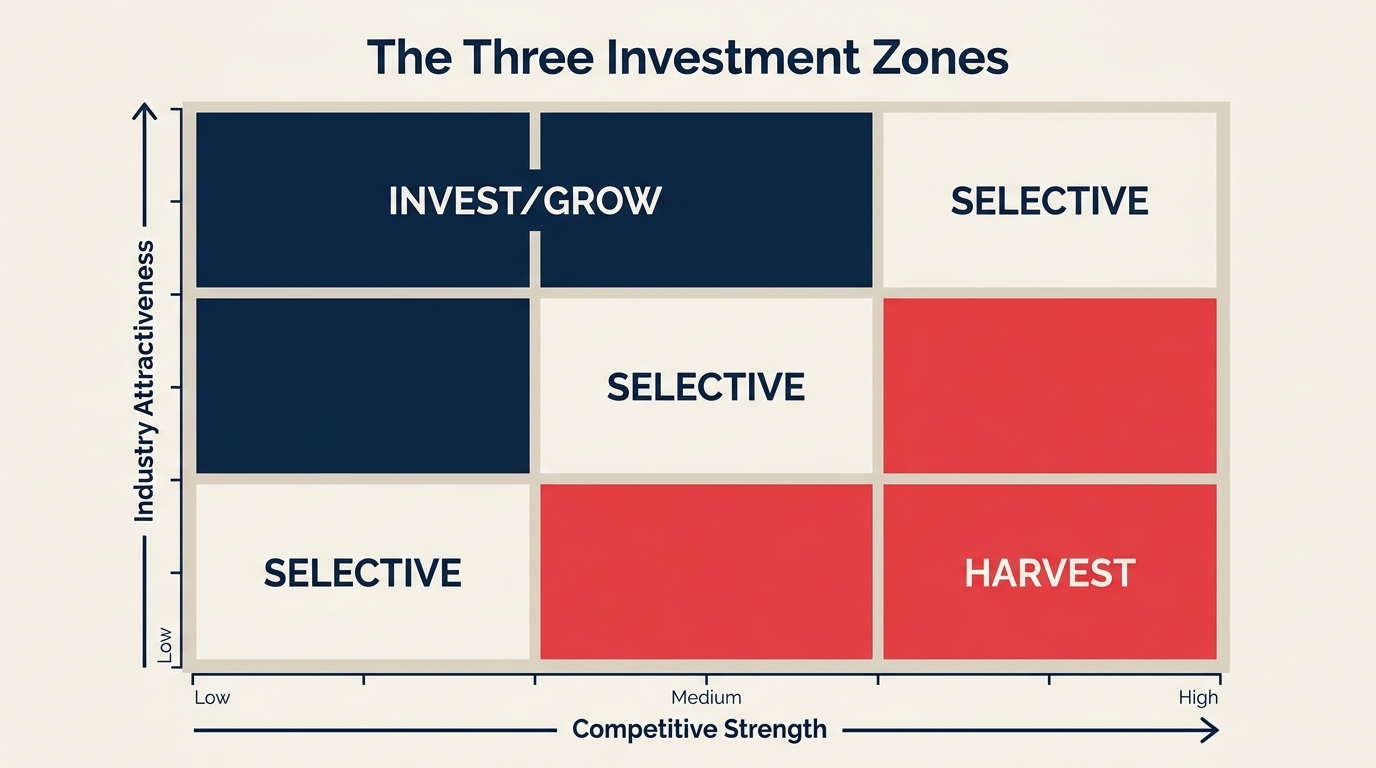
Grid 3x3 mewujudkan sembilan sel, tetapi secara strategik ia runtuh kepada tiga zon. Fikirkan matriks sebagai garis pepenjuru yang membahagi dari kiri atas ke kanan bawah. Segala-galanya di atas dan ke kiri garis pepenjuru tersebut adalah di mana anda ingin melabur. Segala-galanya pada pepenjuru memerlukan selektiviti yang teliti. Segala-galanya di bawah dan ke kanan perlu dituai atau dilupuskan.
Labur/Kembang (3 Sel Kiri Atas)
Unit perniagaan dalam zon pelaburan berada dalam industri yang menarik di mana syarikat sudah mempunyai kedudukan persaingan yang kukuh. Ini adalah unit terbaik anda: pasaran ingin berkembang dan anda berkedudukan baik untuk menangkap pertumbuhan tersebut. Modal, perhatian pengurusan, dan bakat patut mengalir ke sini. Penerapan logik ini oleh Jack Welch di GE hampir bermaksud secara literal: jika sesebuah unit bukan yang pertama atau kedua dalam pasarannya, ia diperbaiki, dijual, atau ditutup.
Jangan salah anggap "labur" sebagai "tiada penelitian." Unit yang berprestasi terbaik masih memerlukan pelan pertumbuhan yang jelas, metrik akauntabiliti, dan sasaran ROI. Modal tidak terhad ke dalam unit yang kukuh tanpa hala tuju pertumbuhan hanyalah pembaziran pada alamat yang lebih baik.
Selektif (3 Sel Pepenjuru)
Tiga sel pepenjuru mewakili kekaburan yang tulen. Sesebuah unit mungkin beroperasi dalam pasaran yang menarik tetapi memegang kedudukan persaingan yang lemah. Atau ia mungkin merupakan pemimpin pasaran dalam industri yang tidak lagi berkembang. Tidak satu pun secara automatik bernilai untuk digandakan atau ditinggalkan.
Keputusan strategik di sini memerlukan penyiasatan yang lebih mendalam. Bolehkah anda meningkatkan kedudukan persaingan unit itu melalui pelaburan dalam keupayaan, jenama, atau pengedaran? Adakah ramalan pasaran tepat atau terlalu pesimistik? Adakah terdapat sinergi strategik dengan unit lain yang tidak ditangkap oleh skor berdiri sendiri? Unit selektif memerlukan hipotesis: sama ada anda mempunyai pelan yang boleh dipercayai untuk menggerakkan unit ini ke dalam zon pelaburan, atau anda menerima bahawa ia akhirnya akan meluncur ke arah tuaian.
Tuai/Lupus (3 Sel Kanan Bawah)
Unit dalam zon tuaian berada dalam industri yang tidak menarik di mana kedudukan persaingan syarikat juga lemah. Ini adalah perbualan yang paling sukar kerana ia sering melibatkan produk warisan, pasukan yang lama berkhidmat dengan kesetiaan, atau perniagaan yang menguntungkan dalam beberapa dekad lalu tetapi sejak itu menjadi komoditi.
Logik strategiknya jelas: hentikan peruntukan modal pertumbuhan di sini. Jika unit itu menjana tunai, tua ia (jalankan dengan cekap, ekstrak margin, jangan laburkan semula untuk pengembangan). Jika ia menguras tunai, pertimbangkan untuk melupuskan sebelum ia memusnahkan nilai selanjutnya. Ini bukan kekalahan; ia adalah disiplin modal. Setiap ringgit yang dibebaskan daripada unit tuaian boleh membiayai pelan pertumbuhan unit pelaburan.
Cara Memberi Skor Daya Tarikan Industri dan Kekuatan Persaingan
Kekuatan GE-McKinsey Matrix berbanding alat yang lebih mudah seperti BCG Matrix adalah bahawa anda memberi skor setiap paksi menggunakan pelbagai faktor berwajaran, bukan satu metrik proksi tunggal. Berikut cara setiap paksi biasanya dibina.
Faktor Daya Tarikan Industri
| Faktor | Wajaran (contoh) | Apa yang perlu dinilai |
|---|---|---|
| Saiz pasaran | 15% | Jumlah hasil boleh ditangani dalam sektor tersebut |
| Kadar pertumbuhan pasaran | 20% | CAGR dalam tempoh 3-5 tahun akan datang |
| Keuntungan industri | 20% | Purata margin EBITDA merentasi pesaing |
| Intensiti persaingan | 15% | Bilangan pesaing, tekanan harga, churn |
| Keperluan teknologi | 10% | Kadar perubahan, beban capex |
| Faktor alam sekitar dan kawal selia | 10% | Kos pematuhan, risiko gangguan |
| Kekitaran | 10% | Turun naik hasil merentasi kitaran perniagaan |
Faktor Kekuatan Persaingan
| Faktor | Wajaran (contoh) | Apa yang perlu dinilai |
|---|---|---|
| Bahagian pasaran | 20% | Bahagian unit berbanding pesaing terbesar |
| Kekuatan jenama | 15% | Kesedaran, keutamaan, skor NPS |
| Kedudukan pengeluaran/kos | 15% | Kos unit berbanding purata industri |
| Margin keuntungan | 15% | EBITDA unit berbanding purata industri |
| Keupayaan teknologi dan inovasi | 15% | Output R&D, kedudukan paten, hala tuju produk |
| Pengedaran dan akses | 10% | Liputan saluran, penguncian pelanggan |
| Kualiti pengurusan dan bakat | 10% | Kedalaman kepimpinan, pengekalan, penggantian |
Wajaran perlu berjumlah 100% setiap paksi dan perlu dipersetujui oleh pasukan kepimpinan sebelum pemberian skor bermula. Menukar wajaran selepas melihat skor memperkenalkan kecenderungan.
Cara Membina GE-McKinsey Matrix: Langkah demi Langkah
Langkah 1: Kenal Pasti Unit Perniagaan Anda
Takrifkan unit yang anda nilai. Unit-unit ini perlu benar-benar berbeza: segmen pelanggan yang berasingan, aliran hasil, struktur kos, dan persekitaran persaingan. Menggabungkan produk yang berbeza ke dalam satu "unit" mengaburkan analisis. Fikirkan setiap unit sebagai entiti strategik berasingan yang secara teorinya boleh dinilai sebagai perniagaan berdiri sendiri.
Langkah 2: Takrifkan Faktor Pemberian Skor
Pilih 6-8 faktor untuk setiap paksi. Gunakan jadual di atas sebagai titik permulaan, tetapi sesuaikan untuk industri anda. Syarikat farmaseutikal mungkin memberi wajaran lebih tinggi kepada faktor kawal selia; jenama pengguna mungkin memberi wajaran lebih berat kepada jangkauan pengedaran. Jalankan senarai faktor anda bersama beberapa pemimpin sebelum memuktamadkan, kerana pemilihan itu sendiri menampakkan andaian strategik yang bernilai untuk diperdebatkan.
Langkah 3: Wajaran Faktor
Berikan wajaran kepada setiap faktor pada kedua-dua paksi. Wajaran perlu mencerminkan apa yang benar-benar mendorong kejayaan dalam pasaran anda, bukan apa yang paling mudah diukur. Jumlah wajaran setiap paksi mesti berjumlah 100%. Lakukan langkah ini sebelum memberi skor kepada mana-mana unit tertentu; jika tidak, anda berisiko merekayasa semula wajaran untuk mewajarkan jawapan yang lebih disukai.
Langkah 4: Beri Skor kepada Setiap Unit Perniagaan
Beri skor kepada setiap unit pada setiap faktor menggunakan skala yang konsisten (1 = sangat lemah, 5 = sangat kukuh untuk kekuatan persaingan; 1 = sangat tidak menarik, 5 = sangat menarik untuk daya tarikan industri). Kemudian darabkan setiap skor dengan wajarannya dan jumlahkan skor berwajaran untuk mendapatkan skor komposit setiap paksi. Libatkan orang yang mempunyai pengetahuan langsung tentang unit dan pasarannya: kepimpinan kewangan, produk, dan jualan biasanya.
Langkah 5: Plot Matriks
Petakan setiap unit pada grid 3x3 menggunakan skor kompositnya. Jika anda menggunakan skala 5 mata, skor 1-2 adalah rendah, 2-3 adalah sederhana, dan 3-5 adalah tinggi. Gunakan saiz bulatan untuk mewakili hasil atau aset, yang menambah dimensi ketiga menunjukkan berapa banyak yang dipertaruhkan dalam setiap sel. Di sinilah perbualan bermula, bukan berakhir.
Langkah 6: Tetapkan Strategi per Zon
Setelah unit diplot, berikan salah satu daripada tiga postur strategik: labur untuk pertumbuhan, perhatian selektif dengan hipotesis penambahbaikan tertentu, atau tuai dan laburkan semula. Dokumentasikan rasional untuk setiap satu, termasuk metrik yang akan mengubah kesimpulan. Matriks sepatutnya mendorong keputusan peruntukan sumber, perbualan belanjawan, dan kadens ulasan portfolio.
Contoh GE-McKinsey Matrix
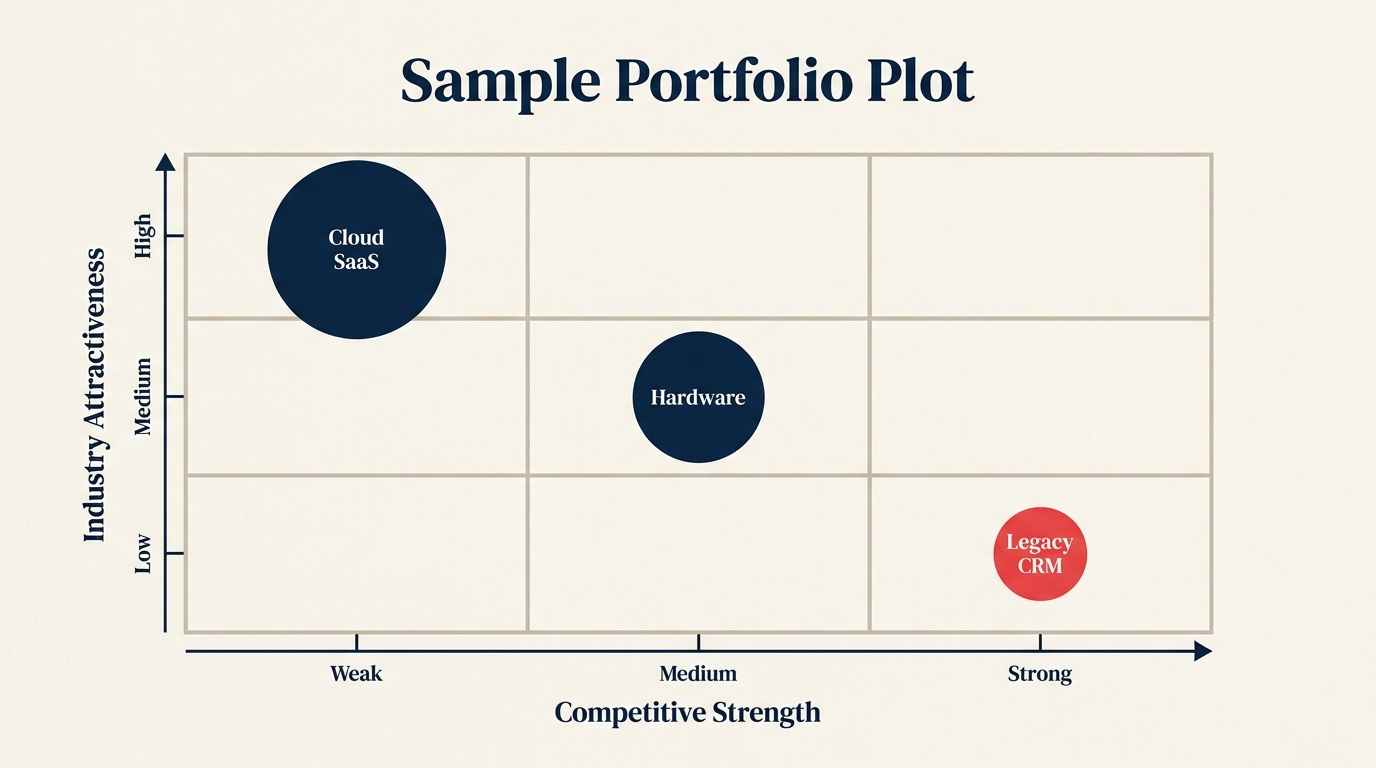
Berikut cara syarikat teknologi yang pelbagai mungkin menggunakan matriks merentasi empat unitnya.
| Syarikat | Unit Perniagaan | Kedudukan Matriks | Tindakan Disyorkan |
|---|---|---|---|
| DiversiTech Corp | Platform Cloud SaaS | Daya tarikan tinggi / Kekuatan tinggi (Labur) | Percepatkan kakitangan, tingkatkan belanjawan R&D, kembang ke peringkat antarabangsa |
| DiversiTech Corp | Peranti Perkakasan B2B | Daya tarikan sederhana / Kekuatan sederhana (Selektif) | Kekalkan margin, nilai pembezaan; tiada capex pertumbuhan utama |
| DiversiTech Corp | Perkhidmatan IT Terurus | Daya tarikan tinggi / Kekuatan rendah (Selektif) | Bina keupayaan dengan cepat atau peroleh; tetapkan pencapaian 18 bulan untuk mencapai kekuatan Sederhana |
| DiversiTech Corp | CRM On-Prem Warisan | Daya tarikan rendah / Kekuatan rendah (Tuai) | Tuai asas kontrak sedia ada, hadkan asas kos, nilai pelupusan menjelang 2027 |
Platform Cloud SaaS mendapat sebahagian besar pelaburan pertumbuhan tahun hadapan. CRM Warisan mendapat belanjawan penyelenggaraan dan jangka masa. Perhatian pengurusan mengikut logik yang sama: pemimpin terkuat ditugaskan kepada unit Labur, bukan tersebar secara sama rata.
Di sinilah balanced scorecard juga menjadi teman yang berguna: setelah keputusan pelaburan dibuat, scorecard menterjemahkannya kepada KPI dan sasaran operasi tertentu untuk setiap unit.
GE-McKinsey vs BCG Matrix
Kedua-dua rangka kerja menilai portfolio perniagaan, tetapi berbeza dalam cara yang bermakna. Mengetahui masa untuk menggunakan yang mana menjimatkan banyak analisis yang tidak perlu.
| Dimensi | GE-McKinsey Matrix | BCG Matrix |
|---|---|---|
| Saiz grid | 3x3 (9 sel) | 2x2 (4 sel) |
| Paksi | Daya tarikan industri + Kekuatan persaingan (kedua-duanya berbilang faktor) | Kadar pertumbuhan pasaran + Bahagian pasaran relatif (metrik tunggal) |
| Tahap nuansa | Tinggi: pemberian skor berwajaran, pelbagai faktor setiap paksi | Rendah: dua titik data, tiada penimbangan |
| Kerumitan | Lebih tinggi: memerlukan pengumpulan data dan penyelarasan pasukan pada wajaran | Lebih rendah: cepat dibina dengan data awam |
| Output strategik | Labur / Selektif / Tuai | Stars / Cash Cows / Question Marks / Dogs |
| Terbaik untuk | Portfolio pelbagai yang besar, persekitaran berbilang faktor yang kompleks | Imbasan portfolio pantas, analisis peringkat awal, penggunaan akademik |
| Kelemahan | Pemberian skor subjektif, mengambil masa | Terlalu memudahkan kedudukan persaingan, mengabaikan keuntungan |
Bagi kebanyakan perusahaan besar dengan kerumitan portfolio yang tulen, rangka kerja GE-McKinsey menghasilkan output yang lebih boleh diambil tindakan. BCG Matrix berfungsi dengan baik sebagai diagnostik pantas atau apabila data terhad.
Keterbatasan dan Kritikan
Tiada rangka kerja bertahan dengan sempurna apabila bertemu realiti. GE-McKinsey Matrix mempunyai keterbatasan nyata yang perlu diketahui sebelum anda menggunakannya.
- Pemberian skor subjektif. Faktor berwajaran hanya sebagus orang yang memberi skor kepadanya. Pasukan cenderung menaikkan skor untuk unit yang mereka urus atau sukai. Bina semakan pasukan merah atau penanda aras luaran untuk menghadapinya.
- Gambar seketika dalam masa. Matriks mencerminkan keadaan semasa dan jangka pendek. Ia tidak memodelkan perubahan mendadak dengan baik. Unit dalam zon pelaburan hari ini boleh bergerak ke tuaian jika pendatang baharu menulis semula landskap persaingan. Semak semula sekurang-kurangnya setiap tahun.
- Mengabaikan sinergi. Dua unit mungkin masing-masing memberi skor dalam zon tuaian secara bebas tetapi bersama-sama mewujudkan keupayaan yang tidak dimiliki mana-mana satu. Kebergantungan rentas unit memerlukan lapisan kualitatif yang tidak ditangkap oleh matriks dengan sendirinya.
- Lapar data. Membina matriks yang jujur dan ketat memerlukan risikan persaingan, data saiz pasaran, dan kewangan dalaman yang tidak selalu tersedia atau boleh dipercayai, terutama bagi unit yang lebih kecil atau pasaran yang sedang pesat berkembang.
- Boleh memihak kepada pertahanan kedudukannya. Kekuatan persaingan memberi ganjaran kepada skala dan bahagian pasaran sedia ada. Unit yang mengganggu atau baru tumbuh dalam portfolio mungkin kelihatan lebih lemah daripada yang sebenarnya kerana kekuatan mereka terletak pada potensi masa depan, bukan metrik semasa.
Digunakan bersama alat lain seperti analisis PESTEL dan Porter's Five Forces, matriks menjadi lebih boleh dipercayai secara ketara. Analisis persekitaran luaran dari PESTEL menyumbang terus kepada pemberian skor daya tarikan industri; Five Forces menyediakan faktor intensiti persaingan.
Amalan Terbaik
- Persetujui wajaran sebelum memberi skor. Mengunci wajaran faktor sebelum mana-mana unit diberi skor menghalang rasionalisasi selepas itu.
- Gunakan saiz bulatan untuk hasil. Plot unit sebagai bulatan yang sepadan dengan asas hasil atau aset mereka. Bulatan kecil dalam zon tuaian adalah perbualan yang berbeza berbanding yang besar.
- Jalankan latihan setiap tahun. Keadaan pasaran berubah. Unit yang selektif tahun lalu mungkin telah bergerak ke zon pelaburan atau tuaian. Anggap matriks sebagai dokumen hidup, bukan projek sekali sahaja.
- Asingkan analisis daripada keputusan. Matriks memaklumkan strategi; ia tidak menggantikan pertimbangan. Bawa konteks kualitatif, terutama sekali mengenai sinergi, bakat, dan pilihan strategik, ke dalam bilik sebelum memuktamadkan cadangan.
- Libatkan pelbagai fungsi. Kewangan, produk, dan pemimpin komersial masing-masing mempunyai maklumat yang tidak dimiliki orang lain. Panel pemberian skor rentas fungsi menghasilkan keputusan yang lebih tepat berbanding anggaran eksekutif dari atas ke bawah.
- Cabar kesimpulan yang selesa. Jika setiap unit mendarat di tengah grid, kriteria pemberian skor anda mungkin terlalu sempit. Dorong untuk mencapai pembezaan tulen dalam skor.
- Hubungkan dengan peruntukan sumber. Matriks tidak bernilai melainkan ia mendorong keputusan belanjawan dan kakitangan yang sebenar. Kaitkan setiap cadangan zon kepada peruntukan modal atau pelan pelupusan yang khusus.
- Padukan dengan Ansoff Matrix. Setelah anda mengetahui unit mana hendak dilaburkan, Ansoff membantu anda memutuskan sama ada hendak berkembang melalui market penetration, pasaran baharu, produk baharu, atau diversifikasi.
Soalan Lazim
Apa perbezaan utama antara GE-McKinsey Matrix dan BCG Matrix?
BCG Matrix menggunakan dua metrik tunggal: kadar pertumbuhan pasaran dan bahagian pasaran relatif. GE-McKinsey Matrix menggantikannya dengan skor komposit yang dibina daripada 6-8 faktor berwajaran setiap paksi. Ini menjadikan GE-McKinsey lebih tepat dan lebih berguna untuk portfolio yang kompleks, tetapi juga lebih memakan masa untuk dibina. Gunakan BCG untuk imbasan pantas; gunakan GE-McKinsey apabila taruhannya cukup tinggi untuk mewajarkan analisis yang ketat.
Berapa kerap syarikat perlu mengemas kini GE-McKinsey Matrix?
Kebanyakan pasukan strategi mengemas kini matriks setiap tahun sebagai sebahagian daripada kitaran perancangan strategik. Namun peristiwa penting, seperti pendatang baharu ke pasaran, pemerolehan besar, atau perubahan mendadak dalam keadaan makroekonomi, perlu mencetuskan semakan luar kitaran. Rangka kerja analisis PESTEL dan Porter's Five Forces boleh membantu anda mengesan apabila keadaan telah berubah cukup untuk mewajarkan penyegaran matriks.
Bolehkah syarikat permulaan atau peringkat awal menggunakan GE-McKinsey Matrix?
Secara teknikal ya, tetapi secara praktikal ia sering terlalu awal. Matriks berfungsi paling baik apabila syarikat mempunyai beberapa unit perniagaan yang berbeza dengan sejarah operasi yang mencukupi untuk diberi skor pada keuntungan, bahagian pasaran, dan kekuatan jenama. Syarikat permulaan dengan satu atau dua produk baru tumbuh tidak mempunyai data perbandingan yang diperlukan oleh rangka kerja. Business Model Canvas atau Value Proposition Canvas adalah alat yang lebih sesuai pada peringkat tersebut.
Siapa yang perlu memberi skor kepada faktor-faktor dalam matriks?
Pemberian skor perlu melibatkan pasukan rentas fungsi: biasanya CFO atau ketua FP&A untuk metrik kewangan, pemimpin unit perniagaan untuk data operasi dan persaingan, dan fungsi strategi pusat untuk risikan pasaran dan penanda aras luaran. Elakkan membiarkan pemimpin unit individu memberi skor kepada unit mereka sendiri tanpa semakan luaran; kecenderungan penilaian kendiri adalah nyata dan boleh diramalkan.
Bolehkah GE-McKinsey Matrix digunakan untuk menilai lini produk berbanding unit perniagaan?
Ya. Rangka kerja ini menyesuaikan dengan baik kepada keputusan portfolio produk selagi setiap produk mempunyai ekonomi, dinamik pasaran, dan kedudukan persaingan yang berbeza. Logiknya adalah sama: beri skor kepada setiap produk pada daya tarikan industri dan kekuatan persaingan, plot mereka, dan tetapkan keutamaan pelaburan dengan sewajarnya. Hanya pastikan takrifan "industri" diskopkan dengan sesuai untuk analisis peringkat produk berbanding analisis peringkat unit perniagaan.
Ke Mana Seterusnya
GE-McKinsey Matrix memberikan anda peta portfolio: unit mana yang layak mendapat pelaburan, unit mana yang memerlukan hipotesis untuk penambahbaikan, dan unit mana yang perlu dituai. Namun peta hanya berguna jika anda mengikutinya.
Lapisan kerja seterusnya adalah menterjemahkan output matriks kepada pelaksanaan strategi. Itu bermakna menetapkan OKR untuk unit pelaburan yang mencerminkan sasaran pertumbuhan yang agresif, membina objektif SMART untuk unit selektif sekitar keupayaan tertentu yang perlu mereka bangunkan, dan menjalankan analisis rantaian nilai untuk mencari di mana unit tuaian boleh memotong kos sambil mengekalkan margin.
Strategi portfolio tanpa pelaksanaan hanyalah analisis. Matriks memberitahu anda ke mana hendak menghala kapal. Sistem pengurusan yang anda bina di sekelilingnya menentukan sama ada anda benar-benar sampai ke sana.

Senior Operations & Growth Strategist
On this page
- Apakah GE-McKinsey Matrix?
- Dua Paksi: Daya Tarikan Industri dan Kekuatan Persaingan
- 9 Sel dan 3 Zon Pelaburan
- Labur/Kembang (3 Sel Kiri Atas)
- Selektif (3 Sel Pepenjuru)
- Tuai/Lupus (3 Sel Kanan Bawah)
- Cara Memberi Skor Daya Tarikan Industri dan Kekuatan Persaingan
- Cara Membina GE-McKinsey Matrix: Langkah demi Langkah
- Langkah 1: Kenal Pasti Unit Perniagaan Anda
- Langkah 2: Takrifkan Faktor Pemberian Skor
- Langkah 3: Wajaran Faktor
- Langkah 4: Beri Skor kepada Setiap Unit Perniagaan
- Langkah 5: Plot Matriks
- Langkah 6: Tetapkan Strategi per Zon
- Contoh GE-McKinsey Matrix
- GE-McKinsey vs BCG Matrix
- Keterbatasan dan Kritikan
- Amalan Terbaik
- Soalan Lazim
- Ke Mana Seterusnya