FMEA: Failure Mode and Effects Analysis Explained
Turn this article into takeaways for your work.
Each assistant summarizes the article only for you and suggests best practices for your work.
FMEA, which stands for failure mode and effects analysis, is how engineering and operations teams stop problems before they reach the customer. If your team has ever asked "what could go wrong, and how bad would it be?", FMEA is the structured way to answer that question.
What Is FMEA?
FMEA is a structured method for identifying potential failures in a product, process, or system, determining their causes and effects, and prioritizing them by risk so the team can act on the highest-priority items first.
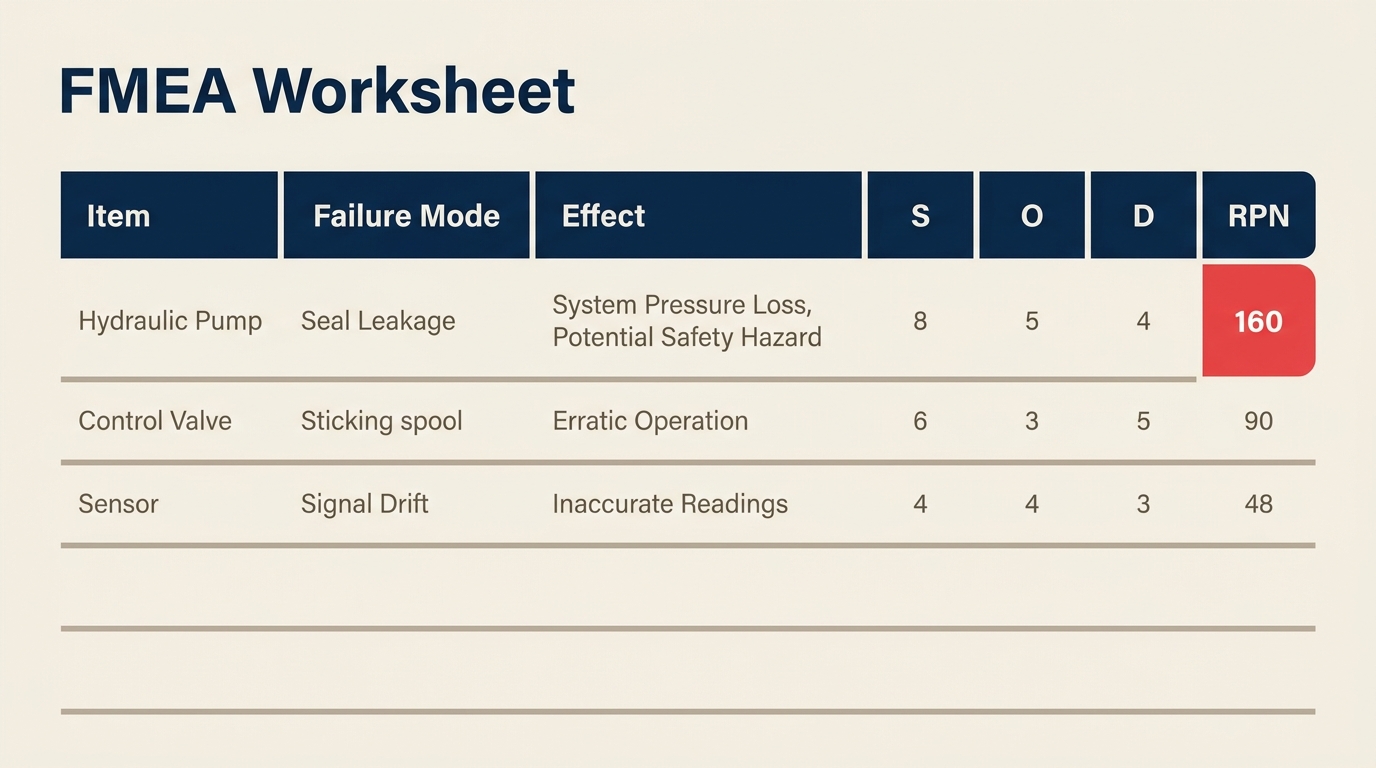
The output is a scored worksheet. Each failure mode gets a Risk Priority Number (RPN) based on three factors: how severe the failure is, how often it's likely to occur, and how well current controls can detect it before it causes harm. Teams then focus their improvement efforts on the failure modes with the highest RPNs.
FMEA doesn't just document what could go wrong. It forces cross-functional teams to think through failure systematically, before production starts or before a process change goes live.
Key Facts
FMEA was first formalized by the US military in MIL-P-1629, published in 1949, originally developed to evaluate weapon and equipment system failures for mission safety and success.
NASA adopted FMEA for the Apollo program in the 1960s as part of its reliability engineering practices, and the method spread into aerospace and automotive industries from there.
The Automotive Industry Action Group (AIAG) and VDA published a joint FMEA handbook in 2019, now the global reference standard for automotive DFMEA and PFMEA, replacing earlier editions from both organizations.
Types of FMEA
FMEA isn't one-size-fits-all. The scope determines which type you need.
| FMEA Type | Full Name | Focus | When to Use |
|---|---|---|---|
| DFMEA | Design FMEA | Product design and components | During product development, before design is finalized |
| PFMEA | Process FMEA | Manufacturing or service process steps | Before launching or changing a production process |
| SFMEA | System FMEA | Interaction between subsystems | Complex systems where failure at the interface matters most |
Design FMEA (DFMEA) looks at whether the product design itself could fail. If a plastic component cracks under thermal stress, or a software module crashes under high load, that's a design failure mode. DFMEA happens early, while engineering teams can still change drawings or specifications.
Process FMEA (PFMEA) examines what could go wrong in the process that makes or delivers the product. Even a perfect design will produce defects if the assembly steps are flawed. PFMEA is the more common type in manufacturing and service operations, and it's the one most directly tied to Six Sigma improvement projects.
System FMEA zooms out further to look at how subsystems interact. It's common in aerospace and defense when the failure point isn't any single component, but the interface between them.
For most operations and quality teams, PFMEA is the starting point. You'll encounter DFMEA when working with product development, and system FMEA mainly in highly regulated industries.
The RPN: Severity, Occurrence, and Detection
The Risk Priority Number (RPN) is the core scoring mechanism of FMEA. It's a simple formula:
RPN = Severity (S) x Occurrence (O) x Detection (D)
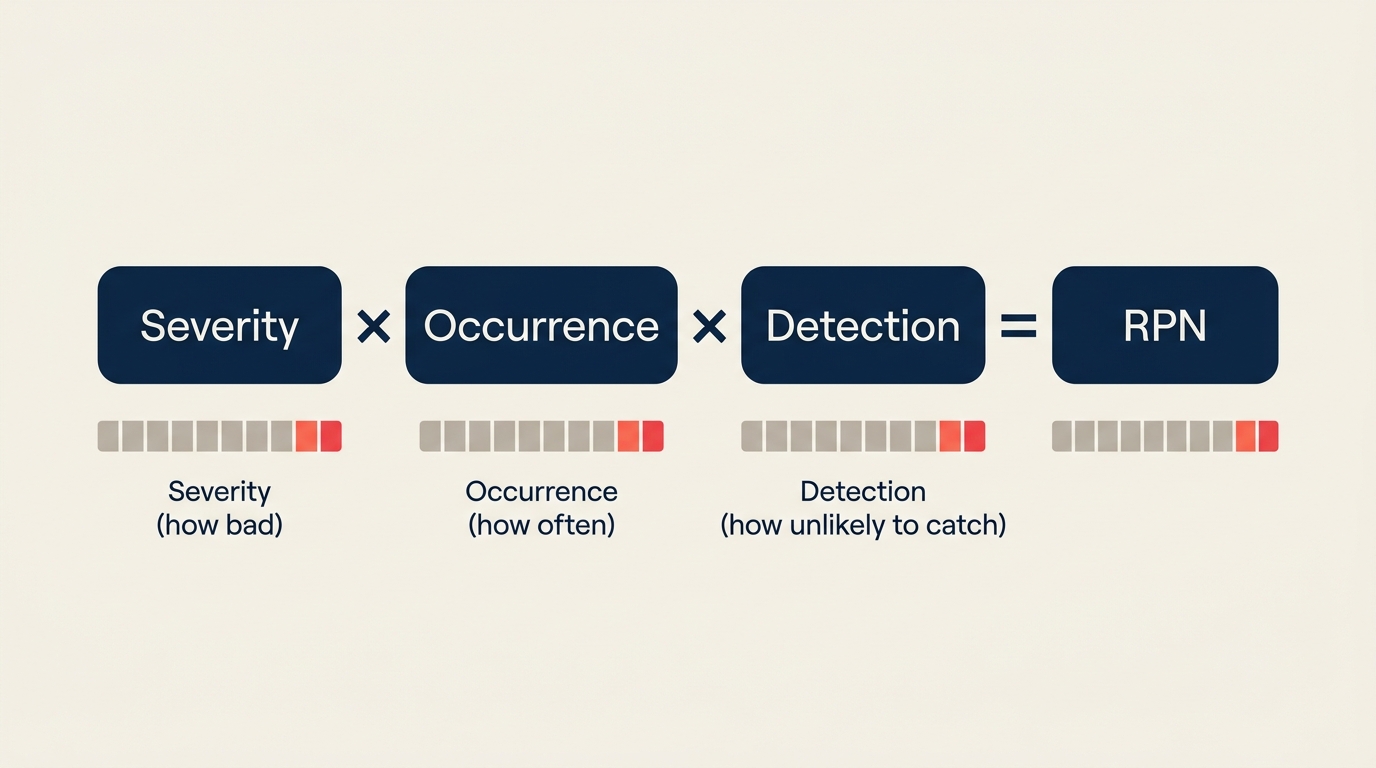
Each factor is scored on a 1-10 scale, so RPN ranges from 1 (negligible risk) to 1000 (maximum risk). Here's what each dimension means and how to score it:
Severity (S): How bad is the effect if this failure happens?
| Score | Description |
|---|---|
| 1 | No effect on product or process |
| 2-3 | Minor effect, customer may not notice |
| 4-6 | Moderate effect, customer notices and is dissatisfied |
| 7-8 | High effect, product partially inoperable, customer very dissatisfied |
| 9 | Very high severity, safety or regulatory issue with warning |
| 10 | Hazardous without warning, potential injury or failure of safety function |
Occurrence (O): How frequently is this failure likely to happen?
| Score | Description | Approximate Rate |
|---|---|---|
| 1 | Extremely unlikely | Less than 1 in 1,500,000 |
| 2-3 | Low probability | 1 in 150,000 to 1 in 15,000 |
| 4-6 | Moderate probability | 1 in 2,000 to 1 in 400 |
| 7-8 | High probability | 1 in 80 to 1 in 20 |
| 9-10 | Very high, near certain | 1 in 8 or more frequent |
Detection (D): How likely are current controls to catch the failure before it reaches the customer?
| Score | Description |
|---|---|
| 1 | Almost certain detection; control will always detect |
| 2-3 | High likelihood of detection |
| 4-6 | Moderate chance of detection |
| 7-8 | Low detection likelihood; control unlikely to catch it |
| 9-10 | No known control; failure almost certainly reaches customer |
Note that Detection is counterintuitive: a score of 1 is good (detection is near-certain), while a score of 10 is bad (no controls exist). Teams often mix this up, so it's worth confirming the direction with your team before scoring.
How to Conduct an FMEA
A well-run FMEA follows a consistent sequence. Skipping steps, especially team review and action tracking, is what turns FMEA into a paperwork exercise rather than a real risk reduction tool.
Step 1: Assemble the Right Team
FMEA works best as a cross-functional exercise. For a PFMEA, bring in process engineers, operators, quality staff, and anyone who touches the process daily. Operators often know failure modes that never appear in documentation. Aim for 4-7 people; larger groups slow down scoring without improving accuracy.
Step 2: Define the Scope
Agree on what process or system the FMEA covers. A SIPOC diagram is useful here to map the process boundaries. Without a clear scope, teams either go too broad (the FMEA becomes unmanageable) or too narrow (important failure modes fall outside the boundary and get missed).
Step 3: List All Functions and Failure Modes
For each process step or component, ask: "In what way could this step fail to perform its intended function?" One step can have multiple failure modes. Write them at the right level of detail. "Machine fails" is too vague. "Torque wrench applies insufficient torque during bolt tightening" is actionable.
Step 4: Identify Effects and Causes
For each failure mode, determine two things: what happens downstream if this failure occurs (the effect), and what causes the failure in the first place. A fishbone diagram is a practical tool for brainstorming causes systematically across categories like equipment, materials, methods, and personnel.
Step 5: Score Severity, Occurrence, and Detection
Use the 1-10 scales above. Score as a team, not as individuals. When scores differ significantly (one person says 3, another says 8), that disagreement reveals different assumptions about the process. Those conversations are valuable.
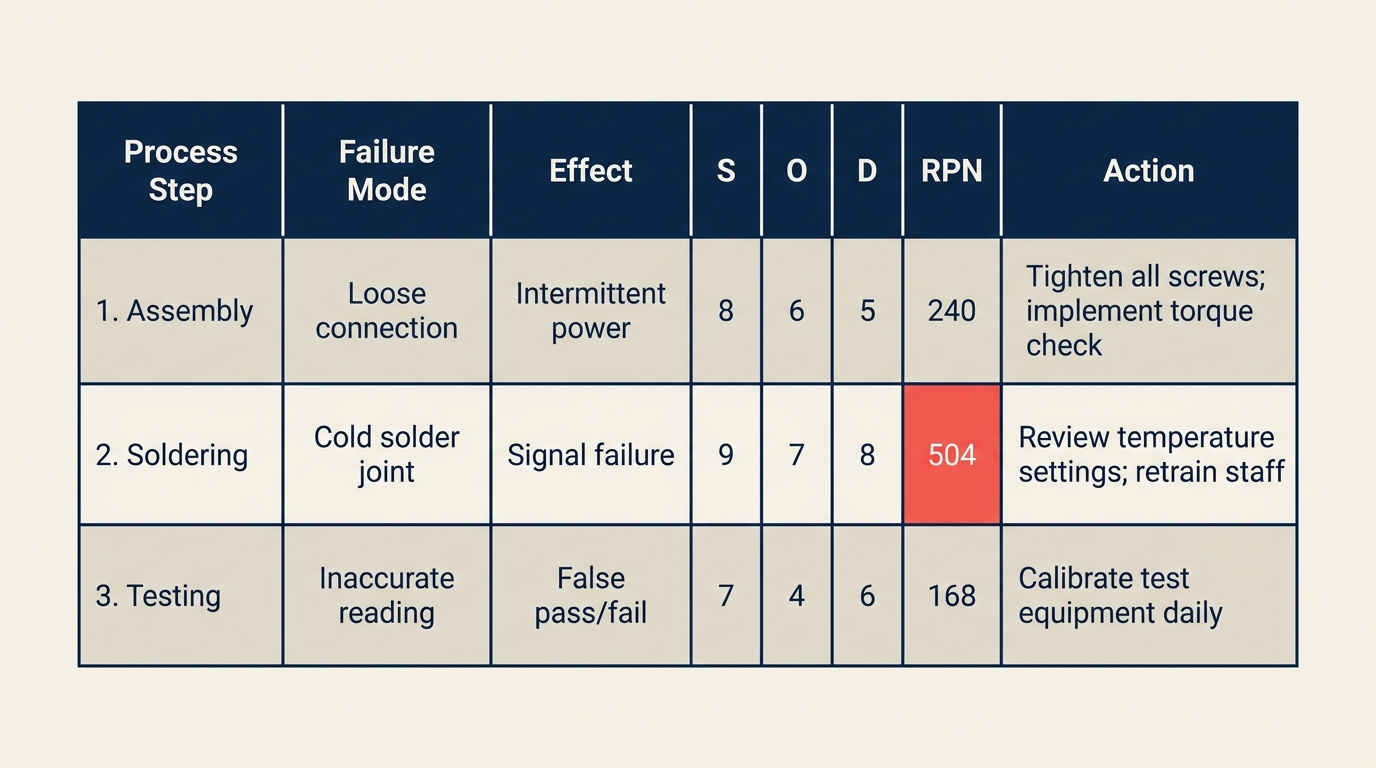
Step 6: Calculate RPN and Prioritize
Multiply S x O x D to get the RPN for each failure mode. Sort by RPN descending. Many teams set an RPN threshold (commonly 100 or 125) above which corrective actions are required, but RPN ranking alone doesn't tell the whole story. A failure mode with S=10 and RPN=80 deserves attention even if it sits below the threshold, because of the severity.
Step 7: Define Corrective Actions
For high-priority failure modes, assign a specific corrective action, a responsible owner, and a target completion date. Actions should reduce Occurrence (fix the root cause) or improve Detection (add a control). Reducing Severity often requires a design change, which is harder in PFMEA but possible in DFMEA.
Connect this step to your broader DMAIC or PDCA cycle. FMEA identifies the problems; your improvement process implements the fixes.
Step 8: Recalculate RPN After Actions
Once corrective actions are implemented, re-score Occurrence and Detection (Severity rarely changes without a design change). The new RPN documents the risk reduction achieved and confirms whether the action worked. This closing step is what separates a living FMEA from a one-time document.
FMEA Example
Below is a worked PFMEA example for a tablet packaging line in a pharmaceutical facility.
| Process Step / Function | Failure Mode | Effect | S | Potential Cause | O | Current Controls | D | RPN | Recommended Action |
|---|---|---|---|---|---|---|---|---|---|
| Fill tablet into blister | Underfill (missing tablet) | Patient receives incomplete dose | 9 | Vision system miscalibrated | 3 | Camera inspection every 2 hours | 5 | 135 | Increase inspection frequency to every 30 min; add real-time alarm |
| Seal blister foil | Weak seal | Moisture ingress, reduced shelf life | 7 | Heat platen temperature below spec | 4 | Manual temp check at start of shift | 7 | 196 | Install continuous temp monitoring with auto-shutoff |
| Print lot number | Illegible print | Traceability failure, recall risk | 8 | Ink cartridge low | 5 | Visual check by operator | 6 | 240 | Add ink-level sensor with alert before threshold |
| Final pack into carton | Wrong product in carton | Mix-up, patient safety risk | 9 | No product verification step | 2 | Label audit every 100 units | 5 | 90 | Add barcode scan verification at packing station |
| Carton labeling | Label misapplied | Non-conforming product shipped | 6 | Label feeder tension inconsistent | 3 | End-of-shift audit | 7 | 126 | Calibrate label feeder weekly; add online inspection camera |
In this example, "Illegible print" has the highest RPN at 240. The corrective action targets the root cause (low ink goes undetected) rather than just adding more inspections downstream.
FMEA vs Other Risk Tools
FMEA is one of several tools for analyzing failures and causes. Here's how it compares to the ones teams most often use alongside it.
| Tool | Primary Question | Output | Best For |
|---|---|---|---|
| FMEA | What could fail, how bad is it, and can we detect it? | Scored worksheet with RPN priorities | Proactive risk prioritization before or during process changes |
| Fishbone Diagram | What are the possible causes of this problem? | Visual cause map grouped by category | Root cause brainstorming after a defect has occurred |
| 5 Whys | What is the root cause of this specific problem? | Chain of causes down to root | Rapid root cause analysis for a known problem |
| HAZOP | What if this process variable deviates from design? | Deviation-based risk table | Chemical, process, and plant safety analysis |
FMEA and the fishbone diagram are natural complements. Use the fishbone to brainstorm all potential causes for a failure mode (Step 4 above), then use FMEA to score and prioritize those causes. You'll often run them in the same session.
Total quality management programs typically embed FMEA as a standard tool in their quality planning toolkit, especially during process design reviews.
Common Mistakes and Best Practices
Mistakes to avoid:
- Scoring as individuals. FMEA done solo produces optimistic scores. Team scoring surfaces disagreements that reveal real knowledge gaps about the process.
- Skipping recalculation. If you don't re-score after implementing actions, you have no evidence that anything improved. The before/after RPN comparison is the proof.
- Using FMEA as a checkbox. A completed FMEA binder that no one reads is worthless. The document is only as valuable as the actions it drives.
- Treating every high RPN the same. An RPN of 200 with S=10, O=2, D=10 is a different risk profile than S=5, O=8, D=5. Look at the individual scores, not just the total.
- Ignoring low-RPN items with high severity. A S=10 failure that's currently rare (O=1) can become common if volume, materials, or operators change. Flag high-severity items for monitoring even when the RPN is low.
Best practices:
- Start with a value stream map or process map before the FMEA session. Teams score better when they can see the process visually.
- Review the FMEA whenever the process changes, not just at initial launch.
- Keep a living document rather than a point-in-time snapshot. Update Occurrence and Detection scores as controls are added.
- Link each corrective action to your standard operating procedures so the fix becomes part of normal operations.
- Pair FMEA with lean methodology process reviews to catch both waste and risk in a single pass.
Frequently Asked Questions
What does FMEA stand for? FMEA stands for failure mode and effects analysis. The name describes exactly what the tool does: it identifies failure modes (the ways a process or product can fail), analyzes their effects (what happens when they fail), and scores them so teams can prioritize the most important risks.
What is an RPN in FMEA? RPN stands for Risk Priority Number. It's calculated by multiplying three scores, each on a 1-10 scale: Severity (how bad the failure effect is), Occurrence (how often the failure is likely to happen), and Detection (how unlikely current controls are to catch it). The formula is: RPN = S x O x D. The result ranges from 1 to 1000. Higher RPNs indicate higher-priority failure modes requiring corrective action.
What's the difference between DFMEA and PFMEA? Design FMEA (DFMEA) analyzes potential failures in a product design, before the design is finalized. It's used by product development and engineering teams. Process FMEA (PFMEA) analyzes potential failures in the manufacturing or service process that produces or delivers the product. PFMEA is used by operations and quality teams and is the more common type in day-to-day process improvement work.
When should you use FMEA? FMEA is most valuable before a problem happens, not after. Use it when launching a new process or product, before making a significant process change, during a Six Sigma DMAIC project's Improve phase, or during any regulatory quality planning review (common in medical devices, automotive, and aerospace). It's a proactive tool, not a reactive one. After a problem occurs, a fishbone diagram or 5 Whys analysis is faster and more targeted.
What RPN threshold should trigger corrective action? There's no universal rule, but a common starting point is RPN greater than 100-125. But RPN alone shouldn't be the only trigger. Any failure mode with Severity of 9 or 10 warrants attention regardless of RPN, because the consequence of that failure is too serious to leave unaddressed. Many teams use a combination: mandatory action above RPN 100, plus mandatory review for any S greater than or equal to 9.
FMEA works because it takes a question every operations team already asks ("what could go wrong?") and turns it into a scored, prioritized list with owners and deadlines. The rigor is what makes the difference. Teams that treat it as a living document and close the loop on corrective actions consistently outperform those that complete the worksheet and file it away.

Senior Operations & Growth Strategist
On this page
- What Is FMEA?
- Key Facts
- Types of FMEA
- The RPN: Severity, Occurrence, and Detection
- Severity (S): How bad is the effect if this failure happens?
- Occurrence (O): How frequently is this failure likely to happen?
- Detection (D): How likely are current controls to catch the failure before it reaches the customer?
- How to Conduct an FMEA
- Step 1: Assemble the Right Team
- Step 2: Define the Scope
- Step 3: List All Functions and Failure Modes
- Step 4: Identify Effects and Causes
- Step 5: Score Severity, Occurrence, and Detection
- Step 6: Calculate RPN and Prioritize
- Step 7: Define Corrective Actions
- Step 8: Recalculate RPN After Actions
- FMEA Example
- FMEA vs Other Risk Tools
- Common Mistakes and Best Practices
- Frequently Asked Questions