Process Capability: Cp and Cpk Explained (With Formulas)
Turn this article into takeaways for your work.
Each assistant summarizes the article only for you and suggests best practices for your work.
Process capability is how you answer the question every quality manager actually cares about: can this process consistently produce parts or outputs within the customer's accepted range? Before you can answer that, you need two numbers: Cp and Cpk.
This article breaks down what those numbers mean, how to calculate them, and how to act on them. You'll find the full formulas, a worked numerical example, an interpretation table with DPMO figures, and the most common mistakes teams make when applying these metrics for the first time.
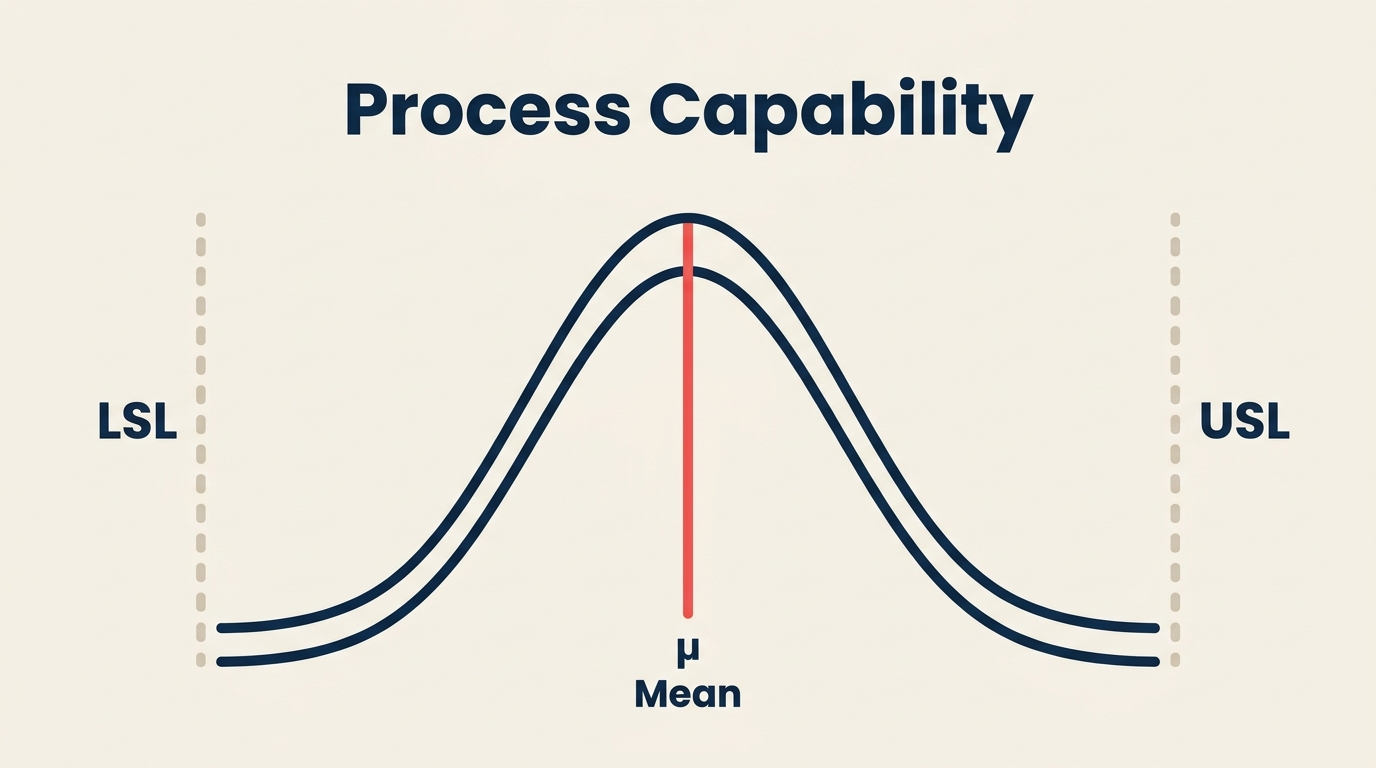
What Is Process Capability?
Process capability is a statistical measure that compares how much natural variation exists in a process (the "voice of the process") against how much variation the customer will tolerate (the "voice of the customer," expressed as specification limits).
You have two specification limits:
- USL (Upper Specification Limit): the highest acceptable value
- LSL (Lower Specification Limit): the lowest acceptable value
The gap between those limits is the spec window. Process capability asks: does the spread of your process fit inside that window, and is the process centered within it?
A capable process produces outputs that land inside the spec window reliably. An incapable process produces defects, rework, and customer complaints regardless of how hard operators try.
Key Facts
- Cpk 1.33 is the most widely cited industry minimum for production processes. Values below 1.33 signal that the process needs improvement before it can be considered production-ready.
- A Cpk of 2.0 corresponds to Six Sigma quality: roughly 3.4 defects per million opportunities (DPMO), or a yield of 99.99966%. (Source: Montgomery, Introduction to Statistical Quality Control, 8th ed., 2019)
- Studies from ASQ suggest that companies running processes at Cpk below 1.0 see defect rates that can run 10 to 30 times higher than processes at Cpk 1.33, driving up rework costs and warranty claims. (Source: ASQ Quality Progress, 2021)
Cp vs Cpk
Cp and Cpk are related but measure different things.
Cp (Process Capability Ratio) measures whether the spec window is wide enough to contain the natural spread of the process. It ignores where the process is centered. Think of it as asking: "Is there enough room?"
Cpk (Process Capability Index) measures whether the process is actually staying inside the spec limits, taking centering into account. It asks: "Are we using that room well?"
A process can have a high Cp (plenty of room in the spec) but a low Cpk (the process is shifted toward one limit). The reverse is impossible: Cpk can never exceed Cp.
| Metric | Centering considered? | What it tells you |
|---|---|---|
| Cp | No | Whether the spec window is wide enough relative to process spread |
| Cpk | Yes | Whether the process is actually staying within spec |
The formulas:
Cp = (USL - LSL) / (6 x standard deviation)
Cpk = minimum of [(USL - mean) / (3 x standard deviation)] and [(mean - LSL) / (3 x standard deviation)]
Where "standard deviation" refers to the within-subgroup (short-term) standard deviation, typically estimated from a control chart's average moving range or R-bar.
When the process is perfectly centered, Cp equals Cpk. The further the mean drifts toward either limit, the more Cpk drops below Cp.
A simple way to remember it: if Cp is the size of the parking spot and the process spread is the width of your car, Cpk tells you whether you parked in the center of the spot or with the bumper kissing one side. You can have a wide parking spot (high Cp) and still be badly parked (low Cpk).
For statistical process control purposes, you want a stable, in-control process before you calculate capability. Running Cp or Cpk on an unstable process gives you a number that means nothing. Verify stability on a control chart first, then calculate capability.
How to Calculate Cpk
Here's a step-by-step worked example using real numbers.
Scenario: A machining operation produces shafts with a target diameter of 50.00 mm. The spec limits are:
- USL = 50.15 mm
- LSL = 49.85 mm
- Spec width = 0.30 mm
After collecting 100 samples from an in-control process, you calculate:
- Process mean = 50.04 mm
- Within-subgroup standard deviation = 0.04 mm
Step 1: Calculate Cp
Cp = (USL - LSL) / (6 x standard deviation) Cp = (50.15 - 49.85) / (6 x 0.04) Cp = 0.30 / 0.24 Cp = 1.25
This tells you the spec window is 1.25 times larger than the process spread. There's some room, but not a lot.
Step 2: Calculate the upper capability index (CPU)
CPU = (USL - mean) / (3 x standard deviation) CPU = (50.15 - 50.04) / (3 x 0.04) CPU = 0.11 / 0.12 CPU = 0.917
Step 3: Calculate the lower capability index (CPL)
CPL = (mean - LSL) / (3 x standard deviation) CPL = (50.04 - 49.85) / (3 x 0.04) CPL = 0.19 / 0.12 CPL = 1.583
Step 4: Take the minimum
Cpk = minimum of (CPU, CPL) = minimum of (0.917, 1.583) = 0.917
Interpretation: The process mean has shifted toward the upper limit. Even though Cp is 1.25 (borderline acceptable), Cpk is only 0.917. That means the process is not capable. The shaft diameters are bumping against the upper limit and producing out-of-spec parts.
The fix here is recentering the process toward 50.00 mm, not reducing variation. Once recentered, Cpk will rise to match Cp.
What to do when Cpk is too low:
- If Cpk is low but Cp is acceptable: the process spread fits within spec but the mean has drifted. Investigate tooling wear, fixture alignment, or material lot changes that shift the mean.
- If both Cp and Cpk are low: the process is too variable. You need to reduce variation by addressing its root causes, using tools like a histogram to see the distribution shape, or a fishbone diagram to identify contributors.
- If Cp is fine and Cpk is close to Cp but still below 1.33: you're close. Small centering adjustments (set-point changes, calibration) may be enough.
How to Interpret Cpk Values
Use this table as a reference. The DPMO figures assume a normal distribution and no process shift beyond what Cpk already captures.
| Cpk Range | Assessment | Approx. DPMO | Approx. Yield |
|---|---|---|---|
| Below 1.00 | Not capable | > 2,700 | < 99.73% |
| 1.00 to 1.33 | Marginal; monitor closely | 64 to 2,700 | 99.73% to 99.994% |
| 1.33 | Industry minimum (common standard) | ~64 | 99.994% |
| 1.33 to 1.67 | Capable | 6 to 64 | 99.994% to 99.9994% |
| 1.67 to 2.00 | Good; suitable for critical dimensions | ~0.6 to 6 | 99.9994%+ |
| 2.00 and above | Six Sigma quality | ~3.4 | 99.99966% |
The 1.33 threshold shows up everywhere in Six Sigma programs and ISO/IATF quality standards because it builds in a buffer for process drift. If Cpk sits right at 1.00, the tails of the distribution touch the spec limits and any small shift produces defects immediately.
For safety-critical dimensions (aerospace fasteners, medical device tolerances), many customers require Cpk 1.67 or higher. Automotive suppliers under IATF 16949 often face a Ppk requirement of 1.67 during first production runs, before switching to ongoing Cpk monitoring.
Cp/Cpk vs Pp/Ppk
You'll see Pp and Ppk in many quality reports alongside Cp and Cpk. The difference is which standard deviation you use.
| Index | Variation type | Standard deviation source | When to use |
|---|---|---|---|
| Cp / Cpk | Within-subgroup (short-term) | Estimated from R-bar or moving range on a control chart | Ongoing process monitoring; potential capability |
| Pp / Ppk | Overall (long-term) | Calculated directly from all data points (overall sigma) | Initial process qualification; actual performance |
Cp/Cpk answers: "What is the process capable of when it's running consistently?" It strips out special causes and focuses on common-cause variation.
Pp/Ppk answers: "How did the process actually perform over this entire data set, including any shifts and drifts?"
During a DMAIC project, you'll typically calculate Pp/Ppk in the Measure phase to understand current performance, then target Cp/Cpk improvements in the Improve phase to hit the desired capability level going forward.
Common Mistakes
Running capability on an unstable process. This is the most serious error. If your control chart shows out-of-control signals (points outside control limits, runs, trends), fix those first. Capability indices on an unstable process are statistically invalid.
Confusing Cp with Cpk. A plant manager who reports Cp = 1.5 and calls the process capable is missing the picture if Cpk is 0.9. Always report both.
Using too few data points. Capability studies typically need at least 100 observations (or 25 subgroups of 4) to get a stable estimate of standard deviation. A 20-point sample will produce a Cpk estimate with wide confidence intervals.
Assuming normality without checking. The formulas above assume a normal distribution. If you're measuring a process with a skewed or multimodal output (cycle times, call handling, surface finish), a histogram will reveal whether normality holds. Non-normal data requires transformation or non-parametric capability methods.
Optimizing Cpk alone without fixing root causes. You can game Cpk by widening spec limits or by sorting out-of-spec parts before measurement. Neither improves the actual process. Real capability improvement comes from reducing variation at its source, using tools like the fishbone diagram or five whys.
Skipping the total quality management context. Capability indices are one tool in a broader quality system. A Cpk of 1.4 on a critical characteristic is only meaningful if you also have a measurement system capable of detecting real variation (gauge R&R), calibrated equipment, and a stable supply chain.
Frequently Asked Questions
What's the difference between Cp and Cpk? Cp measures whether the spec window is wide enough for the process spread, without considering where the process mean sits. Cpk accounts for centering: it measures how close the process mean is to the nearest spec limit. When the process is perfectly centered, Cp and Cpk are equal. Any shift off-center causes Cpk to fall below Cp.
What Cpk value do I need? The most common industry minimum is 1.33. Safety-critical applications (aerospace, medical, automotive) often require 1.67 or 2.0. Check your customer's quality requirements or relevant standards (IATF 16949, AS9100, ISO 13485) for the specific threshold that applies to your process.
Can Cpk be negative? Yes. A negative Cpk means the process mean has crossed a spec limit, so the process is producing a majority of out-of-spec output. Fix centering and stability before anything else.
Do I need a normal distribution to calculate Cpk? The standard formulas assume normality. For clearly non-normal data, you need either a Box-Cox transformation, a non-parametric capability approach (percentile method), or a distribution-specific formula. Always plot a histogram first to check the shape of your data.
What's the relationship between Cpk and sigma level? A Cpk of 1.0 corresponds to three sigma (99.73% yield, 2,700 DPMO). A Cpk of 1.33 corresponds to four sigma. A Cpk of 1.67 corresponds to five sigma. A Cpk of 2.0 corresponds to six sigma (3.4 DPMO). The relationship is: sigma level = 3 x Cpk (for a centered process without the 1.5-sigma shift assumption).
Process capability is one of those numbers that forces honest conversations about whether a process is actually ready for production. A Cpk below 1.33 isn't a bureaucratic concern: it means customers are receiving defects. The formulas are simple; the discipline to measure correctly, verify stability first, and act on the results is where most of the real work happens.
Start with a control chart to confirm your process is stable. Then run Cpk. Then use DMAIC to drive it higher if it falls short.

Senior Operations & Growth Strategist