Wardley Mapping: So erstellen Sie Ihre Strategiekarte
Turn this article into takeaways for your work.
Each assistant summarizes the article only for you and suggests best practices for your work.
Wardley Mapping ist eine visuelle Strategiemethode, die jede Komponente Ihrer Wertschöpfungskette auf einer Evolutionsachse abbildet, von neu und unvorhersehbar bis vollständig standardisiert und unsichtbar. Anders als eine Präsentation voller Aufzählungspunkte zwingt eine Wardley Map Sie dazu, Ihr Unternehmen als eine Menge beweglicher Teile zu betrachten, von denen jedes im Laufe der Zeit zum Standardprodukt wird und je nach seiner Position ein unterschiedliches Risikoprofil trägt.
Simon Wardley entwickelte den Ansatz um 2005, als er Fotango leitete, einen Cloud-Vorläufer innerhalb von Canon. Er versuchte, eine Frage zu beantworten, mit der die meisten Führungskräfte noch immer ringen: „Worauf sollten wir uns eigentlich konzentrieren?" Seine Antwort war situatives Bewusstsein, entlehnt aus der Militärstrategie und auf Technologie- und Geschäftslandschaften übertragen.
Was ist Wardley Mapping?
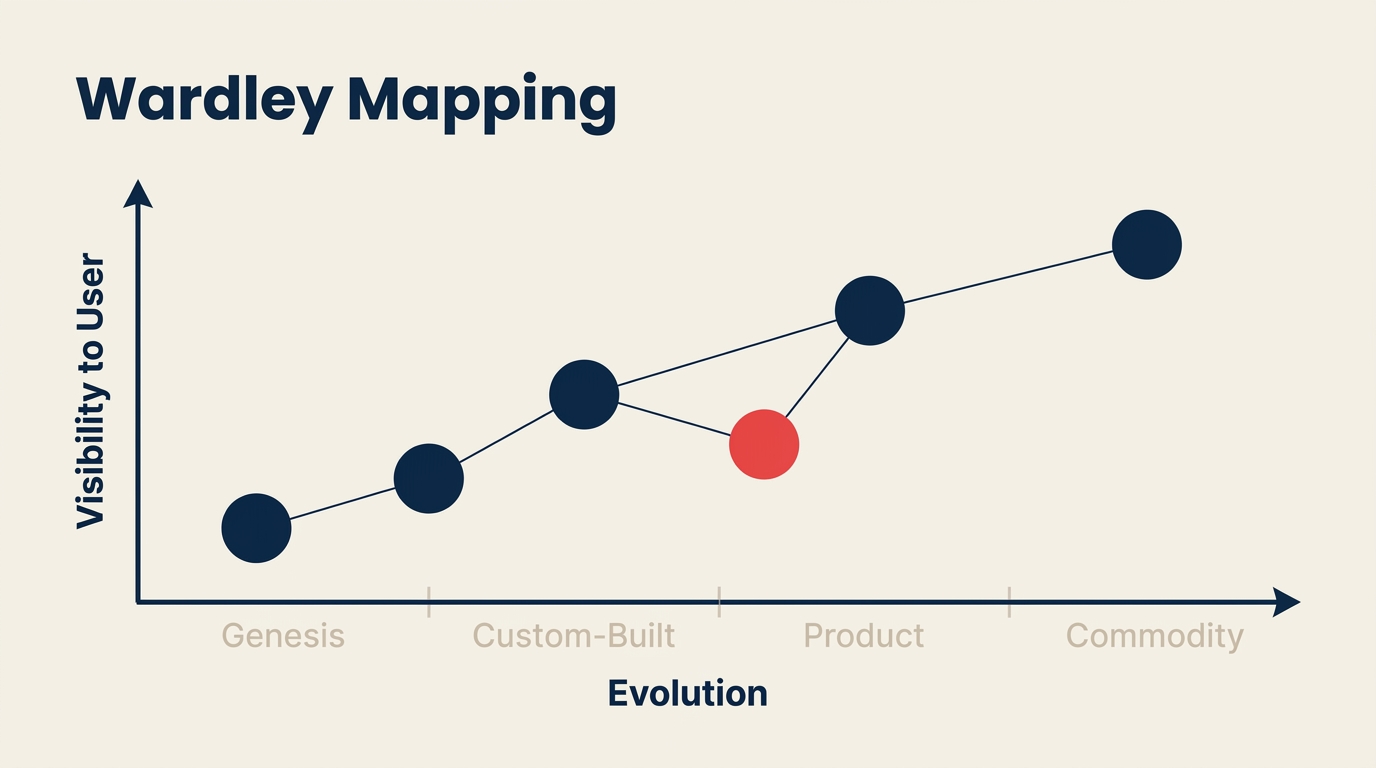
Eine Wardley Map ist eine Wertschöpfungskette, die auf einem zweidimensionalen Canvas dargestellt wird. Die Y-Achse zeigt die Sichtbarkeit für den Endnutzer: Komponenten oben sind solche, die der Nutzer direkt wahrnimmt, während Komponenten weiter unten die Infrastruktur oder Fähigkeiten darstellen, die die obere Ebene zum Funktionieren bringen. Die X-Achse zeigt den Evolutionsstand: wie ausgereift, standardisiert und allgemein verfügbar jede Komponente ist.
Sie zeichnen Linien zwischen den Komponenten, um Abhängigkeiten darzustellen. Dann analysieren Sie, was der Evolutionsstand jeder Komponente darüber aussagt, wie Sie mit ihr umgehen sollten. Eine Komponente in der frühen „Genesis"-Phase braucht Erkundung und Experimentation. Eine in der „Commodity"-Phase kauft man am besten von der Stange. Die Karte macht diese Unterschiede auf einen Blick sichtbar.
Wichtige Begriffe:
- Wertschöpfungskette: die geordnete Menge von Komponenten, die erforderlich sind, um einen Nutzerbedarf zu erfüllen
- Evolutionsachse: die X-Achse, die von Genesis über Custom-built und Product bis Commodity verläuft
- Doctrine: universelle Best Practices (z. B. „transparent sein", „geeignete Methoden verwenden"), die unabhängig vom Kontext gelten
- Climatic patterns: Marktkräfte, die auf jede Karte gleich wirken (z. B. „alles entwickelt sich zur Commodity")
- Situatives Bewusstsein: zu wissen, wo Sie und Ihre Wettbewerber tatsächlich stehen, bevor Sie entscheiden, was zu tun ist
Wichtige Fakten
- Nur 37 % der Führungskräfte geben an, dass ihre Organisationen strategische Prioritäten effektiv umsetzen können, so Gartner (2023).
- McKinsey-Forschung ergab, dass 70 % der Misserfolge bei der Strategieumsetzung auf mangelnde organisatorische Ausrichtung zurückzuführen sind und nicht auf eine schlechte Strategie selbst (McKinsey Quarterly, 2021).
- Unternehmen, die systematisches situatives Bewusstsein in ihrer Technologiestrategie praktizieren, sind 2,5-mal häufiger in der Lage, Mitbewerber bei der digitalen Transformationsreife zu übertreffen (Deloitte Digital Transformation Survey, 2023).
Die zwei Achsen: Wertschöpfungskette und Evolution
Die Y-Achse geht es um Nutzersichtbarkeit. Was der Nutzer direkt sieht und nutzt, kommt nach oben. Backend-Systeme, Lieferantenbeziehungen und technische Infrastruktur sitzen weiter unten. Diese Reihenfolge ist wichtig, weil es dem Nutzer egal ist, wie die Technik im Hintergrund funktioniert. Als Stratege müssen Sie jedoch wissen, welche unsichtbare Komponente die gesamte Wertschöpfungskette zum Erliegen bringen könnte.
Die X-Achse verfolgt die evolutionäre Reife über vier Stufen:
| Stufe | Beschreibung | Umgang damit |
|---|---|---|
| Genesis | Neu, wenig verstanden, individuell entwickelt, experimentell | Erkunden, Chaos akzeptieren, vorsichtig investieren |
| Custom-built | Im Haus gebaut, verstanden, aber noch nicht standardisiert | Verbessern, Verschwendung reduzieren, Produktisierung anstreben |
| Product | Als kommerzielle Produkte oder Mietdienste verfügbar | Anbieterwettbewerb nutzen, Überengineering vermeiden |
| Commodity | Standardisiert, versorgungsartig, oft unsichtbar | Von der Stange kaufen, automatisieren, Kosten senken |
Die Erkenntnis, die Wardley immer wieder betont: Komponenten bleiben nicht, wo sie sind. Alles bewegt sich von links nach rechts. Rechenleistung war in den 1990er Jahren eine individuelle Engineering-Herausforderung. 2010 war sie ein Produkt (lizenzierte Server). 2020 war sie Commodity-Cloud. Eine Strategie, die Commodity-Komponenten wie Custom-built behandelt, verschwendet Ressourcen. Eine Strategie, die aufkommende Komponenten behandelt, als wären sie bereits Commodity, verpasst die Chance, eine verteidigungsfähige Position aufzubauen.
Wardley Mapping vs. andere Strategietools
Die meisten Strategietools analysieren eine Momentaufnahme. Wardley Maps zeigen Bewegung.
| Tool | Fokus | Ergebnis | Bester Einsatz |
|---|---|---|---|
| Wardley Map | Landschaftsposition und Evolution über die Zeit | Visuelle Karte von Komponenten mit Abhängigkeiten | Technologiestrategie, Build-vs.-Buy, Wettbewerbspositionierung |
| SWOT-Analyse | Interne Stärken/Schwächen vs. externe Chancen/Risiken | 2x2-Matrix | Breite strategische Überprüfung, Jahresplanung |
| Business Model Canvas | Wie ein Unternehmen Wert schafft und erfasst | Einseitige Canvas mit 9 Blöcken | Neugründungsdesign, Geschäftsmodell-Tests |
| Wertkettenanalyse | Wo in Ihren Abläufen Wert hinzugefügt oder Kosten anfallen | Aktivitätsdiagramm | Betriebliche Effizienz, Beschaffungsentscheidungen |
Der praktische Unterschied: Eine SWOT-Analyse sagt Ihnen, dass „Technologieinfrastruktur" eine Stärke oder Schwäche ist. Eine Wardley Map sagt Ihnen genau, welche Infrastrukturkomponenten sich in Richtung Commodity bewegen (und ausgelagert werden sollten) und welche noch in der Genesis-Phase sind (und ein Wettbewerbsvorteil werden könnten, wenn Sie jetzt investieren). Diese Präzision macht sie für Entscheidungen nützlich, nicht nur für Diagnosen.
Wenn Sie heute die Wertkettenanalyse nutzen, können Sie Wardley Mapping darauf aufsetzen. Ihre Wertschöpfungsaktivitäten werden zur Y-Achse. Die Evolutionsstufen geben jeder Aktivität eine Zeitdimension, die das ursprüngliche Porter-Framework nie lieferte.
Ähnlich ergänzt Szenarioplanung Wardley Maps auf natürliche Weise. Szenarien beschreiben mögliche Zukünfte. Wardley Maps ermöglichen es Ihnen zu testen, welche Komponenten in Ihrer aktuellen Wertschöpfungskette in jedem Szenario anfällig sind.
So erstellen Sie eine Wardley Map
Schritt 1: Nutzer und Bedarf identifizieren
Beginnen Sie mit der Person, die das konsumiert, was Sie produzieren. Kein Segment, keine Persona: ein konkreter Nutzer mit einem konkreten Bedarf. Schreiben Sie ihn oben auf Ihre Canvas. Alles andere auf der Karte dient dazu, diesen Bedarf zu erfüllen. Wenn Sie diesen Schritt überspringen, wird die Karte ein Technologiediagramm ohne strategischen Anker.
Schritt 2: Die Wertschöpfungskette abbilden
Arbeiten Sie sich vom Nutzerbedarf rückwärts vor. Womit interagiert der Nutzer? Wovon hängt diese Komponente ab? Fragen Sie weiter „Was braucht dies, um zu funktionieren?", bis Sie die Infrastruktur erreichen. Jede Komponente erhält einen Knoten. Zeichnen Sie Abhängigkeitslinien zwischen ihnen. In dieser Phase machen Sie sich noch keine Gedanken darüber, wo die Komponenten auf der X-Achse liegen. Machen Sie zunächst nur die Kette sichtbar.
Schritt 3: Komponenten auf der Evolutionsachse platzieren
Weisen Sie jetzt jeder Komponente eine Position entlang Genesis, Custom-built, Product oder Commodity zu. Nutzen Sie diese Signale zur Orientierung. Ist die Komponente gut verstanden und weit verfügbar? Commodity oder Product. Haben nur wenige Organisationen sie herausgefunden? Custom-built. Ist sie brandneu und wird gerade aktiv entwickelt? Genesis.
Dieser Schritt ist der schwierigste. Teams streiten häufig über die Platzierungen, was ein Feature ist, kein Fehler. Die Meinungsverschiedenheit legt verborgene Annahmen offen.
Schritt 4: Bewegung und Trägheit analysieren
Rechnen Sie damit, dass sich jede Komponente im Laufe der Zeit nach rechts bewegt. Fragen Sie: Was bewegt sich am schnellsten? Was wird durch interne Trägheit (Legacy-Systeme, Kompetenzlücken, Verträge) am Vorankommen gehindert? Trägheit ist eine wesentliche Quelle strategischen Risikos. Sie ist auch der Bereich, in dem etablierte Anbieter gegenüber Newcomern verlieren, die nicht durch Altlasten gebunden sind.
Wenn ein Wettbewerber eine Product-Stufen-Komponente als Commodity behandelt und Sie sie noch selbst entwickeln, verschwenden Sie Ressourcen. Wenn andererseits eine Komponente noch in der Genesis-Phase ist und Sie sie wie eine Commodity behandeln, indem Sie sie an einen einzigen Anbieter auslagern, bauen Sie zum denkbar schlechtesten Zeitpunkt eine Abhängigkeit auf.
Schritt 5: Doctrine und Climatic Patterns anwenden
Doctrine ist kontextfreie Best Practice: zum Beispiel „die jeweils geeignetste Methode für jede Komponentenstufe verwenden", „kleine, autonome Teams rund um Nutzerbedürfnisse aufbauen" und „die Karte niemals mit der Realität verwechseln". Doctrine gilt unabhängig davon, wie Ihre Karte aussieht.
Climatic patterns sind vorhersehbare Kräfte, die auf jede Branche wirken: Alles standardisiert sich, Ökosysteme entwickeln sich schneller, wenn sich angebotsseitige Verschiebungen ergeben, übergeordnete Systeme entstehen aus Commodity-Komponenten. Das Erkennen dieser Muster hilft Ihnen, Bewegungen vorherzusehen, anstatt nur darauf zu reagieren.
Schritt 6: Strategische Maßnahmen festlegen
Jetzt können Sie konkrete Entscheidungen treffen. Sollen Sie eine Fähigkeit entwickeln oder einkaufen? Build, Borrow oder Buy-Frameworks funktionieren wesentlich besser, wenn Sie den Evolutionsstand einer Komponente kennen. Eine Genesis-Fähigkeit kauft man nicht (es gibt noch kein Produkt). Eine Commodity-Fähigkeit entwickelt man nicht selbst (Zeit- und Geldverschwendung).
Weitere strategische Maßnahmen umfassen: die Commoditisierung eines Wettbewerbsvorteils des Konkurrenten beschleunigen (etwas Open-Source machen, auf das er angewiesen ist), in Genesis-Komponenten investieren, die Ihr künftiger Burggraben werden, oder Custom-built-Komponenten abstoßen, die sich commoditisieren und nicht mehr verteidigbar sind.
Wardley Mapping in der Praxis
Theorie ergibt mehr Sinn, wenn man sie im Kontext sieht. Hier sind drei Szenarien, in denen Teams Wardley Maps auf reale Entscheidungen anwenden:
| Szenario | Was die Karte zeigte | Getroffene Entscheidung |
|---|---|---|
| SaaS-Startup, Build vs. Buy | Authentifizierung und Abrechnung befanden sich beide in der Product-to-Commodity-Phase. Das Team entwickelte beides intern. | Beide eigenen Entwicklungen aufgegeben, zu Auth0 und Stripe gewechselt. 3 Ingenieure für Arbeit auf Product-Stufe freigestellt. |
| Enterprise-IT-Infrastruktur | On-Premise-Rechenzentren waren Commodity. Das interne Team behandelte sie wie Custom-built mit aufwändiger interner Wartung. | Migration in die Cloud. Infrastrukturkosten um 40 % gesenkt. Team für Data-Pipeline-Arbeit, die noch in der Genesis-Phase ist, neuausgerichtet. |
| Produkt-Roadmap-Priorisierung | Drei geplante Features wurden Commodity-Komponenten zugeordnet (Workflow-Automatisierung, Reporting, einfaches CRM). Eines wurde Genesis zugeordnet (ein neuartiges KI-gestütztes Prognosemodell). | Die Commodity-Features zugunsten der Genesis-Investition zurückgestellt. Partner integrierten die Commodity-Anforderungen über API. |
Diese Beispiele teilen ein Muster: Die Karte macht sichtbar, was zuvor unsichtbar war: was gekauft statt entwickelt werden sollte und wo einzigartiges Investment dauerhaften Vorteil schafft.
Dies verbindet sich direkt mit dem Wettbewerbsvorteil: Ihre verteidigungsfähige Position liegt in den Komponenten, die sich noch in der Custom-built- oder Genesis-Phase befinden. Sobald sie zur Commodity werden, können Wettbewerber sie replizieren. Disruptive Innovation funktioniert oft genau so und nutzt neu standardisierte Komponenten, um etablierte Anbieter zu unterbieten, die noch zu viel in sie investieren.
Vorteile und Grenzen
Vorteile:
- Zwingt zur Präzision. Man kann sich bei einer Wardley Map nicht um klare Aussagen drücken. Jede Komponente braucht eine Position, und diese Position impliziert eine Entscheidung.
- Macht Trägheit sichtbar. Teams stellen häufig fest, dass sie den Großteil ihres Engineering-Budgets für Commodity-Komponenten ausgeben, weil Legacy-Systeme es notwendig erscheinen lassen.
- Richtet Teams aus. Eine gemeinsame Karte ersetzt 20 Präsentationen konkurrierender Prioritäten durch eine einzige Ansicht, gegen die jeder argumentieren oder auf der jeder aufbauen kann.
- Funktioniert auf mehreren Ebenen. Sie können ein einzelnes Produkt, eine Geschäftseinheit oder ein ganzes Unternehmen abbilden.
- Ergänzt andere Tools gut. Nutzen Sie sie mit Jobs-to-be-Done zur Validierung von Nutzerbedürfnissen, Szenarioplanung für die Modellierung zukünftiger Zustände oder Blue Ocean Strategy zur Identifizierung unumkämpfter Räume.
Grenzen:
- Steile anfängliche Lernkurve. Die Mapping-Syntax ist nicht intuitiv, und die meisten Teams brauchen einige Sitzungen, bevor die Karten Erkenntnisse liefern statt Verwirrung.
- Erfordert ehrliche Platzierung. Wenn Ihr Team politisch in ein Projekt investiert ist, wird es es in einer schmeichelhafteren Evolutionsstufe platzieren, als es verdient.
- Karten veralten. Technologie- und Marktbedingungen verschieben sich. Eine Wardley Map von vor 18 Monaten kann aktiv irreführend sein, wenn Sie sie nicht aktualisiert haben.
- Schwer auf sehr große Organisationen skalierbar. Sie können ein Produkt oder eine Geschäftseinheit abbilden. Die Kartierung eines gesamten Unternehmens mit 50.000 Mitarbeitern ergibt ein Bild, das zu komplex ist, um ohne vorherige Segmentierung darauf zu reagieren.
Die Strategy Map und die Balanced Scorecard sind besser geeignet, wenn Sie die Strategie an die gesamte Organisation kommunizieren müssen. Wardley Maps entfalten ihre Stärke am meisten in der Technologie- und Produktstrategie, wo die Sichtbarkeit auf Komponentenebene die wichtigsten Investitionsentscheidungen antreibt.
Häufig gestellte Fragen
Ist Wardley Mapping kostenlos?
Ja. Simon Wardley hat die Methode unter einer Creative-Commons-Lizenz veröffentlicht. Das Buch ist online kostenlos unter wardleymaps.com verfügbar. Es ist keine Softwarelizenz oder Zertifizierung erforderlich, um anzufangen.
Welche Software nutzen Teams zur Erstellung von Wardley Maps?
Die beliebtesten Tools sind OnlineWardleyMaps (kostenlos, Open-Source, speziell für diese Methode entwickelt), Miro und Mural (allgemeine Whiteboarding-Tools mit Community-Vorlagen) sowie einfache Zeichenwerkzeuge wie Excalidraw oder Google Slides für schnelle Sitzungen. Manche Teams nutzen spezielle Tools wie MapScript oder Wardley Maps AI für automatische Platzierungsvorschläge.
Wie unterscheidet sich eine Wardley Map von einer Wertkettenanalyse?
Eine traditionelle Wertkettenanalyse zeigt, wo in Ihren Abläufen Wert geschaffen wird, behandelt die Kette jedoch als statisch. Eine Wardley Map fügt die Evolutionsachse hinzu, die eine Momentaufnahme in eine strategische Trajektorie verwandelt. Sie sehen, welche Teile Ihrer Kette sich standardisieren, und können Ihre Investitionen entsprechend anpassen. Die Fragen unterscheiden sich: Wertkettenanalyse fragt „Wo schaffen wir heute Wert?", Wardley Mapping fragt „Wo wird Wert entstehen, und was sollten wir tun, bevor Wettbewerber das herausfinden?"
Können nicht-technische Teams Wardley Mapping nutzen?
Ja, obwohl die meisten Beispiele aus Technologie- und Betriebskontexten stammen. Geschäftseinheiten haben Wardley Maps für Supply-Chain-Strategie, Organisationsdesign und sogar regulatorische Reaktionen eingesetzt. Die Methode funktioniert überall dort, wo Sie einen Nutzerbedarf, eine Menge voneinander abhängiger Fähigkeiten und eine Frage über Investitionen haben.
Wie passt Wardley Mapping zu OKRs?
Sie ergänzen sich gut. Wardley Maps zeigen Ihnen, worauf Sie sich konzentrieren sollten. OKRs geben Ihnen einen Mechanismus, sich auf diesen Fokus zu verpflichten und den Fortschritt zu messen. Ein verbreitetes Muster: Führen Sie zu Beginn eines Planungszyklus eine Mapping-Sitzung durch, um die Evolutionsmaßnahmen mit dem höchsten Hebel zu identifizieren, und formulieren Sie dann OKRs rund um diese Erkenntnisse, statt auf die Prioritäten des Vorjahres zurückzufallen.
Strategietools sind am nützlichsten, wenn sie Sie zwingen, bei Dingen präzise zu sein, die Sie lieber vage lassen würden. Wardley Mapping tut genau das. Es fordert Sie auf, jede Komponente zu benennen, von der Ihr Unternehmen abhängt, zu entscheiden, wo jede auf einer Evolutionskurve steht, und Ihre Investitionsentscheidungen im Licht dieser Karte zu erklären. Diese Disziplin, regelmäßig angewandt, ist das, was Organisationen, die den nächsten Wandel erkennen, bevor er eintritt, von denen unterscheidet, die erst reagieren, nachdem Wettbewerber es bereits getan haben.
Für weitere Informationen zu den Tools, die mit einer Wardley Map zusammenarbeiten, lesen Sie die Wertkettenanalyse, Szenarioplanung, Build, Borrow oder Buy und wie der Flywheel Effect die Vorteile verstärkt, die eine Karte Ihnen aufzeigt.

Senior Operations & Growth Strategist
On this page
- Was ist Wardley Mapping?
- Die zwei Achsen: Wertschöpfungskette und Evolution
- Wardley Mapping vs. andere Strategietools
- So erstellen Sie eine Wardley Map
- Schritt 1: Nutzer und Bedarf identifizieren
- Schritt 2: Die Wertschöpfungskette abbilden
- Schritt 3: Komponenten auf der Evolutionsachse platzieren
- Schritt 4: Bewegung und Trägheit analysieren
- Schritt 5: Doctrine und Climatic Patterns anwenden
- Schritt 6: Strategische Maßnahmen festlegen
- Wardley Mapping in der Praxis
- Vorteile und Grenzen
- Häufig gestellte Fragen