BCG Matrix vs GE-McKinsey Matrix Compared
Turn this article into takeaways for your work.
Each assistant summarizes the article only for you and suggests best practices for your work.
The BCG matrix vs GE-McKinsey matrix debate comes down to speed versus nuance. Both tools help executives decide where to invest, hold, or divest across a business portfolio. But they answer that question in very different ways, and choosing the wrong one for your situation wastes time or, worse, produces a misleading recommendation.
What Is the Difference Between the BCG and GE-McKinsey Matrix?
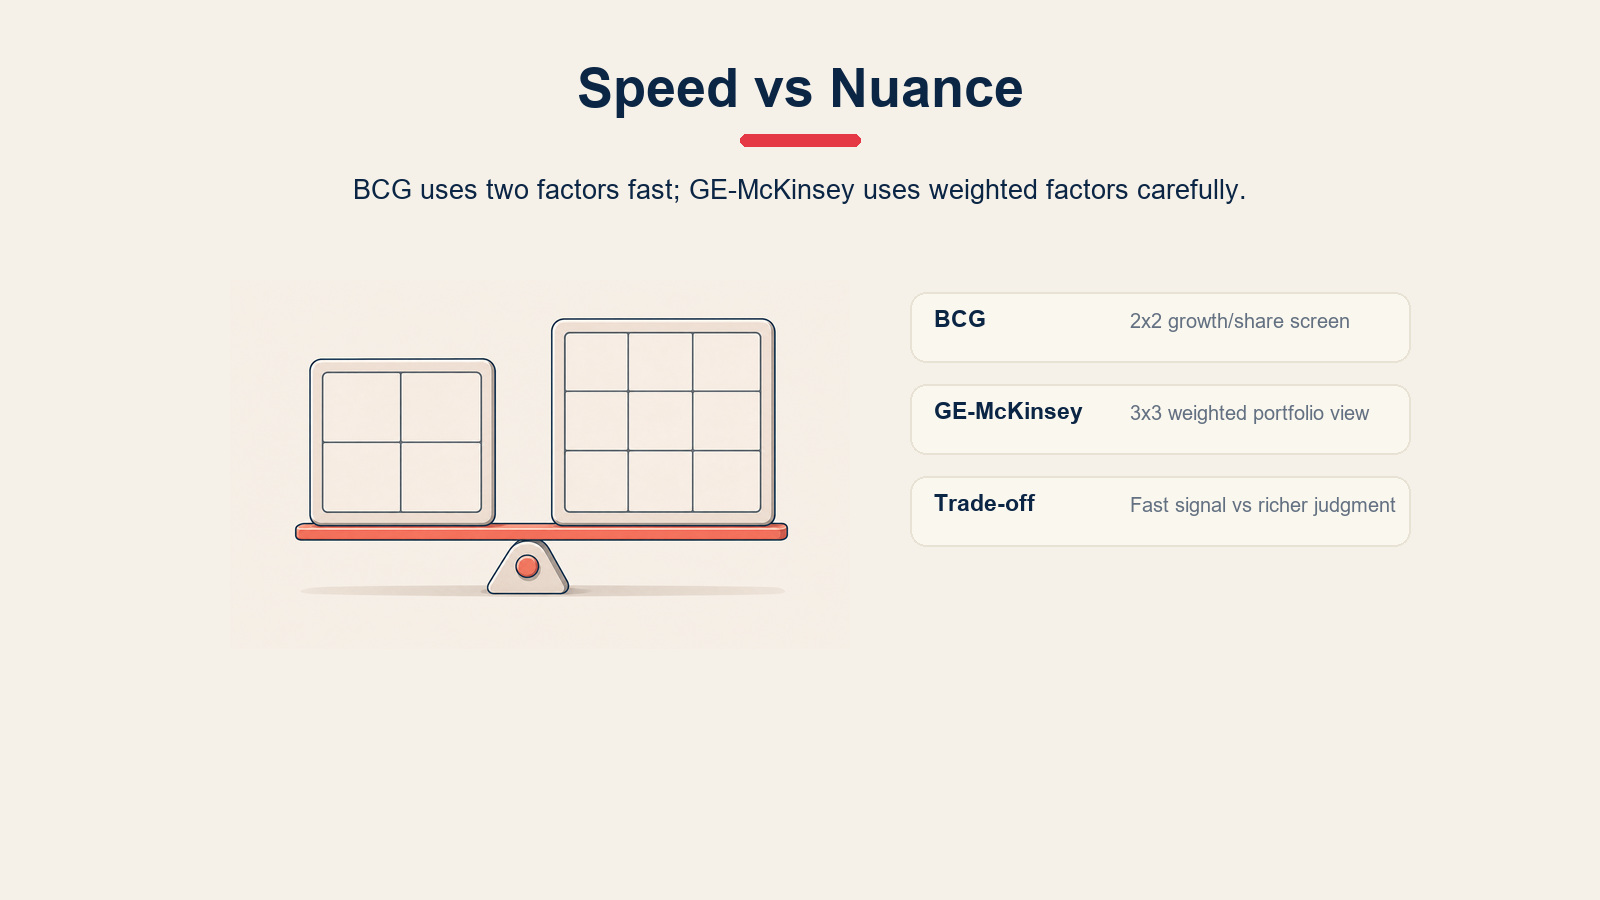
Both are portfolio-analysis frameworks used to allocate capital and resources across business units or product lines. The BCG matrix (developed by the Boston Consulting Group) uses a simple 2x2 grid with two axes: market growth rate and relative market share. It places each unit into one of four quadrants: Stars, Cash Cows, Question Marks, or Dogs. The GE-McKinsey matrix uses a 3x3 grid, scoring units on industry attractiveness and competitive strength, each built from multiple weighted factors. That richer structure produces finer distinctions but also demands more data and more judgment calls.
Key Facts
- The BCG matrix was created by Bruce Henderson at the Boston Consulting Group in 1970, making it one of the oldest formal portfolio-planning tools still in widespread use. (Source: BCG, 1970)
- The GE-McKinsey matrix was developed by McKinsey and Company for General Electric in the early 1970s as a direct response to the limitations of the BCG grid, specifically the need to capture more factors beyond growth and share. (Source: McKinsey, 1971)
- By the late 1970s, portfolio-planning frameworks were used by roughly half of all Fortune 500 companies, according to research cited in the Journal of Business Strategy (Haspeslagh, 1982).
- One-liner to keep handy: "BCG asks two questions fast; GE-McKinsey asks a dozen carefully."
What Is the BCG Matrix?
The BCG matrix is a two-dimensional grid that plots a business unit or product on market growth rate (vertical axis) versus relative market share (horizontal axis). Each axis is split at a threshold, creating four cells.
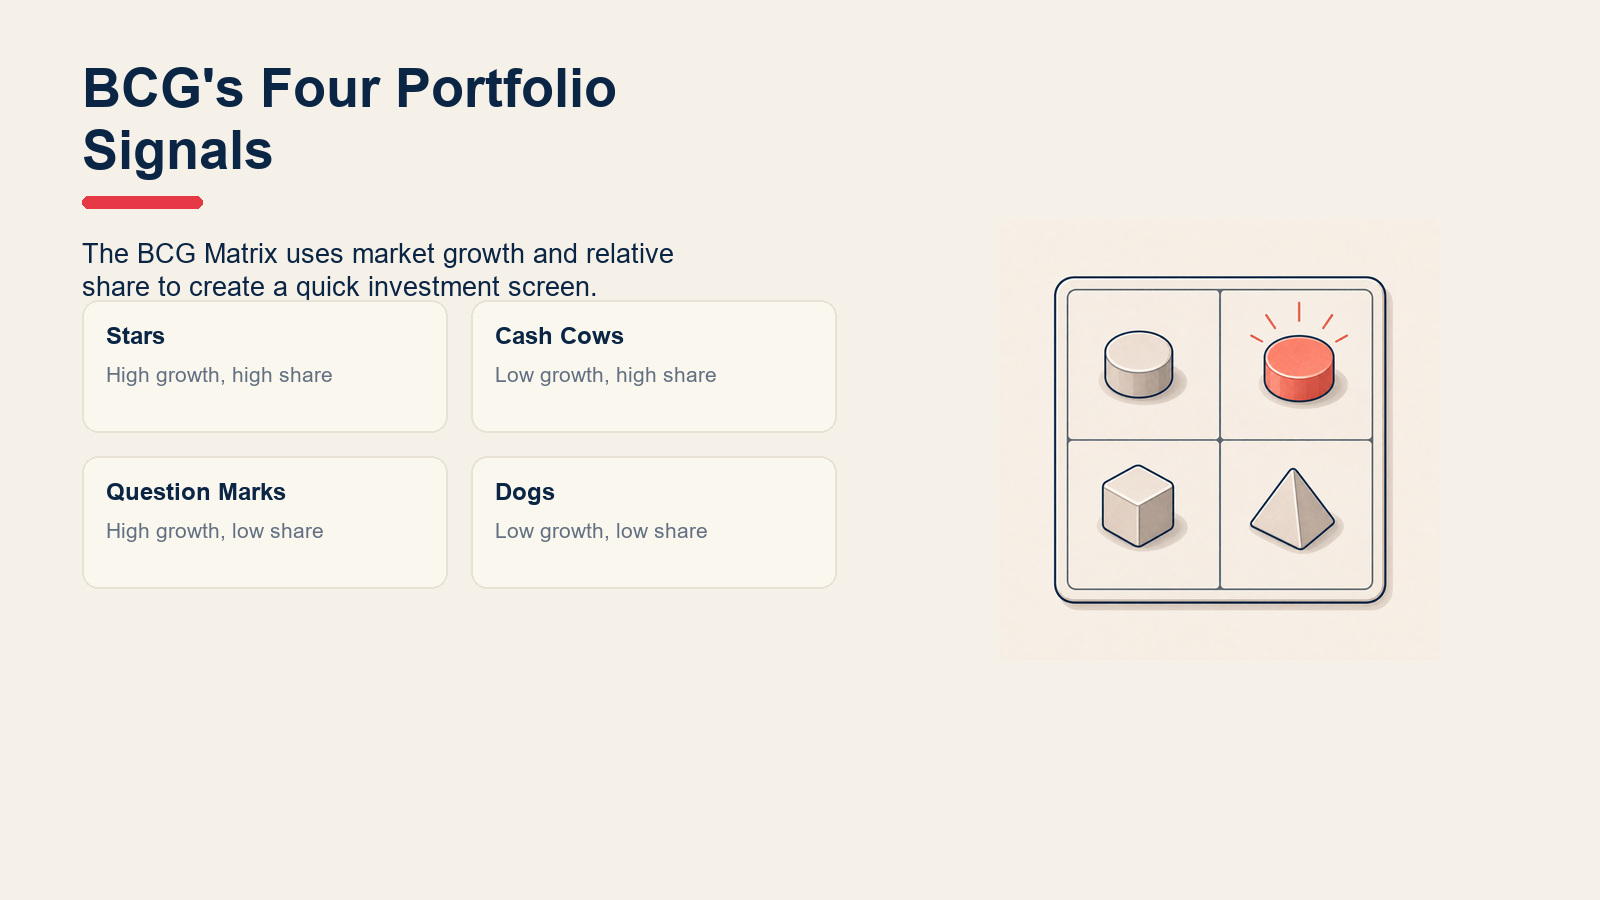
Stars (high growth, high share): units that lead growing markets. They consume cash to sustain growth but are expected to become Cash Cows as markets mature.
Cash Cows (low growth, high share): mature market leaders. They generate more cash than they consume, making them the portfolio's primary funding source.
Question Marks (high growth, low share): units in fast-growing markets but without dominant share. The decision is whether to invest to become a Star or exit.
Dogs (low growth, low share): units stuck in stagnant markets without competitive advantage. Classic candidates for divestiture, though some generate steady niche returns.
The BCG matrix is fast to run. You need two data points per unit: the market's growth rate and the unit's share relative to its largest competitor. That simplicity is its biggest asset and its biggest limitation.
What Is the GE-McKinsey Matrix?
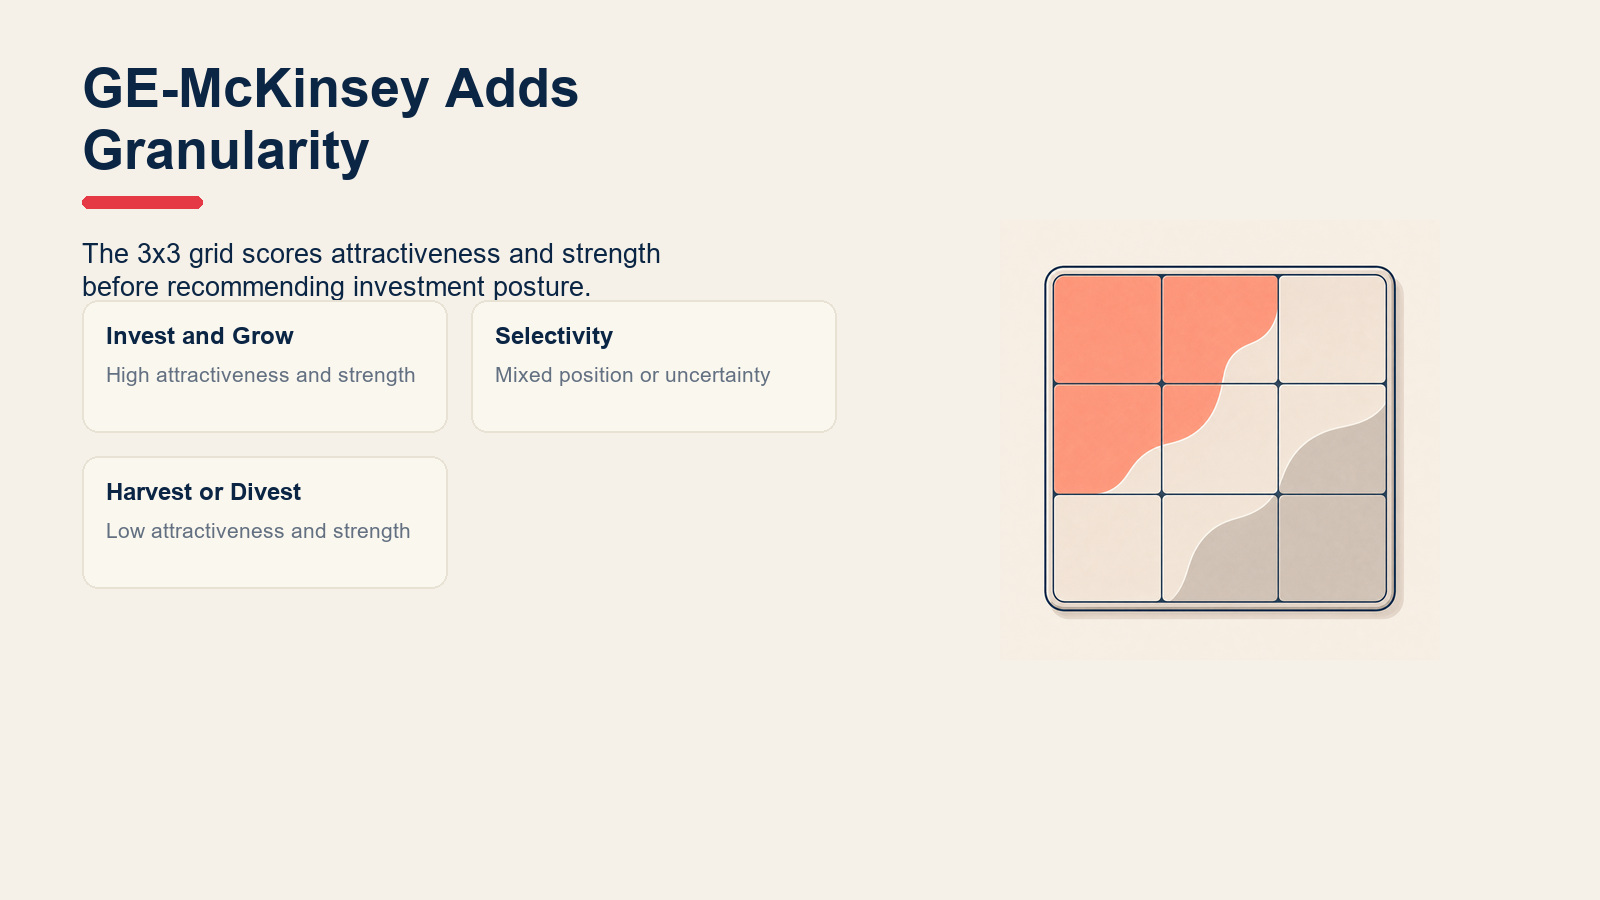
The GE-McKinsey matrix is a 3x3 grid that scores each business unit on two composite dimensions: industry attractiveness (vertical axis) and competitive strength (horizontal axis). Each dimension aggregates multiple factors.
Industry attractiveness factors typically include market size, growth rate, profit margins, competitive intensity, technology requirements, and environmental and regulatory factors. Competitive strength factors include market share, brand strength, production capacity, profit margins relative to competitors, and technological capability.
Each factor is assigned a weight, then scored from 1 to 5. The weighted average places each unit somewhere on the 3-point scale (low, medium, high) for each axis.
The 3x3 grid produces three strategic zones.
Invest and Grow (top-left cells, high attractiveness + high strength): commit resources, pursue growth aggressively.
Selectivity (middle diagonal cells, medium on at least one axis): invest selectively, improve specific weaknesses, or hold position.
Harvest or Divest (bottom-right cells, low attractiveness + low strength): manage for cash, then exit unless a clear path to improvement exists.
Because the scoring involves judgment, two teams can reach different placements for the same unit. That subjectivity is the GE-McKinsey matrix's most-cited weakness.
BCG vs GE-McKinsey: Side-by-Side Comparison
| Dimension | BCG Matrix | GE-McKinsey Matrix |
|---|---|---|
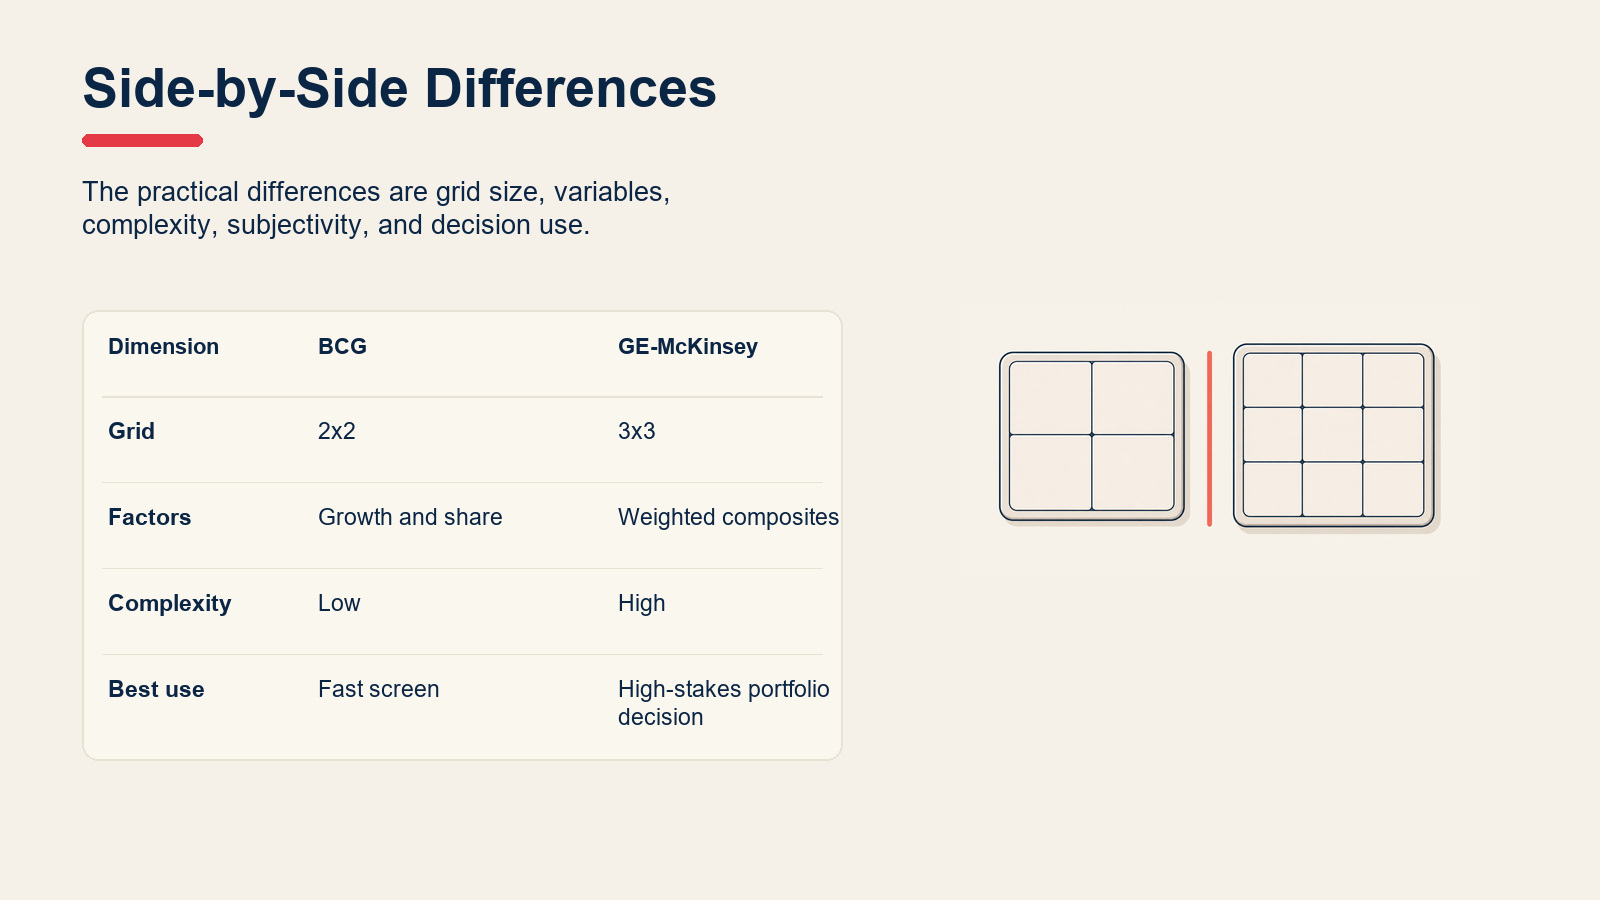
| Grid size | 2x2 (4 cells) | 3x3 (9 cells) |
| Vertical axis | Market growth rate | Industry attractiveness (composite) |
| Horizontal axis | Relative market share | Competitive strength (composite) |
| Number of factors | 2 (one per axis) | Many (typically 6-12 weighted factors per axis) |
| Complexity | Low | High |
| Subjectivity | Low (data-driven) | High (weights and scores are judgment-dependent) |
| Best for | Large portfolios needing fast screening; early-stage prioritization | Diversified conglomerates; decisions with significant capital at stake |
| Core limitation | Ignores profitability, brand strength, synergies, and many other variables | Factor weights can be manipulated; time-consuming to run |
| Output | Quadrant label with implied strategy | Zone position with prioritized investment guidance |
| Created by | Bruce Henderson, BCG, 1970 | McKinsey for General Electric, early 1970s |
When to Use Each Matrix
Use the BCG matrix when:
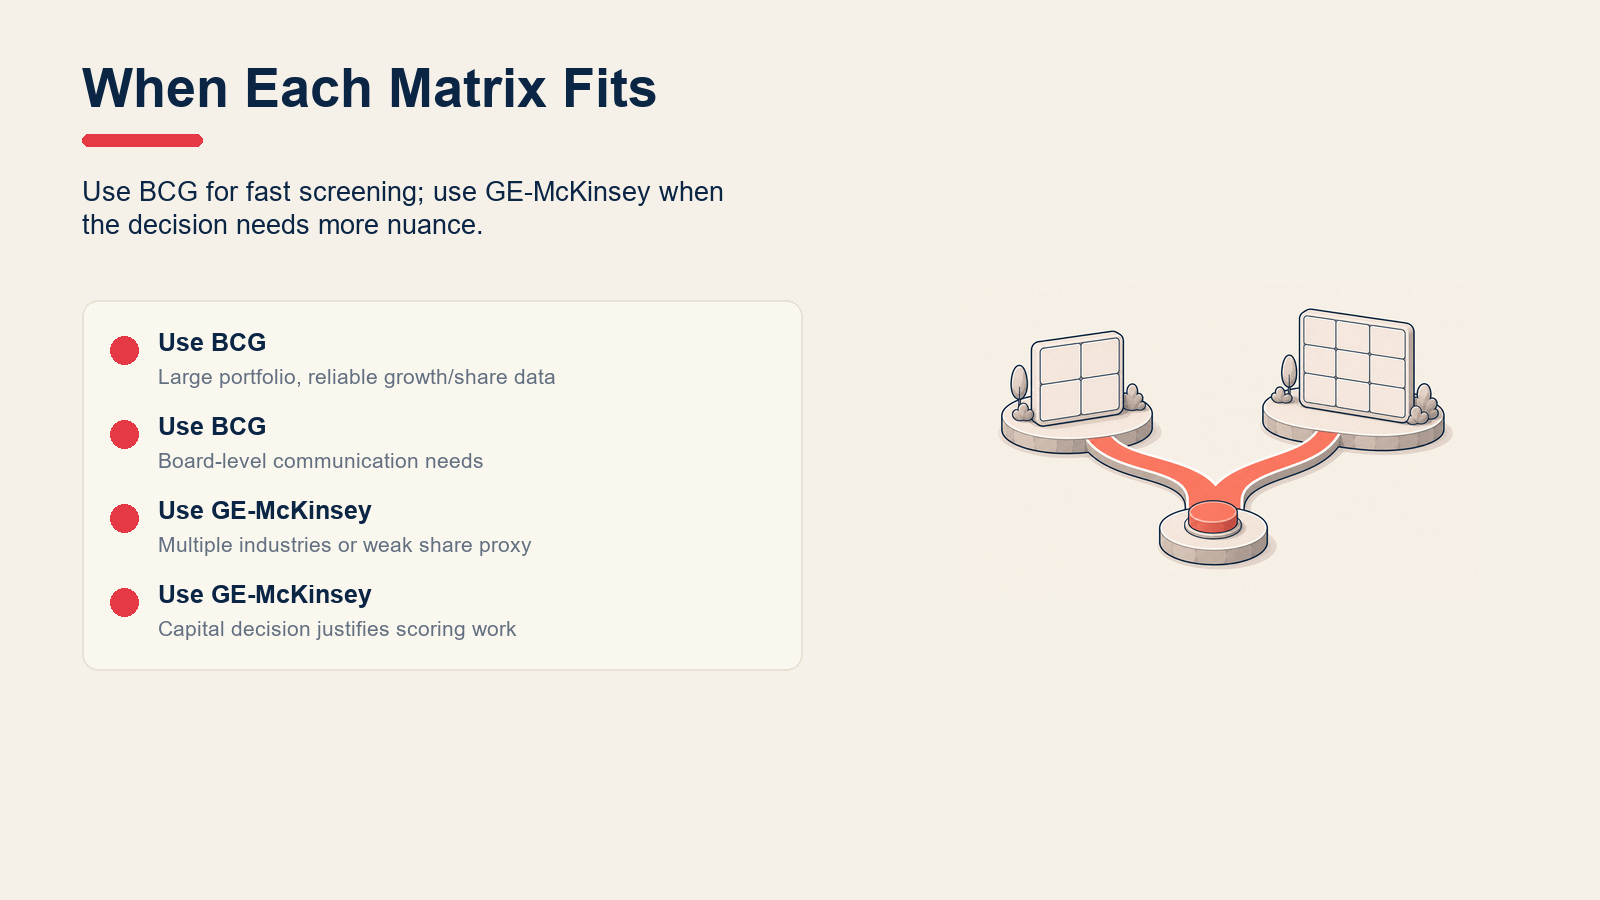
- You need a rapid first-pass screen of a large portfolio.
- Data on market growth and market share is readily available and reliable.
- The audience needs an easily communicated framework (board decks, investor presentations).
- You're working in a single industry where market share correlates strongly with profitability.
Use the GE-McKinsey matrix when:
- The portfolio spans multiple industries with very different attractiveness profiles.
- A decision has enough capital on the line to justify the additional scoring work.
- Market share alone is a poor proxy for competitive position (services, B2B, regulated industries).
- You need to surface nuance that a 2x2 grid would hide, such as a small unit in a highly attractive niche.
Many strategy teams run BCG first for breadth, then apply GE-McKinsey to the two or three units where BCG gives an ambiguous or contested signal.
How to Choose and Apply One
Step 1: Define your units of analysis
List every business unit, product line, or brand you want to evaluate. Confirm each has a defensible market definition, without that the axes on either matrix become meaningless. For the BCG matrix, calculate each unit's relative market share (your unit's share divided by the largest competitor's share). For GE-McKinsey, list the factors you'll use to score attractiveness and strength, and agree on weights before scoring begins.
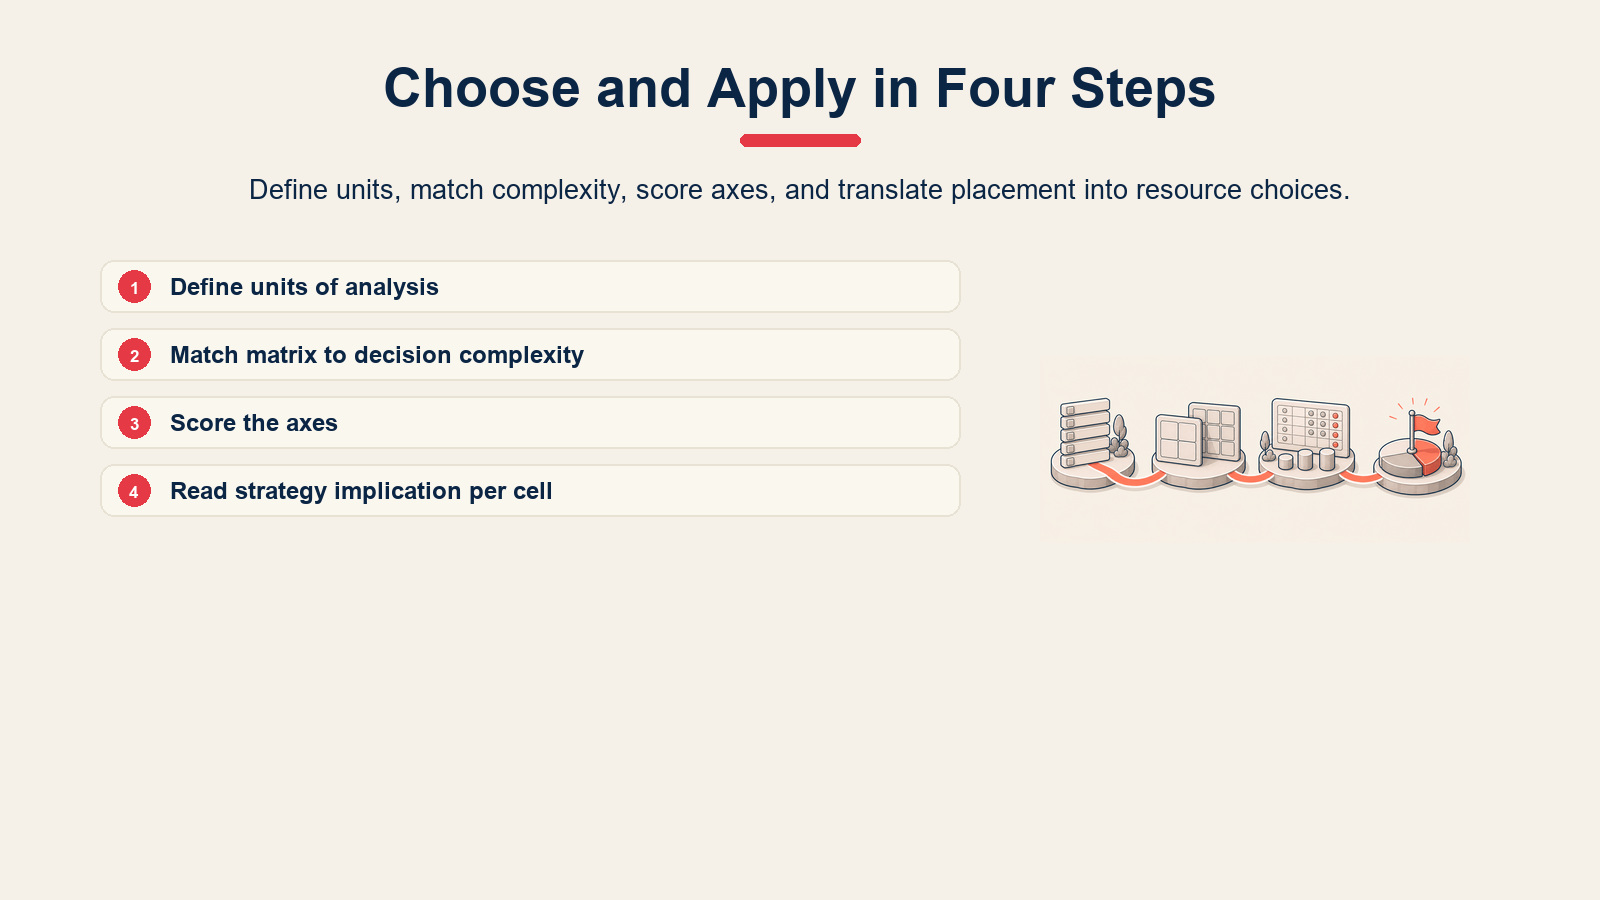
Step 2: Pick the matrix to match the decision's complexity
If you're doing a full portfolio review across a diversified conglomerate, default to GE-McKinsey. If you're prioritizing product investment in a single market, BCG is usually enough. When in doubt, start with BCG for the overview, then use competitive advantage analysis or Porter's Five Forces to deepen your read on the units that fall ambiguously near the center.
Step 3: Score the axes
For BCG: plot each unit on growth rate vs. relative market share. Draw the dividing lines at industry-average growth and 1.0 on relative share. For GE-McKinsey: score each factor for each unit, apply weights, compute the composite score, and place the unit on the 3x3 grid. Document your weights and scores so stakeholders can challenge assumptions rather than the conclusion.
Step 4: Read the strategy implication per cell
BCG cells carry implied strategies: invest in Stars, milk Cash Cows, decide fast on Question Marks, and exit Dogs unless there is a strategic reason to retain them. GE-McKinsey zones carry similar logic but with more gradation: units in the middle diagonal demand honest assessment of whether a path to the invest zone exists. Pair the matrix output with the Ansoff Matrix to make the growth options concrete.
Example
Suppose a consumer goods company has five product lines: premium coffee, private-label cereals, sparkling water, plant-based snacks, and a declining canned soup line.
BCG placements:
| Product | Market growth | Relative share | Quadrant |
|---|---|---|---|
| Premium coffee | High (12%) | High (1.4x leader) | Star |
| Plant-based snacks | High (18%) | Low (0.3x leader) | Question Mark |
| Sparkling water | Medium (6%) | High (1.1x leader) | Cash Cow (borderline) |
| Private-label cereals | Low (2%) | Medium (0.8x leader) | Dog (borderline) |
| Canned soup | Low (1%) | Low (0.5x leader) | Dog |
GE-McKinsey placements (abbreviated):
| Product | Industry attractiveness | Competitive strength | Zone |
|---|---|---|---|
| Premium coffee | High (4.2/5) | High (4.0/5) | Invest and Grow |
| Plant-based snacks | High (4.5/5) | Low (2.1/5) | Selectivity |
| Sparkling water | Medium (3.1/5) | Medium (3.4/5) | Selectivity |
| Private-label cereals | Medium (2.8/5) | Medium (2.9/5) | Selectivity (watch) |
| Canned soup | Low (1.8/5) | Low (2.0/5) | Harvest or Divest |
The GE-McKinsey analysis surfaces that sparkling water sits in Selectivity rather than as a clear Cash Cow, prompting a deeper look at whether the unit's competitive position is eroding. BCG alone would have suggested "hold and harvest," which might be the wrong call.
Common Mistakes
Treating BCG axes as the only drivers. Market share is a useful heuristic, not a complete picture of competitive position. A unit with low share in a fragmented market can be highly profitable. Always sense-check BCG outputs against actual margin and cash-flow data. Use SWOT analysis or a PESTEL analysis to verify context.
False precision in GE-McKinsey scoring. Because the matrix produces weighted scores to one or two decimal places, teams sometimes treat the outputs as more objective than they are. A score of 3.2 vs 3.4 on industry attractiveness is not statistically meaningful if the factors were scored by a single analyst. Build alignment on factor definitions and weights before scoring, not after.
Skipping the "so what" step. Both matrices produce a placement, not a decision. Quadrant or zone assignment is the start of the strategic conversation, not the end. Pair the output with a resource-allocation conversation that connects to financial targets.
Ignoring portfolio interdependencies. Neither matrix accounts for synergies between units, such as shared manufacturing, brand halo, or distribution network. A Dog that feeds customers to a Star may warrant retention even though the matrix says divest.
Frequently Asked Questions
Is GE-McKinsey better than BCG? Not categorically. GE-McKinsey captures more variables and produces finer-grained output, but that richness comes with more subjectivity and more work. For fast screening or single-industry portfolios, the BCG matrix is often the better choice. For multi-industry conglomerates making large capital allocation decisions, GE-McKinsey earns its complexity.
Who created the BCG matrix? Bruce Henderson, founder of the Boston Consulting Group, created the BCG matrix in 1970. It was built on the observation that experience-curve effects cause costs to fall predictably as cumulative production volume grows, making relative market share a meaningful proxy for cost competitiveness.
What are the two axes of the GE-McKinsey matrix? Industry attractiveness (vertical) and competitive strength (horizontal). Each axis is a composite score weighted across multiple factors, which distinguishes the tool from the BCG matrix's single-factor axes.
Can you use both matrices together? Yes, and many strategy teams do. A common approach is to use BCG for a broad portfolio screen, identify the units that fall in ambiguous or contested positions, and then apply the GE-McKinsey matrix specifically to those units for deeper analysis.
What replaced the BCG matrix? Nothing fully replaced it because simplicity remains valuable. Some teams have moved toward more holistic portfolio models that incorporate profitability, customer lifetime value, or options-based thinking, but BCG and GE-McKinsey remain the reference frameworks taught in business schools and used in boardroom discussions. Both appear alongside tools like the SWOT vs TOWS analysis and PESTEL vs SWOT in modern strategy toolkits.
The choice between BCG and GE-McKinsey ultimately reflects how much precision the decision demands. Start with the simpler tool, stress-test its outputs, and escalate to GE-McKinsey when the stakes or the complexity of the portfolio justify the additional effort.
Related Reading

Senior Operations & Growth Strategist
On this page
- What Is the Difference Between the BCG and GE-McKinsey Matrix?
- What Is the BCG Matrix?
- What Is the GE-McKinsey Matrix?
- BCG vs GE-McKinsey: Side-by-Side Comparison
- When to Use Each Matrix
- How to Choose and Apply One
- Step 1: Define your units of analysis
- Step 2: Pick the matrix to match the decision's complexity
- Step 3: Score the axes
- Step 4: Read the strategy implication per cell
- Example
- Common Mistakes
- Frequently Asked Questions
- Related Reading