Anomaly Agent: Detectando o Inesperado
Turn this article into takeaways for your work.
Each assistant summarizes the article only for you and suggests best practices for your work.
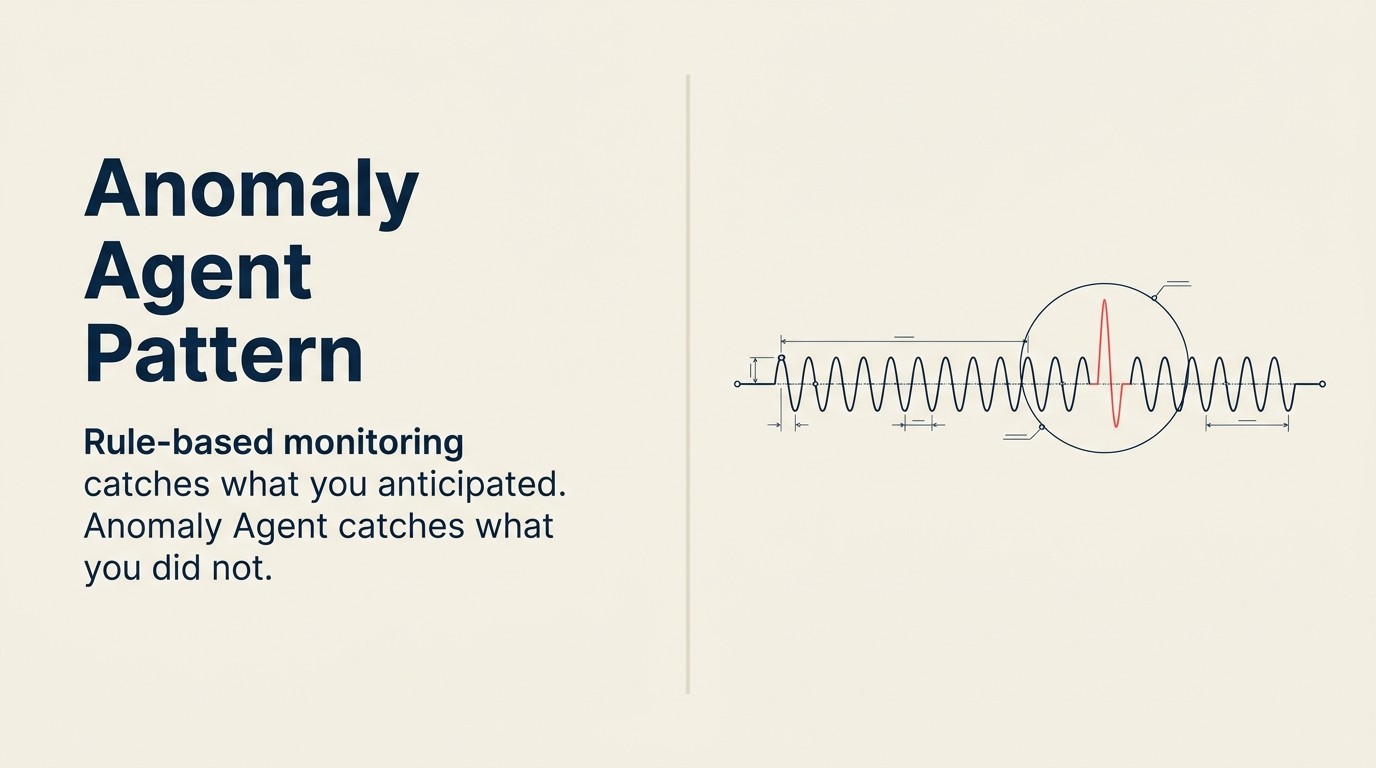
O monitoramento baseado em regras só captura o que você pensou em escrever uma regra.
Você pode escrever uma regra que sinaliza transações acima de R$ 50.000. Pode escrever uma regra que alerta quando as taxas de erro excedem 5%. Pode escrever uma regra que notifica um gestor quando um funcionário submete mais de R$ 2.500 em despesas com refeições em uma semana.
Mas você não pode escrever uma regra para cada vetor de fraude que ainda não foi inventado. Não pode escrever uma regra para a combinação específica de comportamentos que precedem o churn de um cliente: a frequência de login ligeiramente menor, a mudança do uso de funcionalidades centrais para periféricas, o ticket de suporte aberto no mês 11 de um contrato de 12 meses. Não pode escrever uma regra para a leitura de sensor de fabricação que está tecnicamente dentro das especificações, mas deriva em uma direção que historicamente precede falhas de equipamento.
Regras capturam violações conhecidas de limites conhecidos. Detecção de anomalias captura desvios de um baseline aprendido, incluindo desvios que nunca foram vistos antes, de causas que nunca foram nomeadas. Essa é a diferença entre encontrar fraudes que você antecipou e encontrar um novo vetor de fraude antes que ele custe as perdas do próximo trimestre.
O padrão Anomaly Agent é a forma como a AI monitora incógnitas desconhecidas.
A fórmula: Ingest, Analyze, Predict, Execute
Ingest (fluxo contínuo de dados) captura o fluxo contínuo de eventos que o sistema monitora. Pode ser um feed de transações financeiras, um stream de logs de aplicação, um feed de telemetria de sensores de um chão de fábrica, um log de eventos de engajamento de clientes, um log de acesso de usuários de um sistema de identidade. Ao contrário de padrões que processam documentos ou reuniões sob demanda, o Anomaly Agent executa continuamente contra dados em tempo real.
Analyze (estabelecer baseline) é onde o modelo constrói sua compreensão do "normal". Esta é a etapa mais importante e a mais subestimada. A etapa Analyze aprende o intervalo e a distribuição típicos de comportamento: quais valores de transação são normais para esta categoria de comerciante, qual taxa de erro é típica para este serviço neste horário do dia, qual padrão de submissão de despesas é normal para este funcionário dada sua função e frequência de viagens. O baseline não é um número único. É um modelo multidimensional de comportamento esperado ao longo do tempo, segmento e contexto.
Predict (sinalizar outliers) compara as observações atuais com o baseline estabelecido e atribui pontuações de anomalia. Esta é uma previsão estatística: dado tudo que o modelo sabe sobre o comportamento "normal" para esta entidade (usuário, sensor, conta, serviço), qual é a probabilidade desta observação? Uma transação que é 10x o valor normal, em uma geografia onde este titular de cartão nunca transaciona, usando um dispositivo que não está em seu histórico, pontua próximo ao topo. Uma transação que é 2x o normal de um comerciante frequente pontua baixo. Para o quadro completo de como o Predict funciona como uma capacidade ACE, veja Predict: como a AI prevê resultados de negócios.
Execute (alertar, bloquear, escalar, registrar) age com base na pontuação de anomalia. Anomalias de alta confiança e alta severidade podem acionar um bloqueio automático (prevenção de fraudes) ou um alerta para um engenheiro de plantão (monitoramento de infraestrutura). Sinalizações de média confiança vão para uma fila de revisão. Anomalias de baixa confiança são registradas para análise de padrões sem interromper o fluxo de trabalho. A ação Execute é calibrada para o custo de falsos positivos versus falsos negativos naquele caso de uso específico.
Key Facts: Impacto de Negócio da Detecção de Anomalias
- As perdas globais com fraudes ultrapassaram US$ 485 bilhões em 2023, com a detecção de anomalias baseada em AI creditada com a prevenção de um estimado 40-60% das fraudes de cartão não presente que sistemas baseados em regras perderam (LexisNexis True Cost of Fraud Study, 2024)
- Empresas de manufatura que usam detecção de anomalias baseada em sensores relatam redução de 20-40% nas taxas de refugo e defeitos, com os maiores ganhos em operações que dependiam anteriormente de controle de qualidade por amostragem (McKinsey Manufacturing AI Benchmark, 2024)
- Empresas SaaS que usam detecção de anomalias comportamentais para previsão de churn alcançam 60-75% de precisão em previsões de churn de 90 dias, permitindo que equipes de customer success intervenham 60-90 dias antes que um contrato esteja em risco (Gainsight Customer Success Benchmark, 2025)
Seis exemplos reais em profundidade
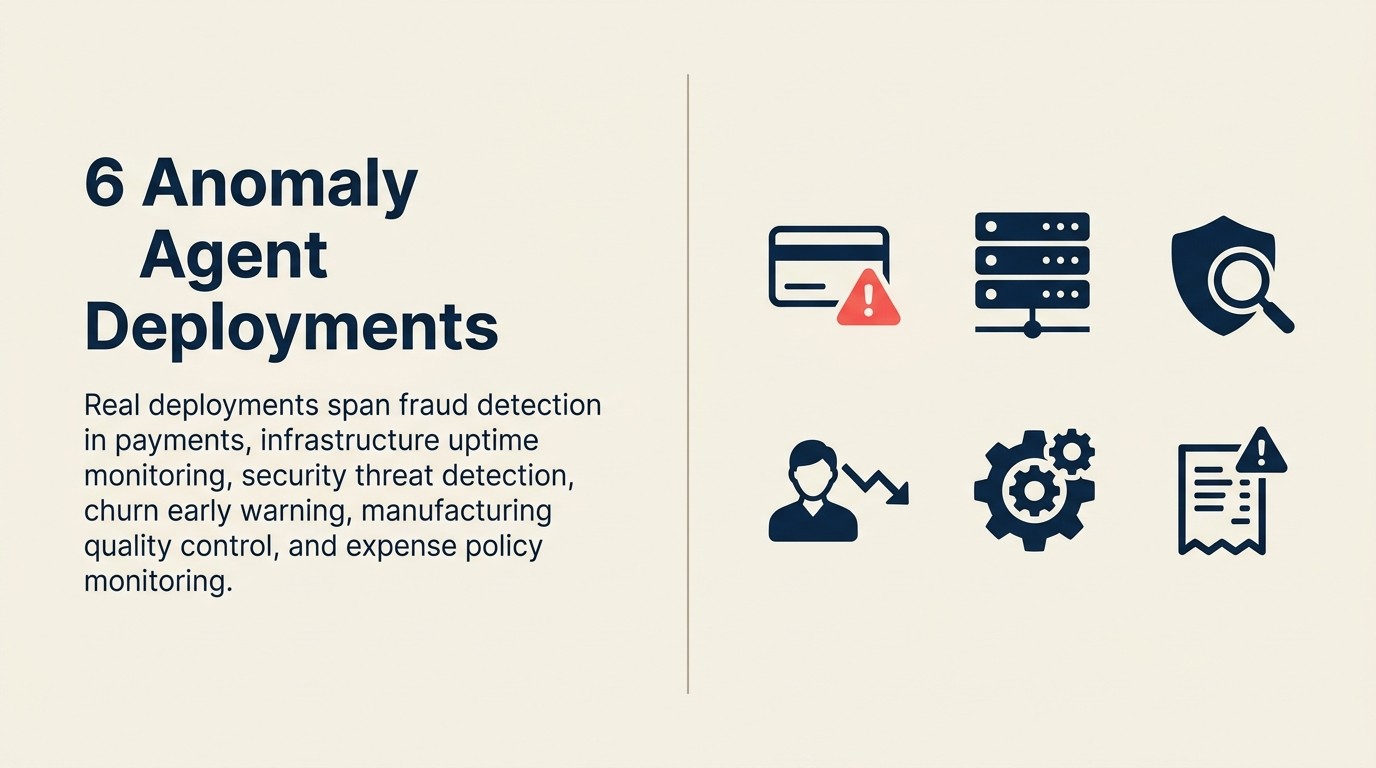
1. Detecção de fraudes em transações financeiras
Uma plataforma fintech processa 400.000 transações diariamente. A camada Ingest captura as características de cada transação em tempo real: valor, categoria do comerciante, localização geográfica, impressão digital do dispositivo, tempo desde a última transação e velocidade (quantas transações nos últimos 60 minutos). O baseline construído durante a fase Analyze sabe, por titular de cartão, como é o perfil típico de transações deles.
O Predict pontua cada transação em menos de 100 milissegundos. Uma transação que pontua acima do limite de alto risco aciona um bloqueio imediato e uma notificação push de verificação para o telefone do titular do cartão (Execute). Pontuações de anomalia médias acionam um declínio suave com um desafio 3D Secure. Pontuações baixas de anomalia passam.
O baseline deve incorporar sazonalidade temporal: os gastos de fim de ano parecem anômalos comparados a um baseline de dia de semana normal. Sem essa consciência de sazonalidade, você gera enormes falsos positivos na Black Friday.
Stripe Radar, Kount, Featurespace e Sardine executam versões desta arquitetura. A distinção entre fornecedores muitas vezes se resume à qualidade do baseline e à rapidez com que o modelo é atualizado quando o comportamento do titular do cartão muda legitimamente (mudança de cidade, novo emprego com um padrão de despesas diferente).
2. Monitoramento de infraestrutura e uptime
Uma empresa SaaS tem 47 microsserviços em duas regiões de nuvem. Alertas tradicionais baseados em limites disparam quando as taxas de erro excedem 5% ou a latência P99 excede 2 segundos. Mas algumas falhas são sutis: um serviço que normalmente roda em 120ms P99 deriva para 340ms ao longo de quatro horas antes que o impacto visível ao usuário comece. Nenhum limite dispara porque 340ms ainda está abaixo de 2 segundos. Mas o modelo de anomalia sinaliza a deriva.
A camada Ingest puxa streams de métricas do Datadog, CloudWatch ou Prometheus a cada 30 segundos. O Analyze constrói baselines por serviço, por hora do dia, por dia da semana. O Predict sinaliza desvios estatisticamente significativos desses baselines. Não "cruzou um limite" mas "isso está 4,2 desvios padrão do padrão típico de tarde de terça-feira para este serviço."
O Execute alerta o engenheiro de plantão com contexto: o que desviou, em quanto, desde quando, e quais outros serviços desviaram aproximadamente ao mesmo tempo (útil para correlação de causa raiz). Datadog, New Relic, Dynatrace e Chronosphere executam alertas baseados em anomalias como recurso primário.
3. Detecção de ameaças à segurança
A equipe de identidade de uma empresa monitora padrões de login e acesso a dados de 3.000 funcionários. A camada Ingest captura cada evento de autenticação, chamada de API, solicitação de exportação de dados e acesso a arquivos. O Analyze estabelece baselines comportamentais por usuário: horários típicos de login, dispositivos típicos, localizações geográficas típicas, padrões típicos de acesso a dados para sua função.
O Predict sinaliza desvios: um login de um país onde este funcionário nunca fez login, uma exportação de dados 50x maior que o volume diário normal, chamadas de API para sistemas que essa função de usuário tipicamente não acessa. O Execute encaminha eventos de alta anomalia para o centro de operações de segurança (SOC) imediatamente para investigação e opcionalmente aciona re-verificação MFA ou suspensão de sessão.
Esta é a arquitetura central por trás de ferramentas de detecção de ameaças baseadas em comportamento como Darktrace, detecção baseada em ML do Microsoft Sentinel e Okta ThreatInsight.
4. Aviso antecipado de churn
Uma empresa SaaS tem 800 clientes em contratos anuais. Os customer success managers estão distribuídos por 12-15 contas cada e não conseguem monitorar de perto a saúde de cada conta. Mas alguns clientes estão silenciosamente derivando para a não renovação.
A camada Ingest captura telemetria do produto: usuários ativos diários por conta, frequência de uso de funcionalidades, frequência de login, volume e sentimento de tickets de suporte, e engajamento com recursos no aplicativo. O Analyze constrói um baseline comportamental por segmento de cliente (tamanho da empresa, nível do produto, setor).
O Predict sinaliza contas mostrando diminuições anômalas no engajamento em relação ao seu próprio baseline histórico e a clientes similares no mesmo estágio do contrato. Uma conta que está a 60 dias da renovação com uma queda de 40% nos DAUs em relação à média de 3 meses, combinada com um ticket de suporte marcado como "questão de faturamento", pontua no topo da lista de risco de churn.
O Execute alerta o customer success manager com contexto: aqui está a conta, aqui está o que mudou, aqui está a intervenção recomendada. Gainsight, ChurnZero e Planhat executam este padrão. A qualidade do sinal depende muito da riqueza dos dados de telemetria do produto.
5. Controle de qualidade na fabricação
Um fabricante de componentes opera 12 linhas de produção, cada uma com mais de 20 sensores monitorando temperatura, pressão, vibração e dimensões de saída. O controle de qualidade tradicional é baseado em amostragem: um técnico mede uma unidade a cada 50 e rejeita o lote se estiver fora das especificações. Mas os defeitos muitas vezes aparecem nas leituras dos sensores antes de aparecerem nas dimensões de saída.
A camada Ingest puxa telemetria de sensores em intervalos de 1 segundo de cada linha de produção. O Analyze constrói um baseline para cada sensor em cada linha em condições normais de operação: não apenas limites, mas padrões de correlação esperados entre sensores (por exemplo, quando a pressão sobe, a temperatura segue dentro de um determinado intervalo). O Predict sinaliza quando o padrão de correlação do sensor se deteriora ou quando leituras individuais de sensores derivam para fora de seu envelope normal de maneiras que historicamente precedem defeitos de saída.
O Execute alerta o supervisor de linha com o desvio específico do sensor e o padrão histórico que ele se assemelha, para que a manutenção possa intervir antes que o defeito produza refugo. Rockwell Automation, Sight Machine e AWS Lookout for Equipment fornecem esta arquitetura.
6. Monitoramento de políticas de despesas
Um controller financeiro em uma empresa de 500 pessoas revisa 2.500 relatórios de despesas mensalmente. A revisão humana captura violações óbvias. Mas o abuso sistemático de políticas muitas vezes parece inócuo reivindicação por reivindicação e só se torna visível como um padrão.
A camada Ingest ingere cada submissão de despesa com metadados: funcionário, valor, comerciante, categoria, data e imagem do recibo. O Analyze constrói baselines por funcionário ao longo do tempo: o que é normal para o papel desta pessoa, sua frequência de viagens, sua equipe e seus colegas comparáveis.
O Predict sinaliza desvios: um funcionário cujas despesas com refeições foram consistentemente R$ 75-200 por reivindicação agora submetendo reivindicações de R$ 450 seis vezes em um mês, sempre às sextas-feiras, sempre no mesmo restaurante (potencial padrão de refeição pessoal). Ou um funcionário que nunca submeteu despesas de hotel que de repente tem cinco noites de hotel em uma cidade onde nenhuma reunião de equipe ocorreu.
O Execute encaminha reivindicações sinalizadas para a fila de revisão da equipe financeira com o contexto da anomalia. Ramp Intelligence, detecção de anomalias do Expensify e análises do SAP Concur executam variantes deste padrão.
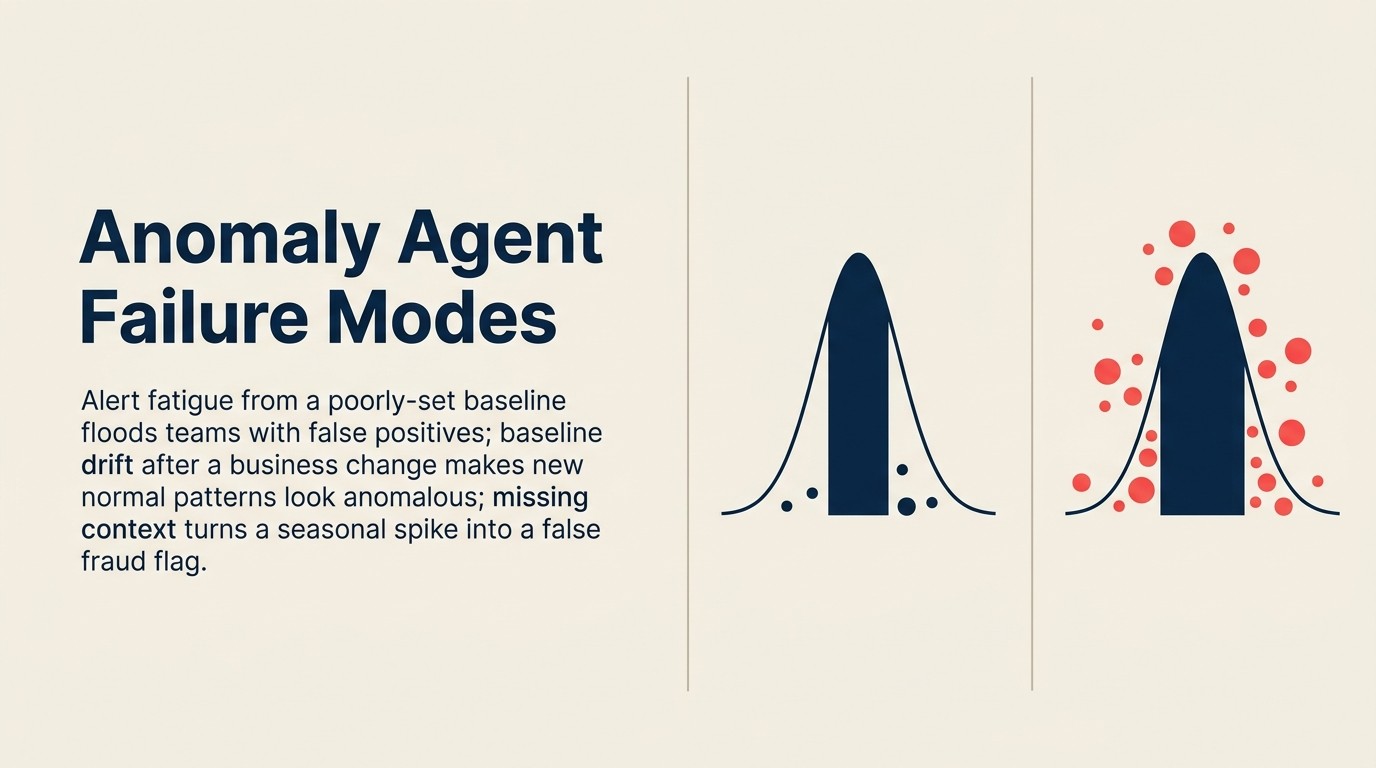
Modos de falha: o que quebra a detecção de anomalias
| Modo de falha | Causa raiz | Mitigação |
|---|---|---|
| Dados insuficientes de baseline | Modelo implantado após apenas 2-4 semanas de dados; sinaliza comportamento legítimo como anômalo porque o "normal" não está estabelecido | Exigir mínimo de 60-90 dias de dados para um baseline significativo. Executar em modo "apenas observar" pelos primeiros 30 dias (sem alertas, apenas registro) para auditar a taxa de falsos positivos antes de entrar em operação. |
| Fadiga de alertas | Muitos alertas de baixa qualidade sobrecarregam a equipe de revisão; os humanos param de agir sobre eles | Ajustar o limite de alerta para que menos de 15% dos alertas sejam falsos positivos. Uma fila de revisão que dispara 200 alertas por dia e 180 são falsos é um sistema em que ninguém confia ou trabalha. |
| Cegueira sazonal | Modelo treinado em 3 meses de dados de verão sinaliza padrões normais de fim de ano como anomalias | Garantir que os dados de baseline cubram pelo menos um ciclo sazonal completo. Para negócios com forte sazonalidade (varejo, impostos, viagens), 18 meses é melhor que 12. |
| Adaptação adversarial | Fraudadores sondam o limite de detecção e aprendem a ficar logo abaixo dos limites de alerta | Combinar detecção de anomalias com detecção baseada em regras (não substituir regras completamente). Atualizar o modelo quando novos padrões de fraude forem identificados. Usar características baseadas em velocidade (muitas pequenas anomalias que individualmente não acionam, mas coletivamente são um sinal). |
| Cegueira a mudanças de negócios | Empresa adquire uma nova linha de negócios; o modelo sinaliza todas as novas transações desse segmento como anômalas | Tratar grandes mudanças de negócios (aquisição, nova linha de produtos, entrada em novo mercado) como eventos de redefinição de baseline. Planejar períodos de revisão manual após mudanças operacionais significativas. |
| Sobreajuste a padrões históricos | O modelo é tão sensível ao comportamento estabelecido que mudanças legítimas de comportamento (nova cidade, promoção, mudança de produto) acionam alertas | Incorporar loops de feedback do usuário. Quando um revisor humano marca um alerta como "mudança legítima," esse sinal deve atualizar o baseline, não apenas descartar o alerta. |
A fadiga de alertas merece ênfase especial porque é o modo de falha que silenciosamente destrói o valor do programa. Um sistema de detecção de anomalias que dispara 300 alertas por dia com uma taxa de 90% de falsos positivos produzirá, dentro de 60 dias, uma equipe que para de olhar para a fila.
Equipes de centro de operações de segurança (SOC) que experimentam fadiga de alertas perdem em média 28% dos incidentes genuínos por mês devido à dessensibilização, de acordo com o IBM's Cost of a Data Breach Report (2024). Um programa de detecção de anomalias com baixa precisão não apenas desperdiça o tempo dos revisores. Ele ativamente reduz a postura de segurança da organização. A pesquisa da McKinsey sobre governança de AI agêntica conclui que a maioria dos incidentes de risco de AI resulta de sistemas automatizados agindo sem revisão humana adequada, que é exatamente o modo de falha que a detecção de anomalias mal ajustada aciona em escala. O único parâmetro mais importante em qualquer implantação de detecção de anomalias não é a sensibilidade de detecção. É a precisão dos alertas que chegam aos revisores humanos. O gradiente de risco entre os padrões de AI explica onde o Anomaly Agent se situa quando o Execute inclui ações de bloqueio automático.
A Doutrina do Baseline em Primeiro Lugar
Um Anomaly Agent é tão preciso quanto o baseline que aprendeu. Antes de qualquer alerta disparar, antes de qualquer limite ser definido, o sistema precisa de um mínimo de 60 a 90 dias de dados operacionais representativos e limpos para definir o que "normal" significa para cada entidade que monitora. Implantar um Anomaly Agent em um baseline mais curto que isso produz um de dois modos de falha: um sistema hipersensível que sinaliza comportamento legítimo como anômalo, sobrecarregando a equipe de revisão com falsos positivos, ou um sistema sub-sensível que perde anomalias reais porque o baseline foi construído durante um período atípico. A Doutrina do Baseline em Primeiro Lugar requer tratar a construção do baseline como um projeto de seis semanas antes que o primeiro alerta entre em operação, e tratar grandes mudanças de negócios (aquisições, novas linhas de produtos, novas geografias) como eventos de redefinição de baseline, não como casos extremos.
O baseline é o modelo
Isso merece sua própria seção porque é o aspecto mais subestimado de implantar o padrão Anomaly Agent.
O baseline não é um limite que você define. É um modelo que você aprende. E a qualidade desse baseline aprendido determina tudo que vem a seguir. Técnicas de detecção de anomalias supervisionadas requerem dados "normais" e "anormais" rotulados; técnicas não supervisionadas constroem modelos de comportamento normal a partir de dados não rotulados e sinalizam outliers estatísticos. Ambas as abordagens são tão boas quanto os dados de treinamento em que se baseiam. É por isso que o NIST's AI Risk Management Framework trata a qualidade e integridade dos dados como um requisito fundamental de governança, não uma reflexão tardia. Se você treinar o baseline em dados atípicos (um período pós-aquisição, uma semana de lançamento de produto, um surto de fraude), você obtém uma definição distorcida de "normal" que vai disparar incorretamente por meses.
Antes da implantação, audite seus dados de baseline em três aspectos:
Cobertura. O período de baseline cobre todos os padrões comportamentais que você verá em produção? Isso significa pelo menos um ciclo sazonal completo para sistemas voltados ao consumidor, pelo menos 90 dias para a maioria das aplicações de negócios, e pelo menos 12 meses para qualquer sistema com forte periodicidade anual (impostos, acadêmico, varejo).
Representatividade. O período de baseline foi típico? Se coincidiu com um evento operacional importante (aquisição, migração de sistema, incidente de segurança), exclua esses períodos ou reduza seu peso.
Completude. Existem lacunas nos dados de baseline? Um sensor que ficou offline por duas semanas durante o período de baseline produz um buraco no entendimento do modelo sobre o comportamento normal daquele sensor. Essas lacunas se tornam fontes de falsos positivos.
As equipes que acertam na detecção de anomalias tratam a construção do baseline como um projeto de seis semanas, não como uma etapa de configuração.
Quando o Anomaly Agent funciona (e quando não funciona)
Funciona bem quando:
- Você tem dados históricos suficientes e limpos para um baseline significativo. A regra prática: pelo menos 90 dias, idealmente um ciclo sazonal completo.
- O volume de eventos é alto demais para revisão humana. A detecção de anomalias compensa quando você está monitorando milhares ou milhões de eventos por dia. Para 50 transações por dia, um revisor humano é mais rápido e mais preciso.
- Os falsos positivos podem ser absorvidos sem danos operacionais. Sinalizar uma transação legítima para revisão é inconveniente. Bloquear uma transação legítima em escala é um problema de negócios. Conheça sua tolerância a falsos positivos antes de definir limites.
- O sinal de anomalia é razoavelmente distinto do ruído. Sinais sutis em dados ruidosos requerem modelos mais sofisticados e mais dados. Alguns ambientes são simplesmente muito ruidosos para uma detecção de anomalias útil no nível atual de qualidade dos dados.
vs. Scoring and Routing: Scoring and Routing atribui prioridade dentro de categorias conhecidas. Um lead é pontuado com base em características que mapeiam padrões de conversão conhecidos. O Anomaly Agent captura itens que não se encaixam em nenhum padrão conhecido. Se você precisa detectar vetores de fraude que nunca viu antes, o Anomaly Agent é a ferramenta certa. Se você precisa encaminhar tipos de leads conhecidos para o representante certo, o Scoring and Routing é melhor.
vs. Document Review: O Document Review audita para conformidade com padrões e regras conhecidos. Ele verifica se uma cláusula está presente. O Anomaly Agent captura violações que ainda não foram codificadas como regras: o novo padrão de despesas, o novo vetor de fraude. Eles são frequentemente complementares: Document Review para requisitos de conformidade conhecidos, Anomaly Agent para violações emergentes.
vs. Autonomous Agent: O Anomaly Agent detecta e alerta. Um Autonomous Agent detecta, decide e toma ação em múltiplas etapas. Se o objetivo é detectar fraude e imediatamente registrar um relatório, notificar o cliente, reverter a cobrança e atualizar o modelo de risco, isso é um Autonomous Agent construído sobre detecção de anomalias. Comece com a detecção primeiro antes de construir a resposta autônoma.
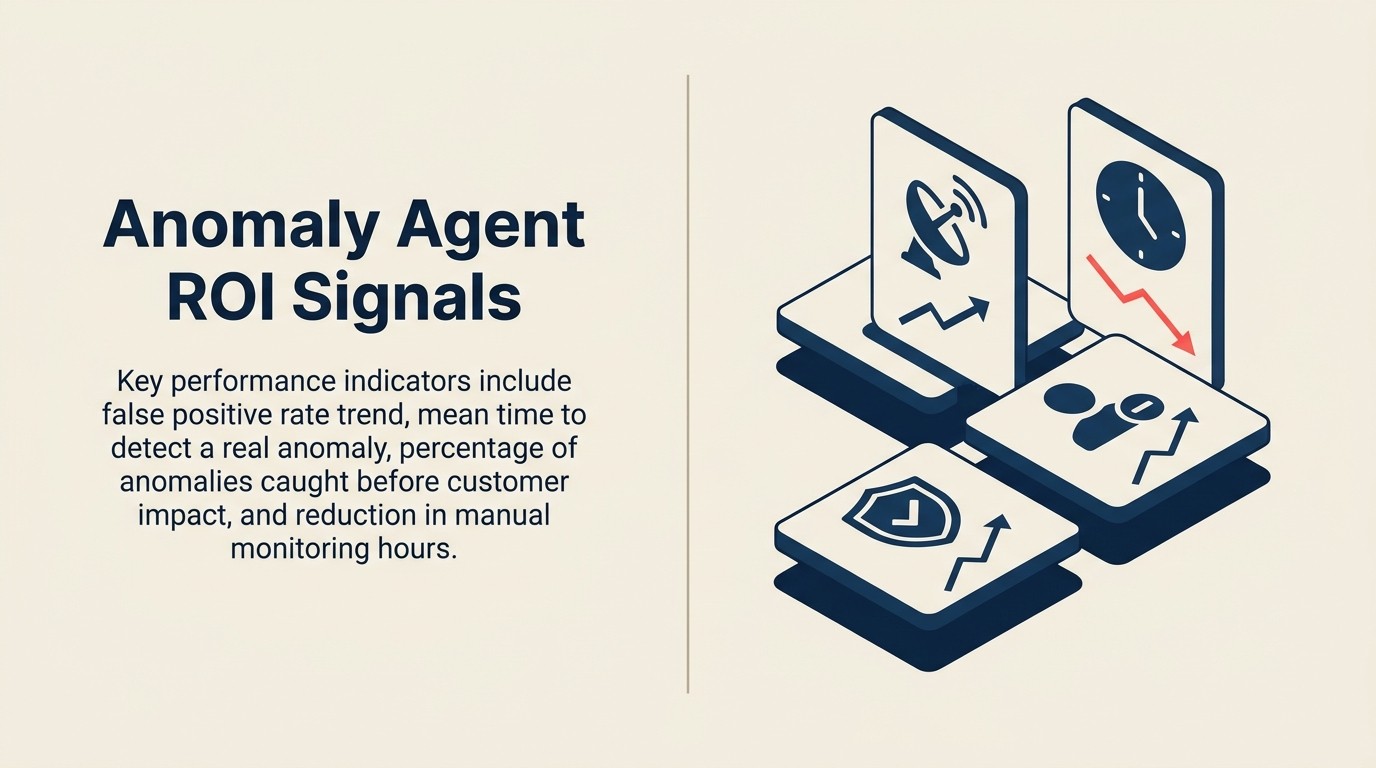
Sinais de ROI: medindo o impacto
| Métrica | O que mede | Benchmark alvo |
|---|---|---|
| Taxa de conversão de alerta para incidente | Qual porcentagem de anomalias sinalizadas são incidentes genuínos | Alvo >40% para a maioria dos casos de uso. Abaixo de 20% sugere problemas de calibração de limite. |
| Taxa de falsos positivos | Alertas que se revelaram comportamento legítimo | Alvo <25% para filas de revisão; <5% para execução de bloqueio automático |
| Tempo médio de detecção (MTTD) | Com que rapidez a anomalia é sinalizada após começar | Depende do domínio: fraude: <5 segundos; infraestrutura: <5 minutos; churn: dentro de 24 horas do surgimento do sinal |
| Perdas de fraude prevenidas | Valor em reais de transações bloqueadas antes de concluir | Requer metodologia de comparação antes/depois ou grupo de controle |
| Taxa de defeitos de fabricação | Taxa de refugo ou defeitos antes e depois da detecção de anomalias | Tipicamente redução de 20-40% nas taxas de defeitos em aplicações de manufatura bem implementadas |
| Precisão da previsão de churn | Das contas sinalizadas como alto risco de churn, qual porcentagem realmente cancelou | Rastrear ao longo de 90 dias. Modelos de churn bem calibrados atingem 60-75% de precisão. |
Governança: quem é dono do programa de anomalias
A detecção de anomalias não é um sistema de configurar e esquecer. Ela requer governança ativa para permanecer útil.
Quem revisa as anomalias sinalizadas? Defina isso claramente antes da implantação. Alertas de fraude vão para a equipe de operações de fraude. Anomalias de infraestrutura vão para a rotação de plantão. Anomalias de despesas vão para o controller financeiro. Alertas de churn vão para a equipe de customer success. Sem um proprietário claro por tipo de alerta, os alertas se acumulam em uma fila compartilhada que ninguém monitora.
Qual é o SLA de resposta? Diferentes tipos de anomalias têm perfis de urgência diferentes. Uma possível violação de segurança justifica uma resposta em 15 minutos. Um cliente mostrando sinais de churn justifica uma resposta dentro de 24 horas. Uma deriva de sensor de fabricação justifica uma resposta dentro de 2 horas. Defina esses SLAs e rastreie a conformidade.
Como o baseline é atualizado? A evolução normal dos negócios (expansão para novas geografias, novas linhas de produtos, mudanças sazonais no comportamento do cliente) muda a definição de "normal." Incorpore uma revisão trimestral do baseline ao programa. Quando o negócio muda significativamente, planeje um período controlado de atualização do baseline.
O que acontece quando um humano substitui? Quando um revisor marca um alerta como "legítimo" ou "não é fraude," esse sinal deve ser retroalimentado ao modelo. Sistemas que não incorporam feedback derivam para taxas crescentes de falsos positivos ao longo do tempo à medida que o negócio evolui para além do baseline original. Veja prontidão de dados: o pré-requisito que a maioria dos projetos de AI pula para como a qualidade dos dados de baseline define o teto do que o Anomaly Agent pode fazer.
Rework Analysis: As equipes que implantam a detecção de anomalias com sucesso tratam a qualidade do baseline como um marco de lançamento de produto, não um detalhe técnico. Elas passam seis semanas construindo o baseline antes de o primeiro alerta disparar, auditam os dados de baseline em busca de completude e representatividade, executam um período de observação de 30 dias para medir taxas de falsos positivos antes de entrar em operação, e estabelecem um processo de revisão trimestral do baseline. As equipes que falham tratam o baseline como uma configuração padrão e entram em operação em duas semanas. Dentro de 90 dias, estão lidando com fadiga de alertas de um sistema mal ajustado e, dentro de seis meses, a fila de revisão está vazia (ninguém trabalhando nela) ou desabilitada (muitos falsos positivos para justificar a sobrecarga). A tecnologia de detecção de anomalias é a mesma em ambos os casos. A disciplina em torno da construção do baseline é o que separa programas que funcionam por anos dos que são desligados após o primeiro trimestre ruim.
Perguntas Frequentes
O que é o padrão de AI Anomaly Agent?
O Anomaly Agent é um padrão de AI que monitora fluxos contínuos de dados em busca de desvios estatísticos de um baseline aprendido, depois alerta, bloqueia ou escala com base na severidade da anomalia. A fórmula é: Ingest (fluxo contínuo de dados), Analyze (estabelecer baseline comportamental), Predict (sinalizar outliers), Execute (alertar, bloquear ou escalar). Difere do monitoramento baseado em regras porque pode detectar padrões novos para os quais nenhuma regra foi escrita.
O que é a Doutrina do Baseline em Primeiro Lugar?
A Doutrina do Baseline em Primeiro Lugar afirma que uma implantação do Anomaly Agent deve construir um mínimo de 60 a 90 dias de dados de baseline representativos antes que qualquer alerta entre em operação. Implantar em um baseline mais curto produz hipersensibilidade (sinalizando comportamento legítimo como anômalo) ou sub-sensibilidade (perdendo anomalias reais porque o baseline foi construído durante um período atípico). Grandes mudanças de negócios, incluindo aquisições, novas linhas de produtos e novas geografias, são tratadas como eventos de redefinição de baseline que requerem um novo ciclo de construção de baseline.
Como o Anomaly Agent é diferente do Scoring and Routing?
O Scoring and Routing atribui prioridade dentro de categorias conhecidas comparando registros recebidos com padrões históricos de resultado. O Anomaly Agent captura itens que não se encaixam em nenhum padrão esperado, medindo desvios de um baseline comportamental. Use o Scoring and Routing quando precisar priorizar itens dentro de categorias familiares (leads, tickets, candidaturas). Use o Anomaly Agent quando precisar detectar padrões novos que você não antecipou, como novos vetores de fraude ou comportamento de churn sem precedentes.
O que causa a fadiga de alertas na detecção de anomalias e como você a corrige?
A fadiga de alertas ocorre quando a taxa de falsos positivos é muito alta. Um sistema disparando 300 alertas por dia com 90% de taxa de falsos positivos produz uma equipe de revisão que para de trabalhar na fila dentro de 60 dias. A pesquisa da IBM descobriu que equipes de SOC que experimentam fadiga de alertas perdem 28% dos incidentes genuínos por mês devido à dessensibilização. A solução é ajustar a precisão: definir limites para que menos de 25% dos alertas da fila de revisão sejam falsos positivos, e abaixo de 5% para execução de bloqueio automático. Execute em modo de observação por 30 dias antes de entrar em operação para medir e ajustar isso antes que os alertas tenham consequências.
Quais dados você precisa antes de implantar um Anomaly Agent?
Você precisa de no mínimo 60 a 90 dias de dados operacionais limpos e representativos cobrindo todos os padrões comportamentais que o sistema monitorará em produção. Para sistemas voltados ao consumidor com sazonalidade, pelo menos um ciclo sazonal completo (12 meses) é necessário. Os dados de baseline devem ser auditados para cobertura (todos os padrões comportamentais presentes), representatividade (nenhum período atípico como aquisições ou surtos de fraude), e completude (sem lacunas nos dados que criem buracos no entendimento do modelo sobre o comportamento normal).
Qual ROI você pode esperar da detecção de anomalias?
Prevenção de fraudes: a detecção de anomalias baseada em AI previne um estimado 40-60% das fraudes de cartão não presente que sistemas baseados em regras perdem (LexisNexis, 2024). Manufatura: redução de 20-40% nas taxas de defeitos versus controle de qualidade baseado em amostragem (McKinsey, 2024). Previsão de churn: 60-75% de precisão em previsões de churn de 90 dias, permitindo intervenção 60-90 dias antes do risco de contrato (Gainsight, 2025). O ROI depende muito da qualidade do baseline e de ter uma equipe atribuída para trabalhar a fila de revisão.
Saiba mais
- Scoring and Routing: Triagem de AI em Escala
- Requisitos de Governança por Padrão de AI
- O Gradiente de Risco entre os Padrões de AI
- Predict: Como a AI Prevê Resultados de Negócios
- Prontidão de Dados: O Pré-requisito que a Maioria dos Projetos de AI Pula
- O Que É um Padrão de AI? O Bloco de Construção da AI para Negócios

Co-Founder, Rework.com
On this page
- A fórmula: Ingest, Analyze, Predict, Execute
- Seis exemplos reais em profundidade
- 1. Detecção de fraudes em transações financeiras
- 2. Monitoramento de infraestrutura e uptime
- 3. Detecção de ameaças à segurança
- 4. Aviso antecipado de churn
- 5. Controle de qualidade na fabricação
- 6. Monitoramento de políticas de despesas
- Modos de falha: o que quebra a detecção de anomalias
- A Doutrina do Baseline em Primeiro Lugar
- O baseline é o modelo
- Quando o Anomaly Agent funciona (e quando não funciona)
- Sinais de ROI: medindo o impacto
- Governança: quem é dono do programa de anomalias
- Saiba mais