SaaS Economics & Unit Metrics: The Financial Foundation of Sustainable Growth
Turn this article into takeaways for your work.
Each assistant summarizes the article only for you and suggests best practices for your work.
The five SaaS metrics that determine whether a business is viable are CAC, LTV, the LTV:CAC ratio, CAC payback period, and the magic number. Together they answer one question: do you make more from a customer than it costs to acquire and serve them, and how fast? Strong unit economics (3:1 or better LTV:CAC, payback under 18 months) let you scale; weak ones mean growth just burns cash faster.
Here's an uncomfortable truth: about 80% of SaaS companies fail financially, not because they can't acquire customers, but because their unit economics don't work.
They spend $15K to acquire a customer who generates $8K in lifetime value. They take 36 months to pay back acquisition costs while running out of cash in 18 months. They grow revenue by 100% while burning through capital at unsustainable rates.
The problem isn't growth. It's growth without economic foundations. If you're a CFO, CEO, or board member trying to build a sustainable SaaS business, understanding unit economics isn't optional. It's the difference between building a valuable company and burning investor capital on a path to nowhere. Successful companies align their growth stage strategy with economic realities from day one.
What Are SaaS Unit Economics?
Unit economics measure the revenue and costs associated with acquiring and serving a single customer unit over their lifetime. It's the financial foundation that determines whether your business model is viable and scalable.
Three components define unit economics:
Revenue per customer unit. How much money does each customer generate over their lifetime with you? This includes initial subscription revenue, expansion revenue from upsells and add-ons, and any other monetization.
Cost per customer unit. How much does it cost to acquire each customer and serve them over their lifetime? This includes sales and marketing costs, customer success and support costs, and allocated product/infrastructure costs.
Lifetime profitability calculation. When you subtract total costs from total revenue for a customer cohort, do you make money? How long does it take to become profitable? How much profit do you ultimately generate?
Get this right, and you have a scalable business. Get it wrong, and growth accelerates your path to failure.
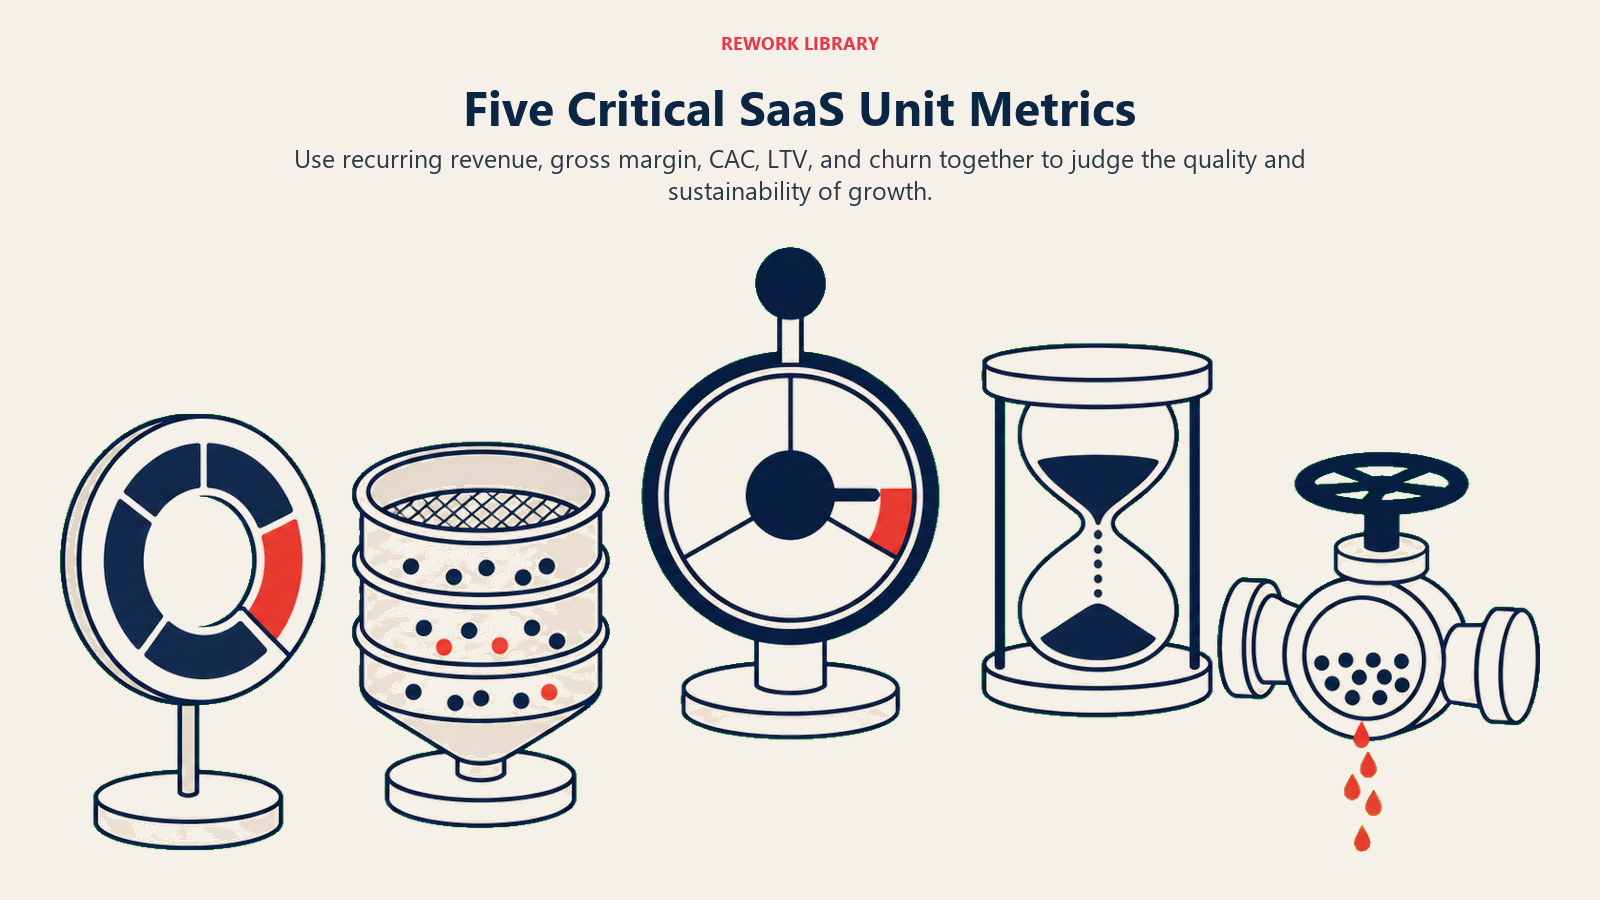
The Five Critical SaaS Metrics
Five metrics form the foundation of SaaS economics. Every CFO and CEO needs to know these numbers with precision.
Here's the full set at a glance, with the formula and the benchmark that signals healthy economics:
| Metric | Formula | Healthy benchmark |
|---|---|---|
| CAC | Total S&M spend / new customers acquired | Lower is better; compare against LTV |
| LTV | ARPU x gross margin % x customer lifetime | 3x+ of CAC |
| LTV:CAC ratio | LTV / CAC | 3:1 good, 4:1 excellent, below 3:1 problematic |
| CAC payback | CAC / (monthly revenue per customer x gross margin %) | Under 12 months excellent, 12-18 sustainable |
| Magic number | (current quarter ARR - prior quarter ARR) / prior quarter S&M | Above 0.75 efficient, above 1.0 accelerate |
Read each row top to bottom and you can grade a SaaS business in under a minute: the ratio tells you if acquisition is profitable, payback tells you if cash flow survives the wait, and the magic number tells you whether to step on the gas or fix efficiency first.
Customer Acquisition Cost (CAC)
CAC measures how much you spend to acquire one new customer. The full calculation includes:
Total Sales and Marketing Spend: All salaries, commissions, advertising, tools, events, content creation, and overhead for sales and marketing functions.
Customer Count: New customers acquired in the period (not leads, not trials - paying customers).
Formula: CAC = Total S&M Spend / New Customers Acquired
Example: You spent $500K on sales and marketing last quarter and acquired 50 new customers. Your CAC is $10,000.
Here's where most companies get CAC wrong: they exclude costs. They count only ad spend but forget sales salaries. They count only direct costs but forget allocated overhead. For accurate CAC, include everything - salaries, benefits, tools, agencies, advertising, events, and the portion of overhead attributable to S&M.
Also, consider the time lag. Sales and marketing spend in Q1 might generate customers in Q2. More sophisticated CAC calculations attribute spend to the quarter that influenced the customer acquisition.
Lifetime Value (LTV)
LTV estimates the total profit you'll generate from a customer over their entire relationship with you.
The basic formula: LTV = ARPU × Gross Margin % × Customer Lifetime
Where:
- ARPU (Average Revenue Per User) is monthly or annual revenue per customer
- Gross Margin % is revenue minus cost of goods sold (infrastructure, support, hosting)
- Customer Lifetime is 1 / Churn Rate
Example: $5K annual contract, 80% gross margin, 10% annual churn rate (10-year lifetime) = $5K × 0.80 × 10 = $40K LTV.
But this basic calculation assumes no expansion revenue, which misses a huge component of SaaS value. Better LTV calculations incorporate net revenue retention:
LTV = ARPU × Gross Margin % / (Churn Rate - Expansion Rate)
If your churn is 10% annually but expansion is 15% annually (negative net churn), your denominator becomes negative and LTV approaches infinity. This is why companies with 120%+ net revenue retention command premium valuations.
CAC:LTV Ratio
The CAC:LTV ratio tells you whether you're acquiring customers profitably. The rule of thumb:
3:1 or higher is good. For every dollar spent on acquisition, you generate at least three dollars in lifetime profit.
4:1 or higher is excellent. You're acquiring customers very efficiently with strong unit economics.
Below 3:1 is problematic. You're not generating enough profit relative to acquisition costs. This might work early on but won't scale.
Above 5:1 might indicate underinvestment. You could potentially grow faster by investing more in customer acquisition.
Example: CAC of $10K and LTV of $40K = 4:1 ratio. Solid economics.
But here's the nuance: CAC:LTV ratio alone doesn't tell the full story. You also need to consider payback period and cash flow.
CAC Payback Period
This measures how many months it takes for a customer's recurring revenue to pay back their acquisition cost.
Formula: CAC Payback = CAC / (Monthly Recurring Revenue per Customer × Gross Margin %)
Example: CAC of $10K, monthly revenue of $800, 80% gross margin = $10K / ($800 × 0.80) = 15.6 months.
Target benchmarks:
- Under 12 months: Excellent. You're recovering acquisition costs quickly.
- 12-18 months: Good. Sustainable for most SaaS companies.
- 18-24 months: Acceptable for enterprise SaaS with high LTV.
- Above 24 months: Problematic. You're tying up too much capital for too long.
Payback period matters because cash flow determines survival. You might have great LTV, but if it takes 36 months to break even on a customer while you're growing headcount and burning cash, you'll run out of runway before the model works.
Magic Number
The Magic Number measures sales efficiency - how much revenue growth you generate per dollar of sales and marketing spend.
Formula: Magic Number = (Current Quarter ARR - Prior Quarter ARR) / Prior Quarter S&M Spend
Example: You went from $4M to $5M ARR ($1M increase) and spent $1.2M on S&M last quarter. Magic Number = $1M / $1.2M = 0.83.
Interpretation:
- Above 1.0: Very efficient growth. Every S&M dollar generates more than a dollar of ARR.
- 0.75-1.0: Efficient growth. Good balance of spend and return.
- 0.5-0.75: Moderate efficiency. Room for improvement but acceptable.
- Below 0.5: Inefficient growth. You're overspending relative to ARR creation.
Magic Number helps you determine whether to accelerate or decelerate growth investments. A high Magic Number (above 0.75) signals you should invest more in S&M because returns are strong. A low Magic Number suggests you need to fix efficiency before scaling spend. Understanding your SaaS marketing funnel helps identify where to improve these efficiency metrics.
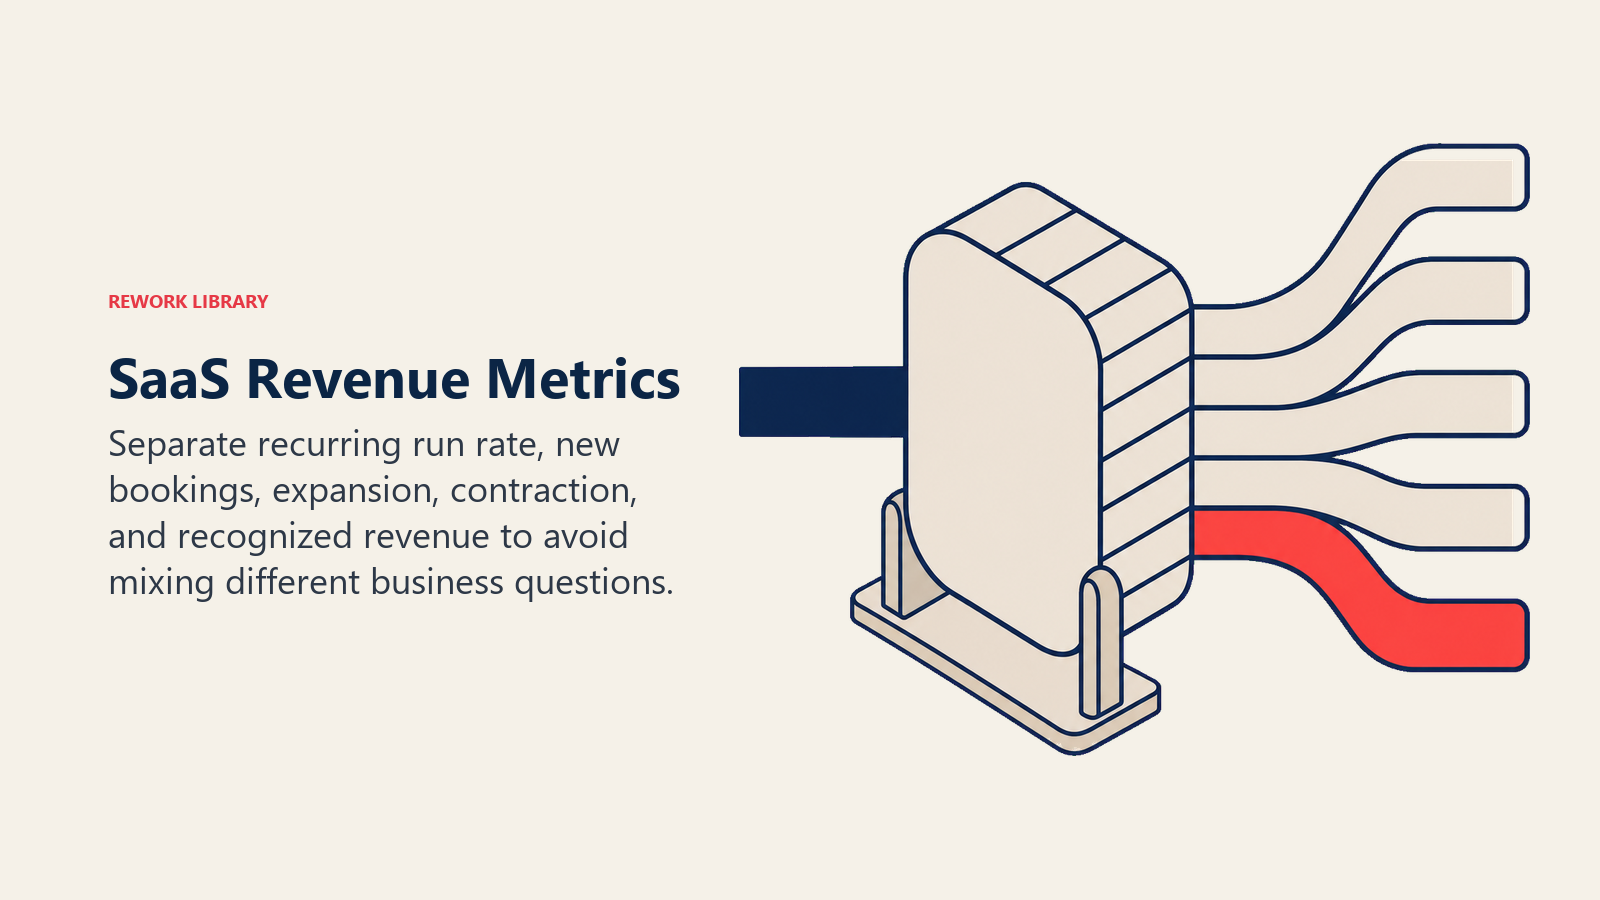
Revenue Metrics Deep Dive
Beyond the five critical metrics, you need precise revenue tracking.
MRR (Monthly Recurring Revenue)
MRR normalizes all subscription revenue to a monthly basis. This gives you a consistent number to track growth month over month.
Calculation components:
- Monthly subscriptions count at face value
- Annual subscriptions divide by 12
- One-time fees and services revenue excluded (not recurring)
MRR segments that matter:
- New MRR: From newly acquired customers
- Expansion MRR: From upsells, add-ons, seat expansion
- Contraction MRR: From downgrades
- Churned MRR: From cancellations
Net New MRR = New + Expansion - Contraction - Churned
Track these segments separately to understand what's driving (or killing) growth.
ARR (Annual Recurring Revenue)
ARR is your annualized subscription revenue run rate. It's the primary metric for SaaS companies at scale.
Simple calculation: ARR = MRR × 12
When to use ARR vs MRR:
- Use MRR for tactical operations and short-term trends
- Use ARR for strategic planning, board reporting, and valuation discussions
Most SaaS companies report ARR as their headline growth number. "We grew from $10M to $18M ARR" is clearer than tracking monthly fluctuations.
ACV (Annual Contract Value)
ACV measures the average annual value of customer contracts.
ACV = Total Contract Value / Contract Length in Years
A 3-year, $150K contract has a $50K ACV.
Why ACV matters: it determines your viable go-to-market motion. Companies with $5K ACV can't afford expensive field sales teams. Companies with $100K ACV can't rely solely on self-service. Your ACV directly influences whether you need a product-led growth strategy or an enterprise sales motion.
ARPU (Average Revenue Per User)
ARPU tracks revenue per customer (or per user, depending on your business model).
ARPU = Total Recurring Revenue / Total Number of Customers
Track ARPU over time to see if you're moving upmarket, capturing more value, or facing pricing pressure. Rising ARPU often indicates successful expansion strategies. Falling ARPU might signal a shift to lower-value customer segments.
Cost Structure Analysis
Understanding your cost structure is critical for forecasting profitability at scale.
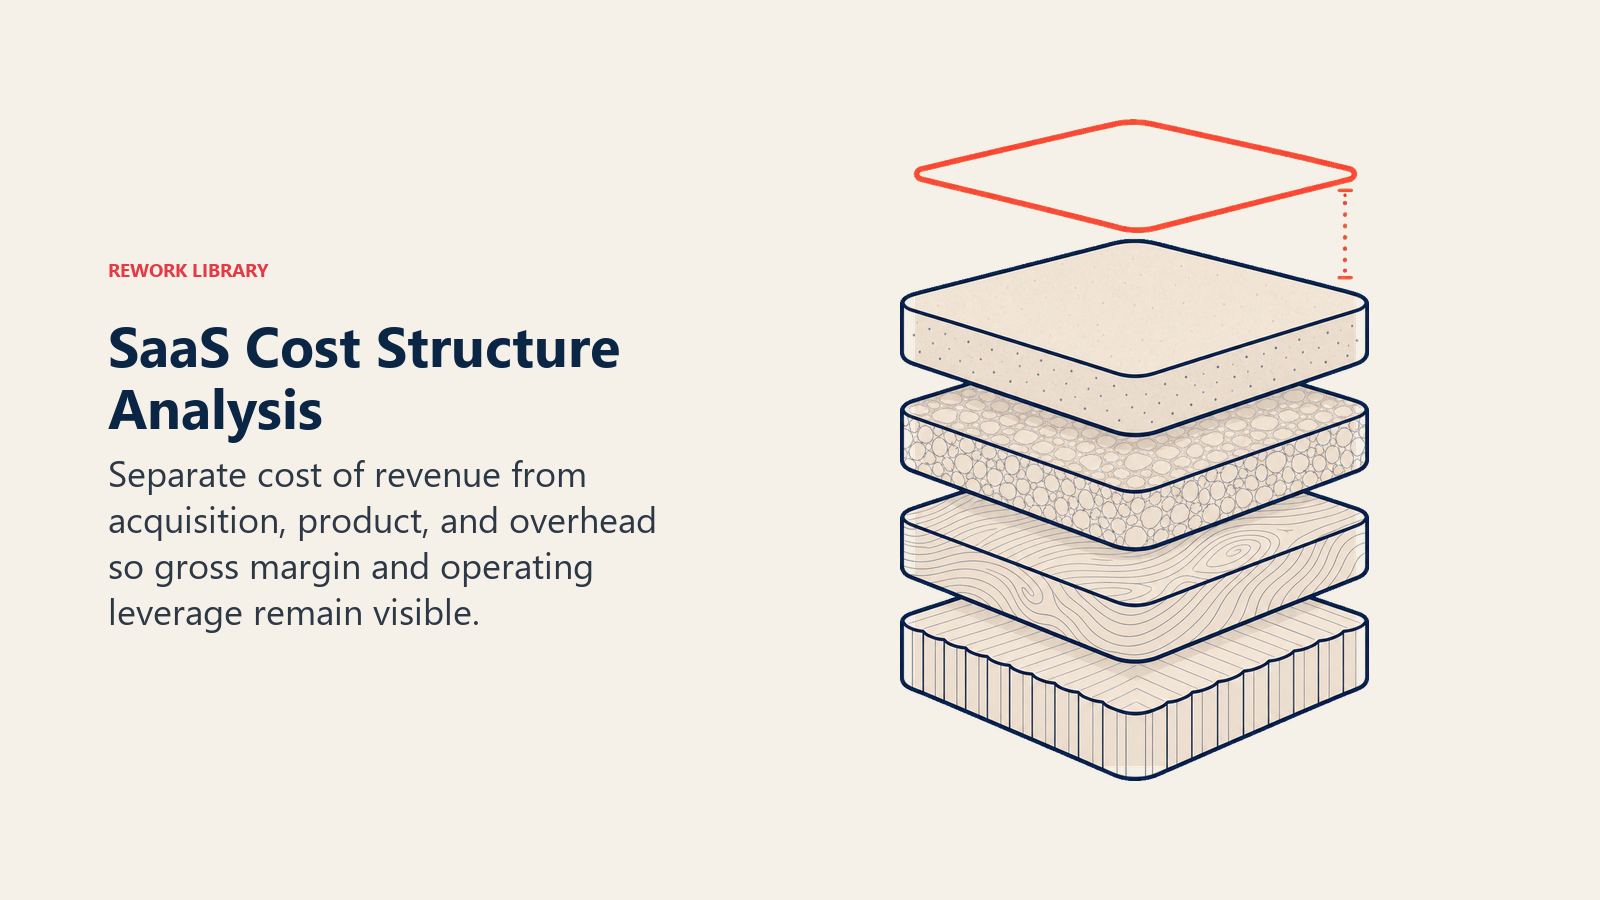
Sales and Marketing: 50-60% of revenue for growth-stage companies. This includes all costs to acquire and activate customers. At maturity, this drops to 30-40% as efficiency improves and brand strength reduces acquisition costs.
Research and Development: 20-30% of revenue for product development and engineering. SaaS requires continuous innovation, so R&D remains a significant ongoing investment even at scale.
Customer Success and Support: 10-15% of revenue to ensure customers stay engaged and expand usage. This percentage can be higher for complex products requiring hands-on success management. Implementing proactive customer success strategies can improve retention while controlling costs.
General and Administrative: 10-15% of revenue for finance, legal, HR, and overhead. This percentage typically decreases as a company scales and achieves operational leverage.
These benchmarks vary by company stage and business model. Early-stage companies often spend 80-100% of revenue on growth. Mature, profitable SaaS companies target 70-80% total operating expenses, delivering 20-30% operating margins.
The Rule of 40 framework helps balance growth spending with profitability targets.
Cohort Analysis Framework
Cohort analysis reveals how unit economics evolve over time and across customer segments.
Revenue retention by cohort tracks what percentage of revenue you retain from customers acquired in a specific month or quarter. Plot this over time to see retention curves.
Strong retention looks like: Month 1 (100%), Month 12 (95%), Month 24 (90%). You're keeping customers and minimizing churn.
Weak retention looks like: Month 1 (100%), Month 12 (70%), Month 24 (45%). Half your customers disappear within two years.
Expansion revenue patterns show how customer cohorts grow revenue over time. Do customers expand usage? Do they upgrade tiers? How long does it take?
Best-in-class SaaS companies see cohorts at 110-120% of original revenue after 12 months and 120-140% after 24 months. This expansion revenue strategy offsets churn and drives growth.
Payback period by cohort reveals whether acquisition efficiency is improving. If Q1 2024 cohort had an 18-month payback but Q3 2024 cohort has a 12-month payback, your efficiency is improving. That's a green light to invest more in growth.
Cohort profitability curves show when customer cohorts become profitable and how profit compounds over time. This visualization helps executives understand the long-term value creation dynamics of the business model.
Growth Efficiency Metrics
Beyond the core five, several metrics help you measure growth efficiency:
CAC Payback Period: As covered above, target 12-18 months. Enterprise SaaS can tolerate longer payback, but SMB SaaS needs faster payback due to higher churn risk.
Magic Number: Target above 0.75 for efficient growth. Above 1.0 signals you should accelerate investment.
Rule of 40: Growth rate + profit margin should exceed 40%. A company growing 30% with 15% EBITDA margin hits 45% on Rule of 40, which is strong performance.
Burn Multiple: Cash burned per dollar of net new ARR. Formula = Net Burn / Net New ARR. Below 1.5x is efficient, above 3x is concerning. This metric gained popularity in 2022-2023 as capital efficiency became crucial.
These efficiency metrics help you balance growth with capital consumption. Fast growth means nothing if you run out of money before reaching profitability.
Unit Economics by Segment
Unit economics vary significantly across customer segments. Analyzing them separately reveals where you should focus:
SMB vs Mid-Market vs Enterprise:
- SMB might have $5K ACV, 20% annual churn, $2K CAC, 2.5:1 LTV:CAC
- Mid-Market might have $25K ACV, 10% annual churn, $8K CAC, 3.5:1 LTV:CAC
- Enterprise might have $150K ACV, 5% annual churn, $40K CAC, 4:1 LTV:CAC
Each segment has different economics. Enterprise typically has better LTV:CAC ratios but longer sales cycles and higher upfront costs.
Self-serve vs Sales-assisted:
- Self-serve might have $3K ACV, $500 CAC, 6:1 ratio, 8-month payback
- Sales-assisted might have $30K ACV, $8K CAC, 4:1 ratio, 14-month payback
Self-serve offers better CAC:LTV ratios but lower ACVs. Sales-assisted trades efficiency for deal size.
Geographic variation:
- US customers might have 2x higher ACV than European customers
- Emerging markets might have 10x higher churn rates
- CAC can vary 3-5x across regions due to competitive dynamics
Segment your unit economics analysis to understand where you're winning and where you're losing money. Then double down on profitable segments and fix or exit unprofitable ones.
Improving Unit Economics
Five primary levers improve unit economics:
Reduce CAC through better conversion. Optimize your funnel, improve messaging, target better-fit leads. Going from 2% to 3% conversion on the same ad spend cuts CAC by 33%. Apply conversion rate optimization techniques systematically to improve acquisition efficiency.
Increase LTV through retention. Reduce churn from 20% to 15% annually and LTV increases by 33%. Better onboarding, customer success, and product improvements all drive retention. Implement a comprehensive churn reduction framework to identify and address retention issues.
Increase LTV through expansion. Land-and-expand strategies that grow customer revenue over time can double or triple LTV. Build expansion into your product and pricing model.
Optimize cost structure at scale. As you grow, negotiate better infrastructure pricing, achieve support efficiencies, and spread fixed costs across more customers. This improves gross margins.
Pricing optimization. Most SaaS companies underprice. A 10% price increase with minimal churn impact drops straight to LTV. Test pricing systematically using value-based pricing approaches that align with customer outcomes.
The highest-leverage improvements often come from retention and expansion, not acquisition cost reduction. A 5-point improvement in retention might deliver 10x the value of a 5% CAC reduction.
Financial Planning Framework
Use unit economics to build bottoms-up financial models:
Start with cohort assumptions: How many customers will you acquire each quarter? At what CAC? With what retention and expansion curves?
Model revenue buildup: Layer cohorts over time, applying retention and expansion rates to project future ARR.
Project costs: Sales and marketing costs to hit acquisition targets. R&D costs to support the product roadmap. CS costs to serve the customer base. G&A to run the business.
Calculate cash flow: Revenue recognition (ratably over contract terms), cash collections (payment timing), and cash burn (operating expenses minus collections).
Determine funding needs: How much capital do you need to reach cash flow breakeven? What milestones must you hit to raise the next round?
This bottoms-up approach grounds your plan in actual customer economics rather than top-down growth fantasies. It forces discipline around what's actually achievable given your unit economics. Use ARR forecasting methodologies to build accurate financial projections based on your cohort data.
When unit economics are strong (3:1+ LTV:CAC, sub-18-month payback, 90%+ retention), you can grow aggressively and raise capital on favorable terms. When they're weak, you need to fix fundamentals before scaling.
Conclusion: Economics Determine Everything
Unit economics aren't just CFO metrics. They determine whether your SaaS business is viable, whether you can scale, and what your company is ultimately worth.
You can have brilliant marketing, a great product, and a motivated team. But if you're spending more to acquire customers than they'll ever generate in profit, you're building on sand.
Measure your unit economics accurately. Track them across cohorts and segments. Optimize the key levers systematically. And most importantly, don't scale until the economics work. The most expensive mistake in SaaS is premature scaling on broken economics.
Build the financial foundation first. Growth follows when the unit economics are sound.
Frequently Asked Questions
What are the 5 key SaaS metrics?
The five core metrics are Customer Acquisition Cost (CAC), Lifetime Value (LTV), the LTV:CAC ratio, CAC payback period, and the magic number. CAC and LTV measure cost and value per customer, the ratio and payback measure profitability and cash recovery, and the magic number measures how efficiently sales and marketing spend converts into new ARR.
What is a good LTV:CAC ratio for SaaS?
A 3:1 ratio is generally considered healthy, and 4:1 is excellent. Below 3:1 means you are not generating enough lifetime profit relative to acquisition cost. A ratio above 5:1 can signal underinvestment, meaning you could grow faster by spending more on acquisition.
How do you calculate CAC payback period?
Divide CAC by the product of monthly recurring revenue per customer and gross margin percentage. For example, a $10K CAC with $800 monthly revenue at 80% gross margin gives $10K / ($800 x 0.80), or about 15.6 months. Under 12 months is excellent, 12 to 18 months is sustainable for most SaaS.
What is the SaaS magic number?
The magic number measures sales efficiency: current quarter ARR minus prior quarter ARR, divided by prior quarter sales and marketing spend. Above 1.0 means every dollar spent generates more than a dollar of ARR. Above 0.75 signals you can safely invest more; below 0.5 means fix efficiency before scaling.
Why do most SaaS companies fail financially?
Most fail not because they cannot acquire customers but because their unit economics do not work. They spend more to acquire and serve a customer than that customer ever returns, then scale that broken model and run out of cash. Premium scaling on broken economics is the most expensive mistake in SaaS.
Related Resources
Deepen your understanding of SaaS financial management and growth optimization:
- B2B SaaS Growth Model - Comprehensive framework for building recurring revenue businesses
- Net Revenue Retention (NRR) - Strategies for measuring and improving customer revenue expansion
- Rule of 40 Optimization - Balance growth rate with profitability margins
- SaaS Metrics Dashboard - Build dashboards to track and visualize key financial metrics

Senior Operations & Growth Strategist
On this page
- What Are SaaS Unit Economics?
- The Five Critical SaaS Metrics
- Customer Acquisition Cost (CAC)
- Lifetime Value (LTV)
- CAC:LTV Ratio
- CAC Payback Period
- Magic Number
- Revenue Metrics Deep Dive
- MRR (Monthly Recurring Revenue)
- ARR (Annual Recurring Revenue)
- ACV (Annual Contract Value)
- ARPU (Average Revenue Per User)
- Cost Structure Analysis
- Cohort Analysis Framework
- Growth Efficiency Metrics
- Unit Economics by Segment
- Improving Unit Economics
- Financial Planning Framework
- Conclusion: Economics Determine Everything
- Frequently Asked Questions
- Related Resources