Conversion Rate Optimization: The Systematic Approach to SaaS Growth
Turn this article into takeaways for your work.
Each assistant summarizes the article only for you and suggests best practices for your work.
SaaS conversion rate optimization is the systematic process of lifting the percentage of users who take key actions at each stage of the funnel, from visitor to signup to activated user to paying customer. Unlike a single landing page test, it treats the whole journey as a connected system, where small gains at each stage compound into large revenue impact. A B2B SaaS company increased their homepage-to-trial conversion rate from 2.1% to 3.0% through systematic testing over six months. That 0.9 percentage point lift doesn't sound dramatic. But applied to 50,000 monthly visitors, it generated 450 additional trials per month. At 15% trial-to-paid conversion and $2,400 ACV, that's $1.94M in additional ARR annually.
From a single metric improvement.
This is why conversion rate optimization matters for SaaS. Small percentage improvements compound across your funnel and generate material revenue impact. A 10% improvement in visitor-to-trial conversion plus a 10% improvement in trial-to-paid conversion equals a 21% increase in customer acquisition.
But most SaaS companies approach CRO wrong. They make random changes, declare victory on insufficient data, or optimize individual pages without considering the broader journey. Real CRO requires systematic process, statistical rigor, and full-funnel thinking that aligns with your overall SaaS growth model.
Here's how to build CRO programs that actually move revenue metrics.
What CRO Means for SaaS
Conversion rate optimization is the systematic process of increasing the percentage of users who take desired actions throughout your customer journey. For SaaS, this isn't just landing page conversion. It's optimizing multiple conversion points:
- Visitor to Signup
- Signup to Activated user
- Activated user to Trial start
- Trial user to Paying customer
- Free user to Upgraded user
- Paying customer to Retained customer
Each stage has different conversion mechanisms, different friction points, and different optimization levers.
CRO as growth multiplier: While paid acquisition strategies increase traffic volume, CRO increases the yield from that traffic. Doubling conversion rates has the same revenue impact as doubling traffic, but often costs 10x less.
Compounding impact: Improvements compound. Optimize visitor-to-trial 10%, then trial-to-paid 10%, then paid-to-retained 10%. Combined impact far exceeds individual improvements.
This makes CRO one of the highest-ROI activities in your growth program.
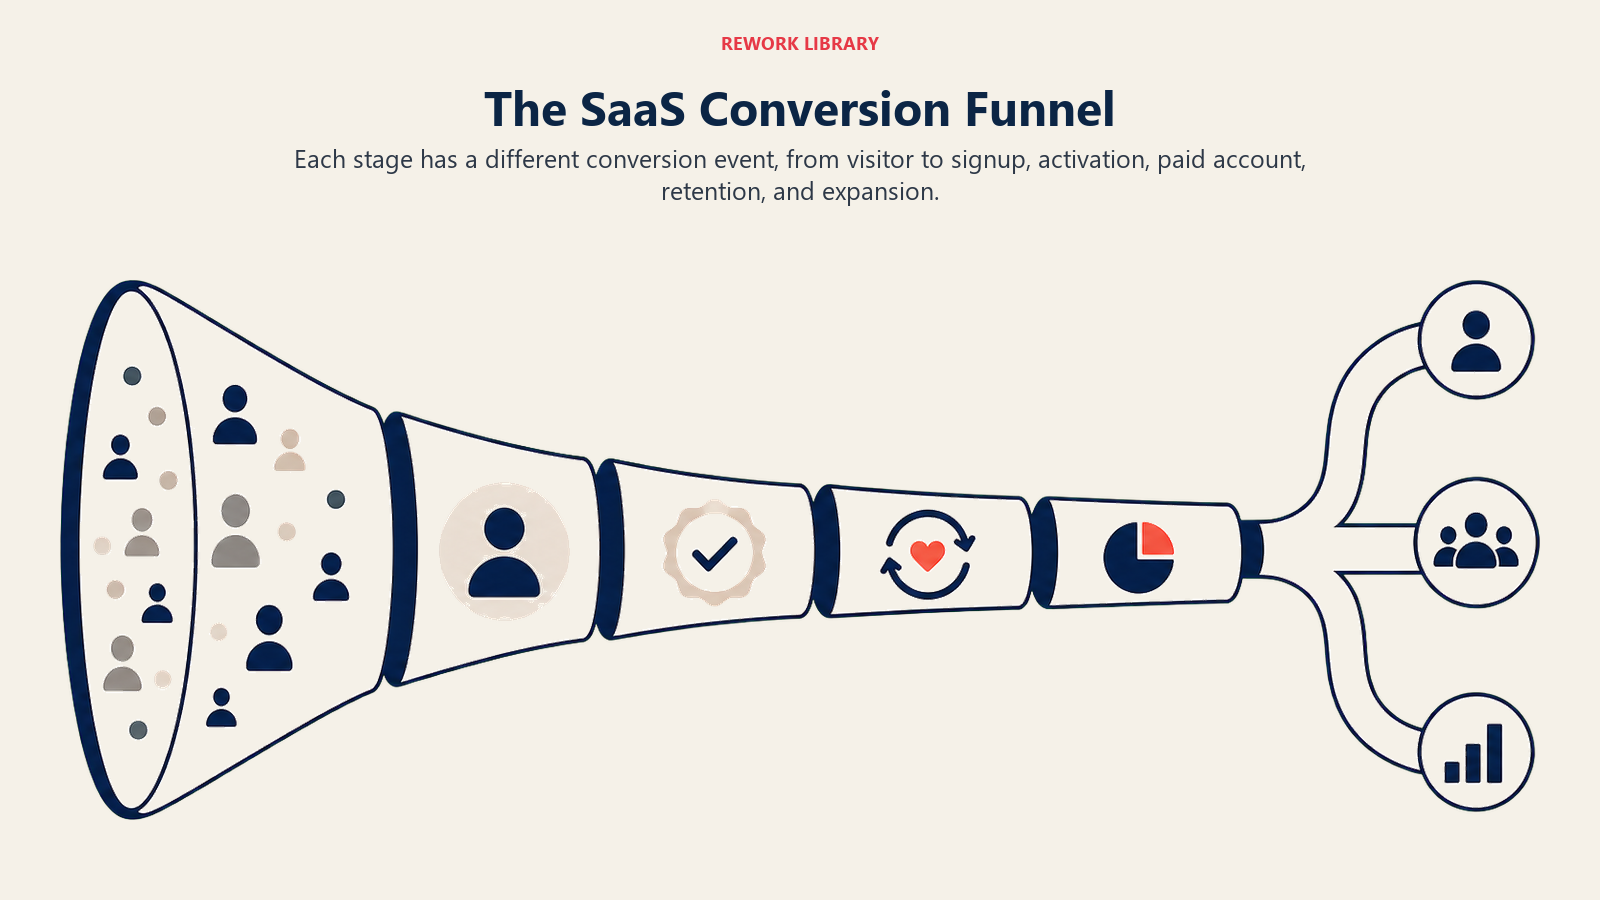
The SaaS Conversion Funnel
Understanding your funnel stages enables targeted optimization.
Use this benchmark table as a quick diagnostic. If a stage sits below its typical range, that stage is where optimization effort returns the most. Median figures vary by product and motion, so treat them as starting reference points, not hard targets. | Funnel stage | Typical conversion | Most common cause of leakage | |---|---|---| | Visitor to signup | 1-5% | Unclear value proposition, weak social proof | | Signup to activation | 20-60% | Slow time-to-value, confusing onboarding | | Activation to trial/free | 60-90% | Value not demonstrated, poor use-case fit | | Trial to paid | 10-30% (trial), 2-5% (freemium) | Pricing friction, missing trial features | | Paid to retained | 85-95% monthly | Value not realized, weak customer success |
Stage 1: Visitor to Signup
What it measures: Percentage of website visitors who create accounts Typical conversion rates: 1-5% depending on traffic source and product
Key friction points:
- Unclear value proposition
- Weak social proof
- Confusing signup process
- Missing trust signals
- Poor mobile experience
Primary optimization levers: Homepage messaging, signup form design, trust elements
Stage 2: Signup to Activation
What it measures: Percentage of signups who complete meaningful first actions
Typical conversion rates: 20-60% depending on product complexity
Key friction points:
- Confusing onboarding
- Time-to-value too long
- Missing guidance
- Technical setup required
- Feature overwhelm
Primary optimization levers: Onboarding flow, first-run experience, onboarding and time-to-value optimization
For deeper insights, explore user activation framework strategies.
Stage 3: Activation to Trial/Free User
What it measures: Activated users who begin trial or continue using free product
Typical conversion rates: 60-90% for strong products
Key friction points:
- Value not demonstrated
- Poor product experience
- Missing key features
- Lack of use case fit
Primary optimization levers: Feature discoverability, value communication, use case matching
Stage 4: Trial/Free to Paid
What it measures: Percentage converting to paying customers
Typical conversion rates: 10-30% for trials through free trial optimization, 2-5% for freemium
Key friction points:
- Pricing objections
- Procurement complexity
- Missing features in trial
- Poor upgrade prompts
- Confusing checkout
Primary optimization levers: Pricing clarity, upgrade messaging, checkout friction, payment options
This is detailed in trial to paid conversion best practices.
Stage 5: Paid to Retained
What it measures: Percentage of customers who renew or remain active
Typical conversion rates: 85-95% monthly, 70-90% annually
Key friction points:
- Value not realized
- Poor product engagement
- Missing functionality
- Weak customer success
- Better alternatives emerge
Primary optimization levers: Ongoing engagement, proactive customer success, feature adoption, expansion opportunities
Each stage requires different optimization approaches. Don't apply signup page tactics to retention challenges.
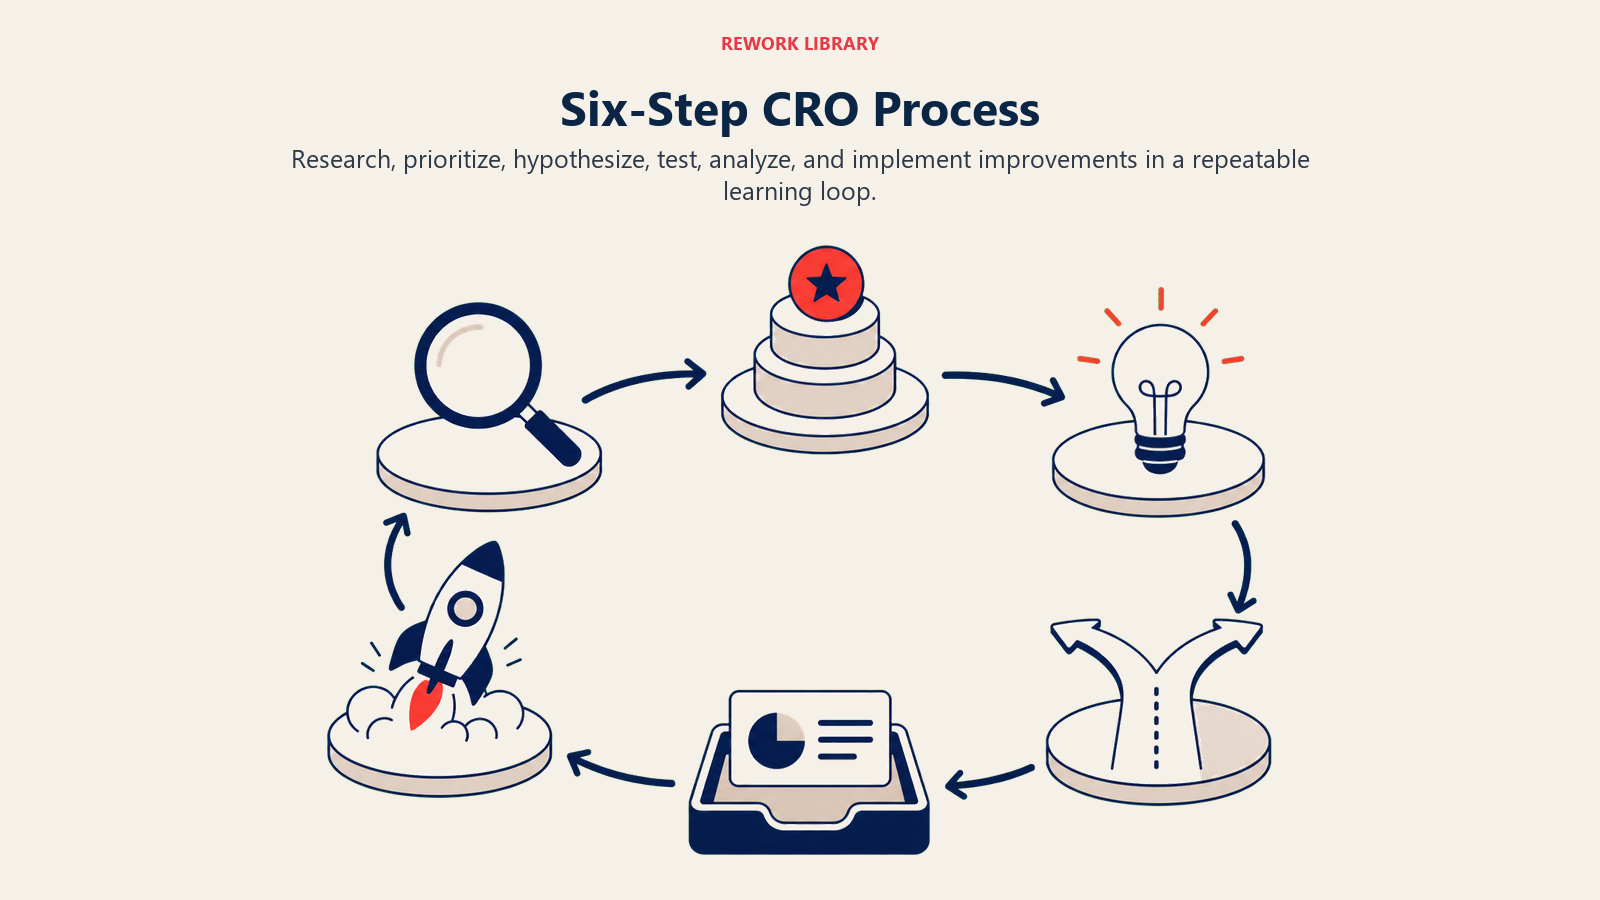
The CRO Process: Six Steps to Systematic Improvement
Random changes waste time. Systematic process drives results.
Step 1: Quantitative Analysis
Start with data. Identify where conversion problems exist. Funnel metrics: Measure conversion rates at each stage using a SaaS metrics dashboard
- Homepage visitors to Trial starts: 3.2%
- Trial starts to Activated: 65%
- Activated to Paid: 12% Identify drop-off points: Where are you losing most potential customers?
Calculate impact potential: Which improvements generate most revenue?
- Improving 3.2% to 4.0% homepage conversion = 250 more trials/month
- Improving 12% to 15% trial conversion = 45 more customers/month
Focus on stages with highest potential impact.
Step 2: Qualitative Research
Data shows where problems exist. Research reveals why.
User interviews: Talk to customers and prospects
- What almost stopped them from signing up?
- What confusion existed in onboarding?
- What convinced them to upgrade?
Surveys: Ask specific questions
- "What nearly prevented you from starting your trial?"
- "What one thing would make you more likely to upgrade?"
Session recordings: Watch real user behavior
- Where do users hesitate?
- What elements cause confusion?
- What paths do successful converters take?
Support ticket analysis: What questions emerge repeatedly?
Sales call insights: What objections surface?
Qualitative research generates hypotheses that quantitative testing validates.
Step 3: Hypothesis Prioritization
Not all test ideas are equal. Prioritize ruthlessly.
ICE Framework: Score each hypothesis on three dimensions:
- Impact: How much will this improve conversion? (1-10)
- Confidence: How certain are we it will work? (1-10)
- Ease: How simple is implementation? (1-10)
ICE Score = (Impact × Confidence × Ease) / 3
Test highest-scoring hypotheses first.
PIE Framework: Alternative scoring:
- Potential: Room for improvement
- Importance: Traffic/revenue impacted
- Ease: Resource requirements
Both frameworks beat gut-feel prioritization.
Step 4: Test Design
Design tests for valid results.
Control vs. Variation: Define exactly what changes
- Control: Current experience
- Variation: Proposed change
Success metric: Primary conversion metric being optimized
Secondary metrics: Watch for unintended impacts
- If testing signup form, track signup rate (primary) but also activation rate (secondary)
Sample size requirement: Calculate needed traffic for statistical significance
Test duration: Run long enough to account for weekly patterns (minimum 1-2 weeks)
Segment analysis: Plan how you'll analyze results by segment (traffic source, device, user type)
Proper design prevents false conclusions.
Step 5: Implementation
Run tests without contamination.
A/B testing tool: Use dedicated platform (Optimizely, VWO, Google Optimize)
Random assignment: Users randomly assigned to control or variation
Consistent experience: Once assigned, user sees same variation throughout
Tracking setup: Confirm events fire correctly before starting test
QA testing: Test both variations on multiple devices/browsers
Soft launch: Start with 10% traffic to catch bugs, then ramp to 50/50
Bad implementation invalidates good test design.
Step 6: Analysis and Learning
Extract insights, not just winners.
Statistical significance: Don't call test until reaching 95%+ confidence
Segment analysis: Did test perform differently by segment?
- Mobile vs. desktop
- Organic vs. paid traffic
- New vs. returning visitors
Secondary metric impact: Did improving primary metric hurt secondary metrics?
Document learning: What did this teach about user behavior?
Iterate: Build on learnings with follow-up tests
The goal isn't winning tests. It's compounding learning about what drives conversion.
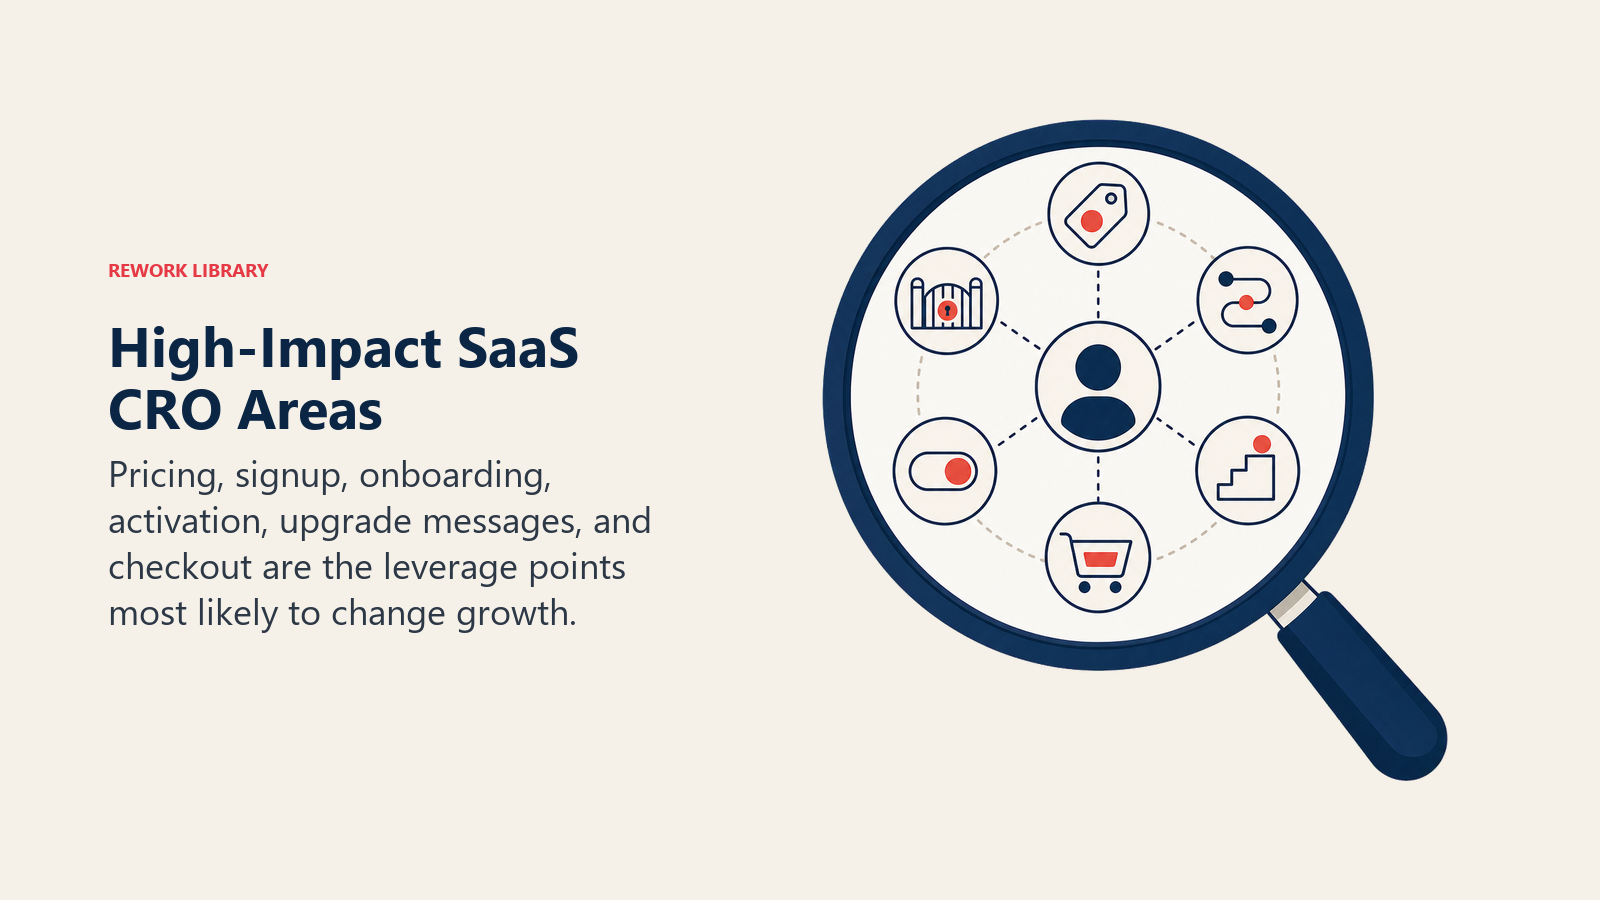
High-Impact CRO Areas for SaaS
Focus optimization efforts where impact is highest.
Homepage and Value Proposition
Test elements:
- Hero headline (value proposition clarity)
- Subheadline (elaboration and context)
- Primary CTA copy and design
- Social proof placement and format
- Feature presentation order
- Visual design and layout Common winning variations:
- Specific outcomes vs. generic benefits
- Customer results vs. feature lists
- Video vs. static images
- One CTA vs. multiple CTAs Learn how to leverage content marketing for SaaS to drive qualified traffic to these optimized pages.
Pricing Page Optimization
Your pricing page is critical conversion point.
Test elements:
- Number of tiers based on feature-based tiers strategy
- Pricing display (monthly, annual, or both)
- Feature comparison format
- CTA button copy
- Money-back guarantee prominence
- FAQ placement
Common winning variations:
- Annual pricing emphasized
- Specific plan recommended
- Clear feature differences
- Trial CTA vs. purchase CTA
Signup Flow Friction
Every field and step creates friction.
Test elements:
- Number of form fields
- Field order and grouping
- Email verification requirement
- Password complexity rules
- Social signup options
- Progress indicators for multi-step
Common winning variations:
- Fewer fields (but may reduce lead quality)
- Delay non-essential fields until after signup
- Social login options
- Clear privacy assurance
Onboarding Experience
First experience determines activation.
Test elements:
- Welcome message and initial guidance
- Feature tour vs. immediate product access
- Checklists and progress tracking
- Sample data vs. blank slate
- Help resource prominence
Common winning variations:
- Skippable tours with progress saving
- Contextual help vs. upfront training
- Quick wins vs. complete education
- Personalized onboarding by use case
Upgrade Prompts and Flows
How you ask matters.
Test elements:
- Upgrade prompt timing
- Messaging (features vs. benefits vs. limits)
- Visual design and prominence
- Frequency of prompts
- Discount or incentive offers
Common winning variations:
- Usage-based triggers (approaching limits)
- Time-based triggers (end of trial)
- Feature-specific prompts (when hitting limit)
- Benefit-focused copy
Checkout Process
Last-mile friction kills conversions. Optimize your checkout flow carefully.
Test elements:
- Single-page vs. multi-step checkout
- Required information fields
- Payment method options
- Trust badges and security signals
- Exit-intent offers for abandoners
Common winning variations:
- Progress indicators
- Guest checkout options
- Multiple payment methods
- Prominent guarantee/refund policy
Testing Frameworks and Best Practices
Testing discipline determines whether CRO creates durable learning or just noisy opinions. The rules below keep experiment results trustworthy enough to guide product, marketing, and revenue decisions. A/B Testing: Test one change at a time for clear causation
- Simple to analyze
- Clear attribution
- Slower learning (one variable at a time) Multivariate Testing: Test multiple changes simultaneously
- Faster learning
- Understand element interactions
- Requires more traffic
- More complex analysis Sample Size Requirements:
- Use online calculators
- Typical minimum: 100-350 conversions per variation
- Smaller changes require more traffic
Test Duration Guidelines:
- Minimum 1-2 weeks to account for weekly patterns
- Run through at least one full business cycle
- Don't stop early even if result looks clear
When to Call a Test:
- Reached statistical significance (95%+ confidence)
- Met sample size requirements
- Run minimum duration
- No external factors (site outages, major marketing campaigns)
Patience beats premature conclusions.
Common CRO Mistakes to Avoid
Testing without sufficient traffic: Need 1,000+ visitors/week minimum for meaningful tests
Stopping tests too early: Week 1 may show winner, but result regresses to mean by week 3
Ignoring statistical significance: "Looks like it's working" isn't good enough. Reach 95%+ confidence.
Optimizing for wrong metrics: Signup rate up but activation down? Net negative.
Copying competitor changes: What works for their audience may not work for yours
Testing too many things: Focus beats scattered efforts
Not documenting learnings: Institutional knowledge lost without documentation
Declaring victory and moving on: Build on winning tests with iterations
Avoid these and CRO effectiveness improves dramatically.
Personalization and Segmentation
Not all users need the same experience.
Segment-specific optimization:
- First-time vs. returning visitors
- Free users vs. trial users
- SMB vs. enterprise prospects based on market segmentation
- Industry-specific messaging
- Traffic source (organic vs. paid vs. referral) User intent matching:
- Show relevant case studies based on industry
- Highlight features based on use case
- Customize CTAs based on funnel stage Dynamic content:
- Change hero messaging by segment
- Show different social proof by industry
- Adjust pricing display by company size Progressive disclosure:
- Show advanced features to power users
- Hide complexity from beginners
- Reveal options as users engage
Personalization increases conversion but adds complexity. Test before scaling.
Building a CRO Culture
CRO succeeds when it's a discipline, not a project.
Cross-functional involvement:
- Product: Provides technical implementation
- Marketing: Supplies traffic and messaging insights
- Sales: Shares objection and conversion insights
- CS: Contributes retention and usage data
Regular review cadence:
- Weekly test reviews
- Monthly roadmap planning
- Quarterly strategic reviews
Learning documentation:
- Maintain test repository
- Document hypotheses, results, and insights
- Share learnings across teams
- Build institutional knowledge
Experimentation velocity:
- Track tests run per quarter
- Measure learning rate (insights per test)
- Celebrate validated learnings, not just wins
Organizations that embed CRO as operational discipline compound advantages over time.
CRO Tools and Technology
A/B Testing Platforms:
- Optimizely: Enterprise-grade with advanced targeting
- VWO: Mid-market with good balance of features and cost
- Google Optimize: Free but less powerful
- AB Tasty: European alternative with GDPR focus
Analytics Tools:
- Google Analytics: Free baseline
- Mixpanel: Event-based product analytics
- Amplitude: Product analytics with cohort analysis
- Heap: Automatic event tracking
For comprehensive guidance, see product analytics setup best practices.
Heatmap and Session Recording:
- Hotjar: Heatmaps, recordings, surveys in one
- FullStory: Detailed session replay with powerful search
- Mouseflow: Budget-friendly alternative
Survey and Feedback Tools:
- Typeform: Engaging survey design
- Qualaroo: On-site surveys and feedback
- Usabilla: In-context feedback collection
Feature Flagging:
- LaunchDarkly: Enterprise feature management
- Split.io: Feature flags with experimentation
- Optimizely Rollouts: Free feature flagging
Right tools accelerate testing velocity and insight generation.
The Compound Nature of CRO
CRO isn't about one winning test. It's about systematic improvement that compounds over time. A company running 2 tests per month, with 30% win rate and 10% average lift:
- 7 winning tests per year
- Each delivering 10% improvement to specific metric
- Combined impact: 19% compound improvement
Over three years: 63% total improvement in conversion.
This is why systematic CRO programs separate fast-growing SaaS companies from everyone else.
Organizations with mature CRO operations achieve:
- 20-40% annual improvement in key conversion metrics
- 3-5x ROI on CRO program investment
- Compounding knowledge about user behavior
- Competitive advantage through optimized experiences
Those treating CRO as occasional initiative see minimal impact.
The difference is discipline: systematic process, rigorous testing, continuous iteration, and institutional learning.
Frequently Asked Questions
What is SaaS conversion rate optimization? It's the systematic process of increasing the percentage of users who take desired actions across the SaaS funnel, from visitor to signup, activation, trial, paid, and renewal. Instead of optimizing one page in isolation, it treats the journey as a connected system where gains at each stage compound.
How is SaaS CRO different from regular landing page CRO? Landing page CRO focuses on a single conversion point, usually a form or signup. SaaS CRO spans multiple stages with different mechanics: activation, time-to-value, trial-to-paid, and retention. A win in one stage can hurt another, so you measure secondary metrics alongside the primary one.
What conversion rate should a SaaS company aim for? Targets vary by stage and motion. Visitor-to-signup typically runs 1-5%, trial-to-paid 10-30% for trials and 2-5% for freemium, and monthly retention 85-95%. Benchmark against your own historical data first, then against your segment.
How long should a SaaS A/B test run? Run a minimum of one to two weeks to cover weekly traffic patterns, and continue until you reach 95% statistical significance and your required sample size, usually 100-350 conversions per variation. Stopping early is the most common cause of false winners.
Which SaaS conversion point has the highest ROI to optimize? Start where the leak is largest and the traffic highest. For most SaaS companies that is the trial-to-paid or activation stage, because improvements there flow directly to revenue and compound with every later stage.
Ready to build systematic CRO programs? Explore specific optimization strategies for pricing pages, checkout flows, and trial conversions.
Related Resources
Conversion & Activation:
- Pricing Page Optimization: Converting Visitors into Paying Customers
- Checkout Flow Optimization: Removing Last-Mile Friction
- Trial to Paid Conversion: Maximizing Revenue from Trial Users
- User Activation Framework: Getting Users to First Value Fast
Analytics & Experimentation:
- Product Analytics Setup: Building Your Data Foundation
- SaaS Metrics Dashboard: Tracking What Matters
- Aha Moment Optimization: Accelerating User Value Discovery
Growth Strategy:

Senior Operations & Growth Strategist
On this page
- What CRO Means for SaaS
- The SaaS Conversion Funnel
- Stage 1: Visitor to Signup
- Stage 2: Signup to Activation
- Stage 3: Activation to Trial/Free User
- Stage 4: Trial/Free to Paid
- Stage 5: Paid to Retained
- The CRO Process: Six Steps to Systematic Improvement
- Step 1: Quantitative Analysis
- Step 2: Qualitative Research
- Step 3: Hypothesis Prioritization
- Step 4: Test Design
- Step 5: Implementation
- Step 6: Analysis and Learning
- High-Impact CRO Areas for SaaS
- Homepage and Value Proposition
- Pricing Page Optimization
- Signup Flow Friction
- Onboarding Experience
- Upgrade Prompts and Flows
- Checkout Process
- Testing Frameworks and Best Practices
- Common CRO Mistakes to Avoid
- Personalization and Segmentation
- Building a CRO Culture
- CRO Tools and Technology
- The Compound Nature of CRO
- Frequently Asked Questions
- Related Resources