Churn Risk Detection: Early Warning Systems for Proactive Intervention
 Churn risk detection is the B2B SaaS growth discipline of reading usage, engagement, sentiment, and business signals to flag at-risk accounts 60-90 days before they cancel. Catching risk that early is what separates retention-driven growth from constant firefighting, because intervention at 90 days succeeds 40-60% of the time versus 10-20% at 30 days.
Turn this article into takeaways for your work.
Each assistant summarizes the article only for you and suggests best practices for your work.
Most churn signals appear 60-90 days before customers cancel. But most intervention attempts happen too late, after customers have already decided to leave and found alternatives.
This timing problem kills save rates. By the time declining usage, disengagement, or negative sentiment reaches obvious levels, customers have mentally committed to churning. They've evaluated competitors, gained executive approval for switching, and possibly already signed with replacements. Save attempts at this stage face uphill battles against decisions already made.
Understanding proactive customer success principles helps teams shift from reactive firefighting to systematic risk prevention.
Early detection transforms save economics. Customers identified 90 days before potential churn remain persuadable. Problems causing dissatisfaction haven't festered into relationship-ending frustrations. Competitors haven't yet convinced them to switch. Intervention at this stage succeeds 40-60% of the time. Intervention at 30 days succeeds 10-20% of the time.
Building effective early warning systems requires understanding which signals actually predict churn, designing detection infrastructure that surfaces risks automatically, and creating operational responses that address problems before they become crises.
Understanding Churn Risk Detection Fundamentals
Early warning systems separate signals from noise to identify genuine churn risk.
Early warning signals vs late-stage indicators distinguishes between predictive risk factors and obvious cancellation precursors. Early signals like gradual usage decline or reduced email responsiveness appear months before churn. Late indicators like contract term requests or explicit cancellation threats appear days before customers leave.
Early signals enable prevention. Late indicators require damage control. Focus detection systems on early signals that create intervention windows.
Signal detection vs noise filtering balances sensitivity with specificity. Overly sensitive systems generate false positives that waste team time investigating healthy customers. Overly restrictive systems miss genuine risks until too late.
Optimal detection identifies 80%+ of actual churn risks while keeping false positives below 30%. Some noise is acceptable if it means catching most real risks.
Predictive modeling vs rule-based alerts represents two detection approaches. Rule-based systems trigger alerts when specific thresholds breach (usage drops 30%+, support tickets exceed 5 per month). Predictive models use machine learning to combine multiple signals into churn probability scores.
Rule-based systems work well initially and remain interpretable. Predictive models improve accuracy once you have sufficient historical data to train them. Most mature companies use hybrid approaches, supported by comprehensive product analytics setup infrastructure.
The Four Signal Categories
Comprehensive risk detection monitors multiple signal types that collectively predict churn. Usage signals track product behavior patterns that reveal engagement and value realization. Changes in how customers use your product predict retention outcomes better than what customers say about your product. Engagement signals measure relationship strength and communication patterns. Customers who disengage from strategic conversations often disengage from your product next.
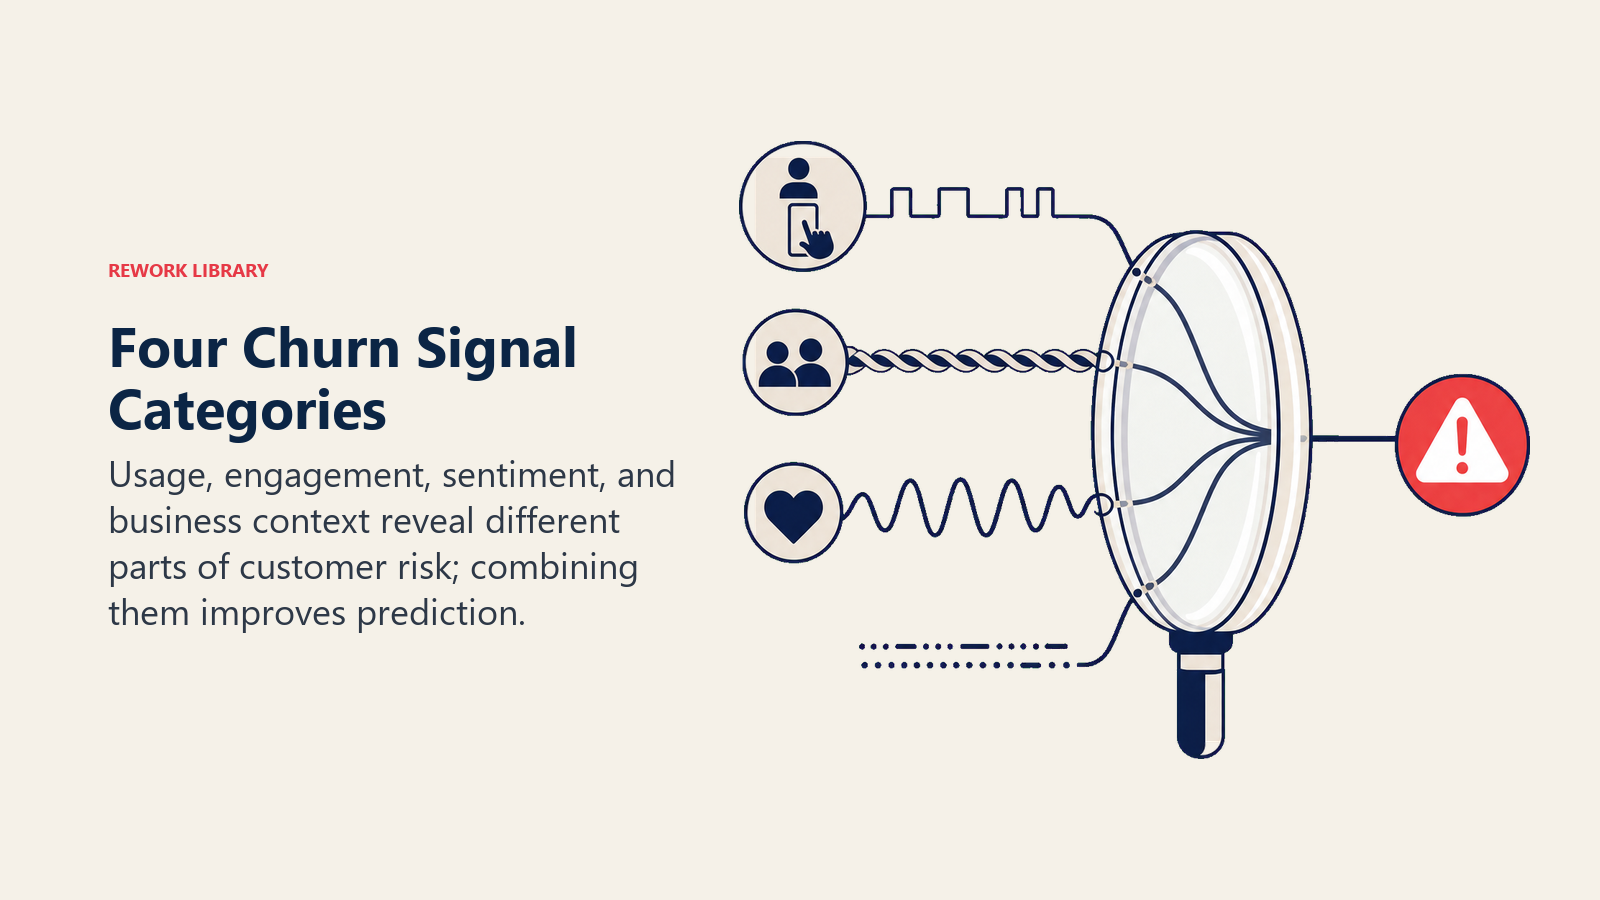
Sentiment signals analyze language and tone in customer communications to detect frustration, dissatisfaction, or consideration of alternatives.
Business signals capture organizational changes and economic factors that drive churn independently of product satisfaction.
Each category provides different perspectives on churn risk. Combining signals across categories creates more accurate prediction than relying on single signal types.
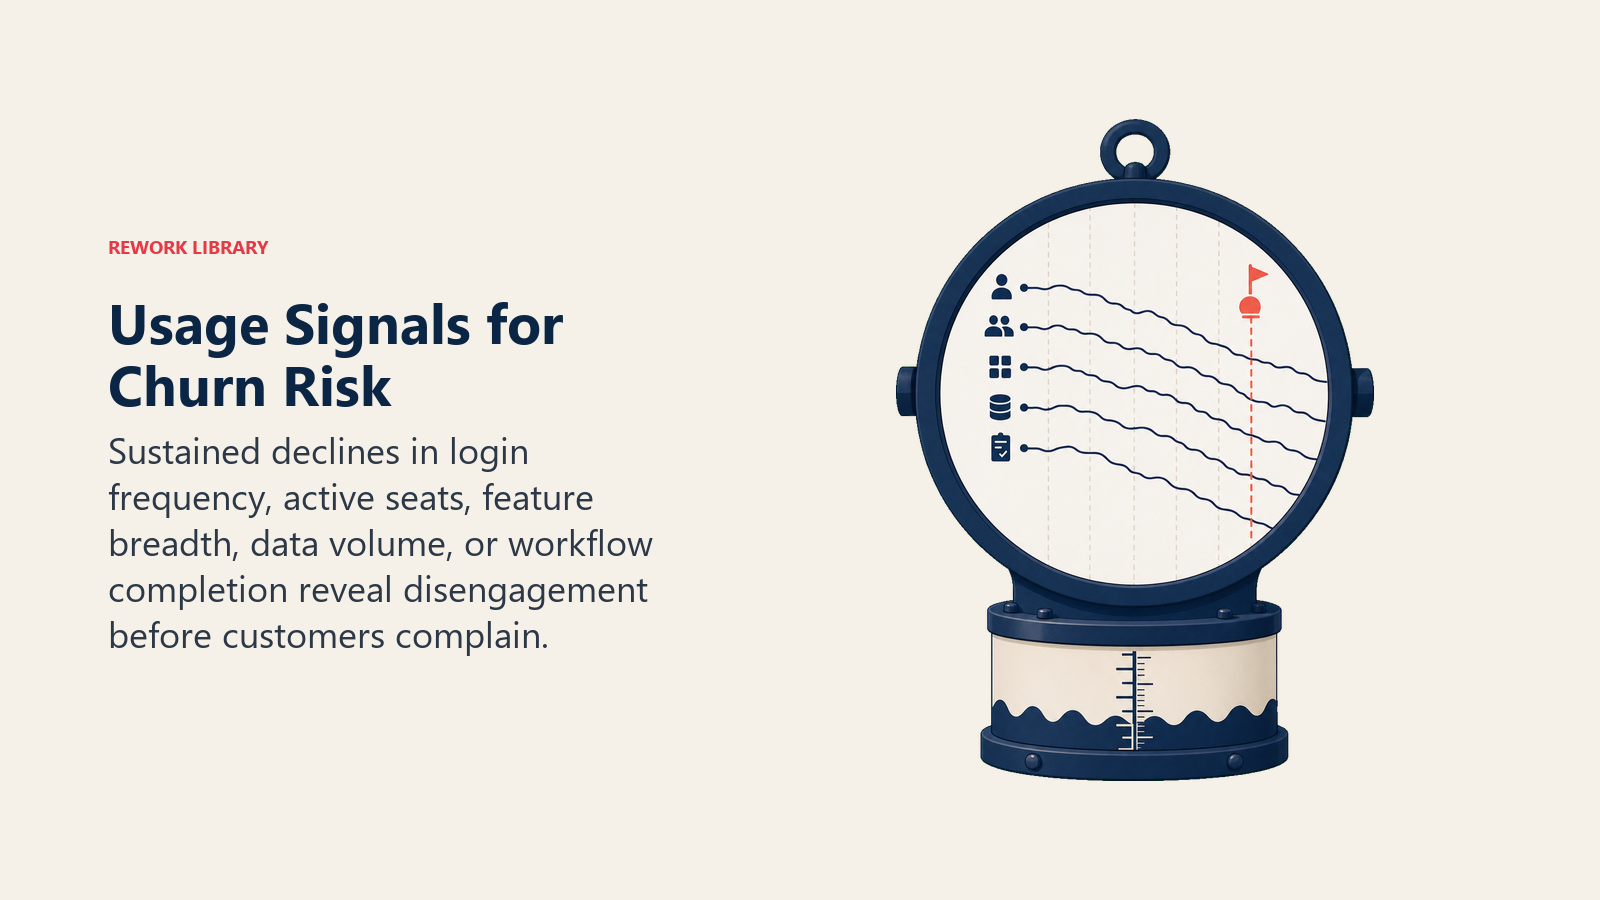
Usage Signal Detection
Product behavior changes predict churn risk before customers communicate dissatisfaction. Login frequency decline represents the most reliable early warning signal. A customer shifting from daily logins to weekly, or weekly to monthly, shows declining engagement that predicts churn. Set alerts for 30%+ declines sustained over 30 days. Short-term dips (vacation, holidays) create noise. Sustained declines signal genuine disengagement.
Track both absolute frequency and trend direction. A customer declining from 20 to 14 logins monthly shows concerning trends despite reasonable absolute numbers.
Active user decline measures seat utilization changes over time. A customer paying for 20 seats with 18 active users last month and 12 this month shows 33% active user decline.
This signals either users abandoning the product or the customer not replacing departed users. Both predict churn risk and seat expansion challenges.
Feature usage abandonment identifies when customers stop using key features they previously relied on. A customer who ran daily reports for 3 months but hasn't generated one in 4 weeks has changed their workflow, possibly to a competitor.
Track usage of your product's core value features. Abandonment of these capabilities indicates customers aren't receiving primary value anymore.
Session duration decrease reveals superficial engagement replacing deep usage. Customers who previously spent 30-minute sessions now log in for 2-minute check-ins. They're going through motions rather than accomplishing real work.
Combine session duration with login frequency. Declining duration plus declining frequency creates compound risk. Declining duration with stable frequency might indicate improved efficiency rather than disengagement.
Workflow incompletion patterns track whether customers successfully finish key processes. Project management customers who start projects but don't complete them. CRM customers who create opportunities but don't close them. Marketing customers who build campaigns but don't launch them.
Incomplete workflows suggest customers aren't achieving intended outcomes. Customer health deteriorates when value realization fails, often requiring improved onboarding and time-to-value strategies.
Data/content decrease often precedes churn as customers prepare to exit. Customers deleting projects, removing data, or cleaning up content are tidying before migration. This late-stage signal gives limited intervention time but provides high-confidence churn prediction.
Set alerts for 20%+ content decreases. Some cleanup is normal. Systematic content removal signals exit preparation.
Benchmark alert thresholds for usage signals:
- Login decline: 30%+ drop over 30 days (medium risk), 50%+ drop (high risk)
- Active users: 25%+ decline over 60 days (medium), 40%+ decline (high)
- Core feature abandonment: 14+ days without usage of key features (medium), 30+ days (high)
- Session duration: 40%+ decrease sustained 30+ days (medium risk)
- Content decrease: 20%+ reduction (medium), 40%+ reduction (high)
Engagement Signal Detection
Relationship disengagement often precedes product abandonment. Unresponsive to outreach indicates declining relationship investment. Customers who previously responded to emails within 24 hours now take weeks or never respond. Missed scheduled calls increase. Calendar holds for business reviews go unused.
Track response rates and time-to-response for key stakeholders. Deteriorating responsiveness predicts churn 60-90 days out.
Alert threshold: 3+ missed touchpoint attempts over 30 days without valid explanation.
Business review cancellations signal declining strategic engagement. Quarterly business reviews provide opportunities to demonstrate value and identify issues. Customers who cancel QBRs or repeatedly reschedule show disinterest in strategic partnership.
One cancellation isn't alarming. Pattern of cancellations or rescheduling quarterly reviews to annual indicates disengagement.
Executive sponsor departure/change creates risk when champions leave organizations. The VP who brought you in moves to a new company. The director who loved your product gets reassigned. New stakeholders haven't experienced your value and may review all vendor relationships.
Monitor LinkedIn for job changes at customer organizations. Set alerts for title changes of key contacts.
Intervention window: 30-45 days to establish relationships with replacement stakeholders before they evaluate vendors.
Champion disengagement happens when your internal advocates stop responding, advocating, or participating. Champions who previously provided feedback, attended webinars, and made internal introductions go quiet.
Champion loss predicts churn even if you maintain other relationships. Champions drive adoption, defend against competitors, and navigate internal politics on your behalf. Building strong champion-based selling relationships creates resilience against individual departures.
Support ticket surge sometimes indicates frustration rather than engagement. Moderate ticket volume suggests healthy usage. Zero tickets might indicate under-utilization. But sudden surges in tickets, especially for similar issues, reveal customer frustration.
Track tickets per month and month-over-month changes. 100%+ increase over 60 days warrants investigation.
Negative sentiment in communications reveals frustration through language analysis. Customers using negative language (frustrated, disappointed, unacceptable, failing) show deteriorating satisfaction.
Analyze support tickets, email responses, and survey feedback for sentiment. Consistently negative tone predicts churn better than isolated complaints.
Sentiment Signal Detection
Language analysis reveals customer attitudes that predict future behavior.
NPS detractor scores identify dissatisfied customers likely to churn. Net Promoter Scores of 0-6 represent detractors who wouldn't recommend you and might actively discourage others.
While NPS alone doesn't strongly predict churn, combining detractor scores with usage decline creates high-confidence risk signals.
Support ticket sentiment analysis evaluates emotional tone in customer problems. Tickets described calmly ("I noticed an issue with...") differ from frustrated tickets ("This is completely unacceptable...").
Use text analysis tools to score ticket sentiment. Track average sentiment per account and sentiment trends over time.
Alert on: 3+ consecutive negative-sentiment tickets, or average sentiment score declining 30%+ over 60 days.
Feature request tone analysis distinguishes between constructive feedback and frustrated complaints. Requests framed positively ("Would love to see...") differ from complaints framed as demands ("Why don't you have...?").
Increasingly demanding or frustrated feature requests signal customers losing patience with perceived product gaps.
Competitive inquiry mentions appear when customers explicitly reference competitors in communications. "We're evaluating Competitor X, how do you compare?" or "Competitor Y offers this feature, why don't you?"
Competitive mentions predict churn within 90 days in 40-60% of cases. Customers researching alternatives are preparing to leave.
Pricing objection frequency increases before churn. Customers who previously paid without complaint start questioning value, requesting discounts, or comparing your pricing to cheaper alternatives.
Pricing objections combined with usage decline create high churn risk. Customers who don't use your product heavily struggle to justify costs. Understanding value-based pricing helps align cost with perceived outcomes.
Contract negotiation language reveals customer commitment levels. Customers asking about contract terms, cancellation policies, or month-to-month options are maintaining exit flexibility rather than committing long-term.
Business Signal Detection
Organizational and economic factors drive churn independently of product satisfaction. Budget cut announcements directly threaten renewal. Customers announcing cost reduction initiatives, hiring freezes, or budget cuts will evaluate all vendors for potential savings.
Monitor press releases, earnings calls, and LinkedIn posts from customer companies for budget-related announcements.
Layoffs or reorganizations create churn risk through budget pressure and stakeholder changes. Companies eliminating positions reduce headcount that needs your product. Reorganizations change reporting structures and potentially your buying contacts.
Merger/acquisition activity transforms customer organizations and often consolidates vendors. Acquiring companies typically standardize on one set of tools. If your customer gets acquired by a company using competitors, you face displacement risk.
Monitor acquisition announcements. Proactively reach out to offer transition support and demonstrate value to new leadership.
Leadership changes at customer organizations create vendor review opportunities. New executives often review all significant spending and vendor relationships. They haven't experienced your value personally and may be loyal to tools they used at previous companies.
Track executive appointments through LinkedIn, press releases, and business news. Engage new leaders within 30 days of their appointment.
Competitive wins at company indicate competitors establishing footholds. Your customer adopting a competitor's product in adjacent category suggests openness to switching. If they chose Competitor X for project management, they might choose Competitor Y for CRM.
Payment delays or disputes signal financial stress or vendor deprioritization. Customers who previously paid invoices promptly start paying late, requesting payment plans, or disputing charges.
Payment issues predict churn within 60 days in 30-40% of cases. They indicate either budget constraints or declining perceived value justification.
Downgrade requests represent customers actively reducing commitment. Tier downgrades, seat reductions, or feature removals all predict increased churn risk. Customers shrinking their deployment rarely expand later, making expansion revenue strategy significantly more challenging.
Detection System Architecture
Systematic risk detection requires infrastructure that monitors signals automatically and routes alerts appropriately. Data integration combines product analytics, CRM, support systems, billing platforms, and external data sources. Each system provides different signal types:
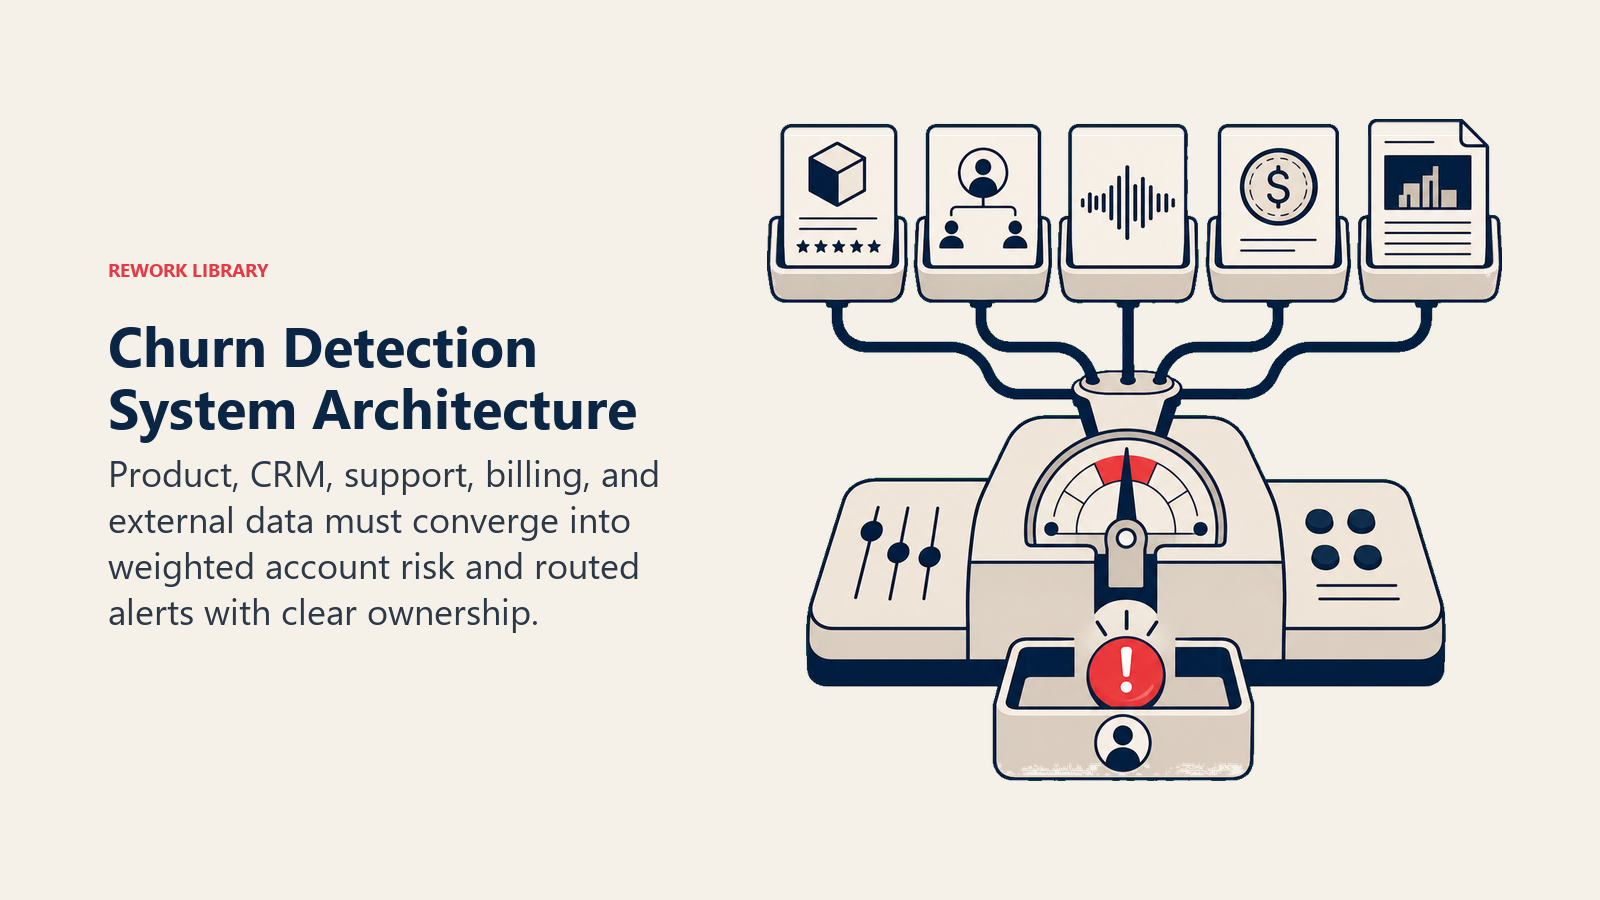
- Product analytics (Amplitude, Mixpanel): Usage signals
- CRM (Salesforce, HubSpot): Engagement signals
- Support (Zendesk, Intercom): Sentiment signals
- Billing (Stripe, Zuora): Payment signals
- External (LinkedIn, press releases): Business signals
Building an effective SaaS tech stack ensures these systems integrate seamlessly for comprehensive monitoring.
Signal aggregation and scoring combines individual indicators into composite risk assessments. Not all signals have equal predictive power. Weight signals by historical churn correlation.
High-weight signals: 30%+ usage decline, competitive mentions, executive sponsor departure Medium-weight signals: Support ticket surge, payment delays, session duration decline Low-weight signals: Single NPS detractor score, isolated missed call
Alert threshold configuration determines when aggregated risk scores trigger intervention. Set thresholds that balance early detection with false positive management:
- Low risk (30-50 score): Monitoring, no immediate action
- Medium risk (50-70 score): CSM outreach within 7 days
- High risk (70-85 score): Manager involvement within 48 hours
- Critical risk (85-100 score): Immediate executive escalation
Escalation routing rules automatically assign at-risk accounts to appropriate team members based on risk level, account value, and team capacity.
Intervention tracking monitors save attempt outcomes to measure detection system effectiveness and intervention playbook performance. Visualization through a SaaS metrics dashboard helps teams monitor detection accuracy and response effectiveness.
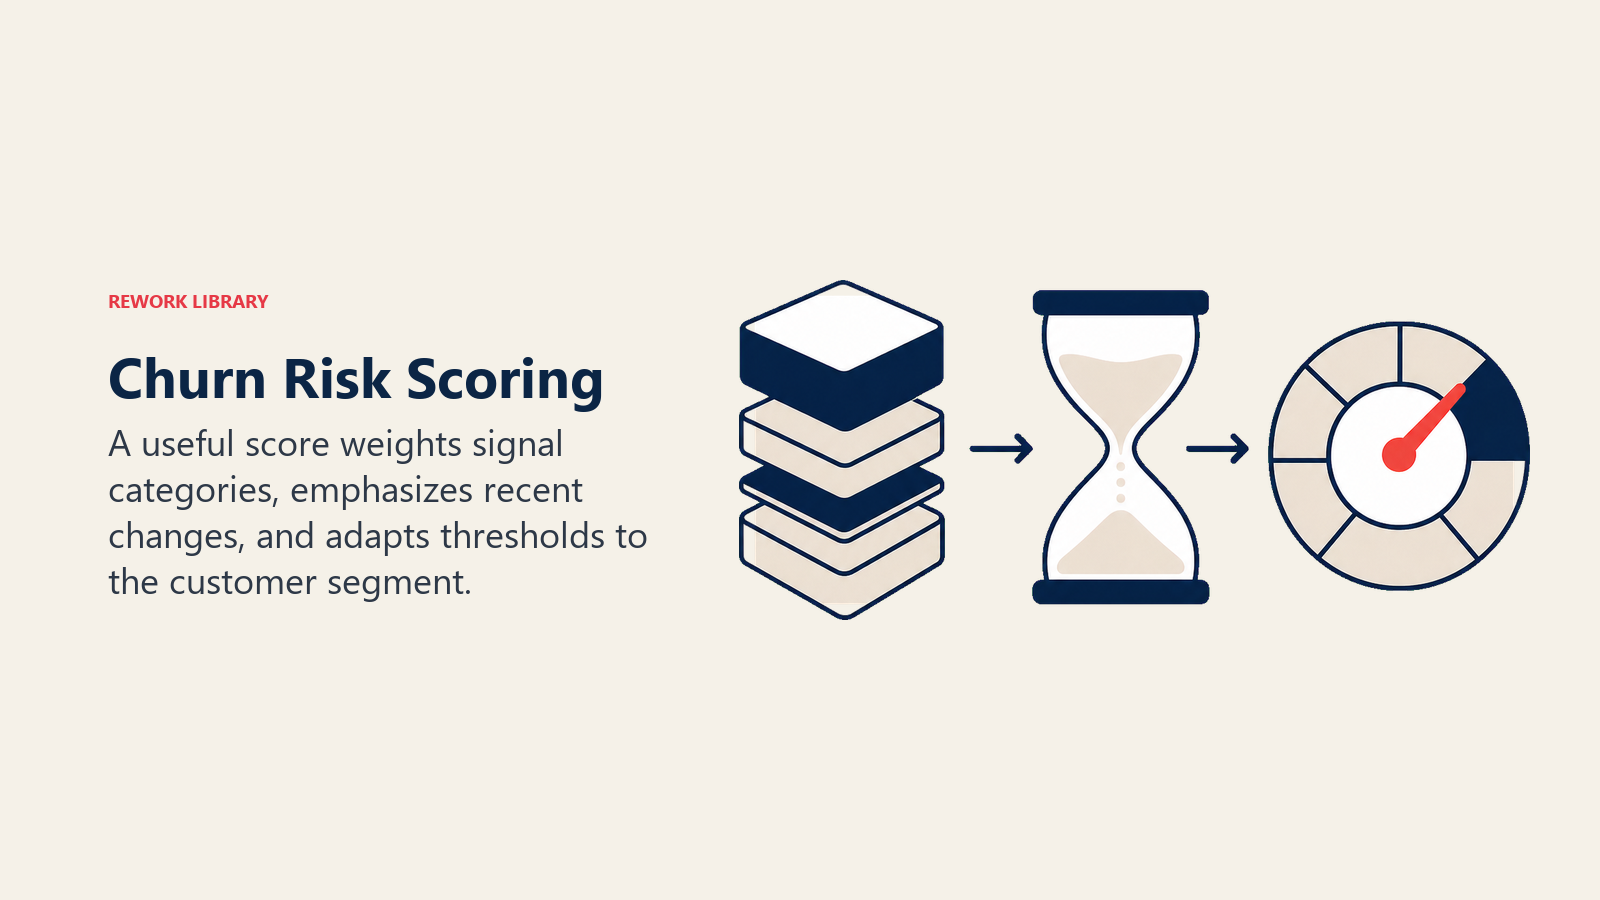
Risk Scoring Methodology
Converting multiple signals into actionable risk scores requires thoughtful methodology. Multi-signal composite risk score combines weighted signals across categories. Example scoring:
- Usage signals: 40% of total score
- Engagement signals: 30% of total score
- Sentiment signals: 20% of total score
- Business signals: 10% of total score
Time-weighted risk calculation emphasizes recent signals over historical patterns. A customer with perfect engagement history but recent disengagement scores higher risk than one with consistent low engagement.
Apply exponential decay: Last 30 days weighted 100%, previous 30 days weighted 50%, prior periods weighted progressively less.
Segment-specific risk models adjust scoring for different customer types. Enterprise customers might weight relationship signals higher. SMB customers might weight usage signals higher due to fewer touchpoints.
Risk band classification groups scores into actionable categories:
- Low (0-30): Healthy, standard engagement
- Medium (30-60): Monitor closely, proactive check-in
- High (60-80): Intervention required, structured save playbook
- Critical (80-100): Emergency response, executive engagement
False positive rate optimization balances catching real risks vs. wasting resources on healthy customers. Target 70-80% true positive rate (correctly identifying actual churn risks) while keeping false positives under 30%.
Operational Response Framework
Risk detection only creates value when it drives differentiated action. Low risk: Monitoring and light touch maintains awareness without heavy intervention. Continue standard engagement cadence. Monitor for score changes that elevate risk level.
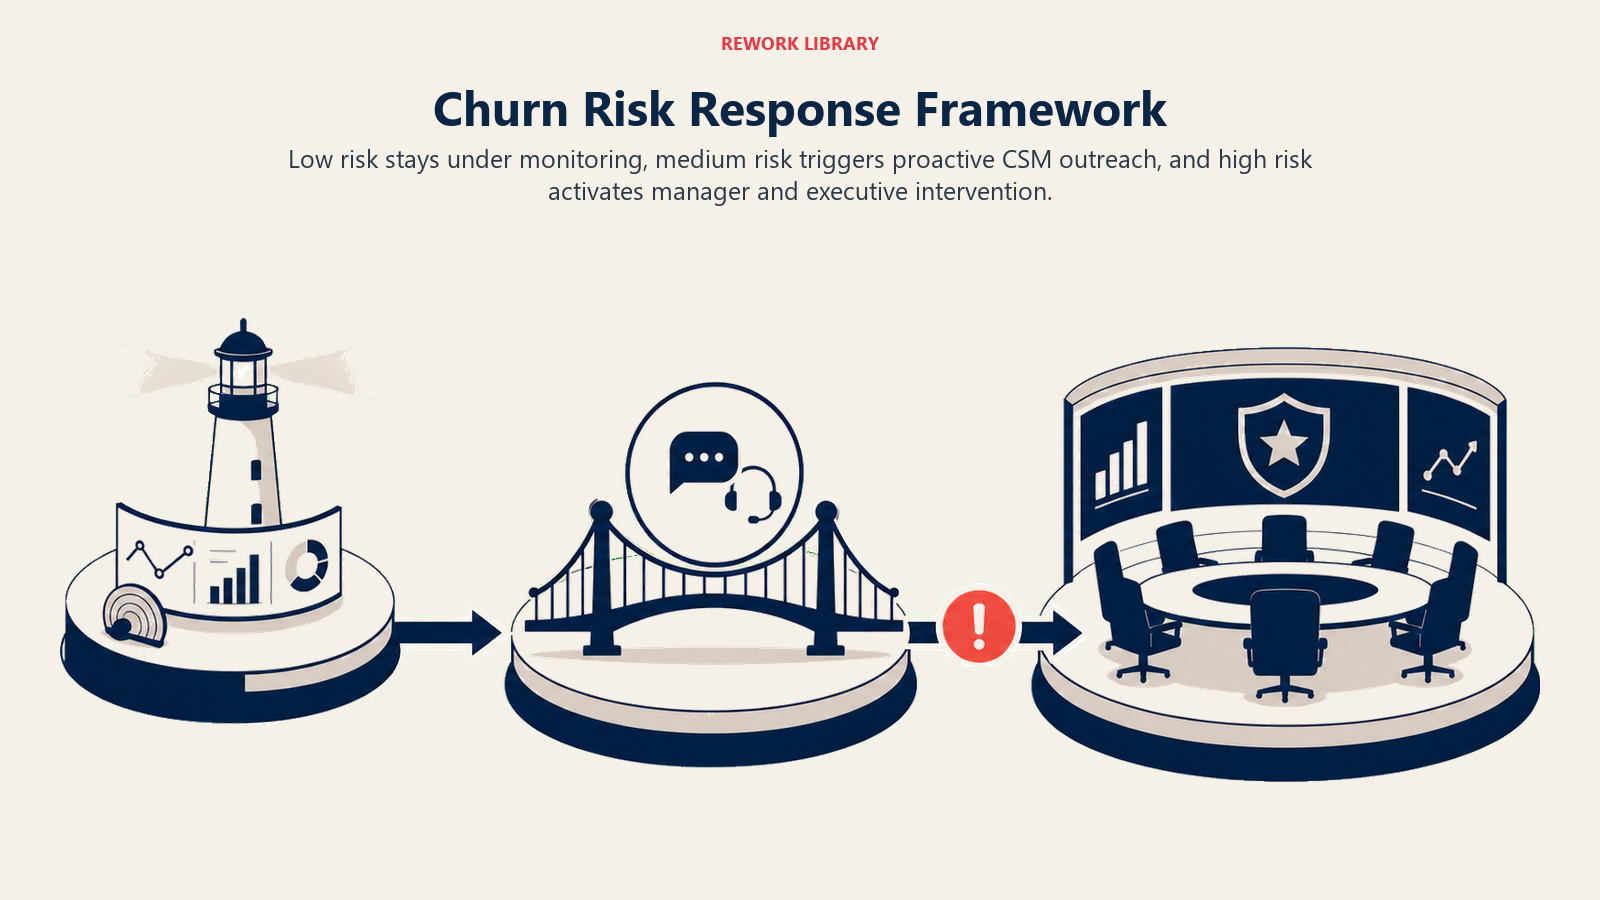
Medium risk: CSM proactive outreach initiates conversations to understand potential issues before they escalate. Schedule value reviews, conduct health check-ins, and reinforce outcomes achieved.
Response SLA: Outreach within 7 days of risk elevation. Resolution plan within 14 days.
High risk: Manager escalation and business review brings additional resources and urgency to at-risk accounts. Customer Success Managers engage their managers. Schedule comprehensive business reviews with customer stakeholders. Develop structured intervention plans.
Response SLA: Manager briefed within 48 hours. Executive business review scheduled within 14 days. Intervention plan executed within 30 days.
Critical risk: Executive intervention and save team mobilizes senior leadership and specialized resources. Account executives, customer success directors, and sometimes company executives engage personally. Offer pricing flexibility, premium support, or product roadmap commitments.
Response SLA: Executive notification within 24 hours. Senior stakeholder engagement within 72 hours. Comprehensive save offer within 7 days.
Response time SLAs by risk level ensures appropriate urgency:
- Low: Standard cadence (no SLA)
- Medium: 7-day outreach, 14-day plan
- High: 48-hour escalation, 14-day review
- Critical: 24-hour notification, 72-hour engagement
Continuous Improvement
Detection systems improve through systematic validation and refinement.
Signal accuracy validation backtests whether signals actually predicted churn. For customers who churned, analyze which signals fired and when. For customers who didn't churn despite high risk scores, identify false positives.
Calculate signal-specific precision (true positives / total positives) and recall (true positives / actual churns).
New signal discovery identifies additional predictive indicators. Interview churned customers to understand what changed before they left. Analyze data for patterns that distinguish churned vs retained customers.
Model refinement adjusts weights and thresholds based on outcomes. Increase weights for high-precision signals. Decrease weights for signals generating excessive false positives.
Intervention effectiveness tracking measures save rates by risk level, signal type, and playbook. Which interventions successfully save at-risk customers? Which waste resources without improving outcomes?
The companies excelling at churn risk detection have moved beyond reactive save attempts to proactive risk management. They identify problems 60-90 days before customers consider leaving, when intervention still succeeds reliably.
Build the detection infrastructure. Surface the signals. Act on the risks. Convert churn reduction from reactive firefighting into proactive risk management powered by early warning systems. Retention is one half of the growth equation; the acquisition and expansion half lives in the B2B SaaS growth model.
Frequently Asked Questions
Why does churn risk detection matter for B2B SaaS growth? Net revenue retention compounds. A company losing 3% of revenue monthly to churn has to acquire that much just to stand still. Catching at-risk accounts 60-90 days early lets you save them while save rates are still 40-60%, which protects the retention base that growth is built on.
How early can you detect churn risk? Most predictive signals appear 60-90 days before cancellation. Early signals like gradual usage decline or slower email responses create an intervention window. Late indicators like contract-term questions or content deletion appear days out and only allow damage control.
What are the four churn signal categories? Usage signals (login frequency, feature abandonment, session duration), engagement signals (unresponsive outreach, canceled reviews, champion loss), sentiment signals (NPS detractors, negative ticket tone, competitive mentions), and business signals (budget cuts, layoffs, leadership changes, payment delays).
What is a good churn risk score threshold? A common setup is low (0-30) for healthy accounts, medium (30-60) for proactive check-ins, high (60-80) for a structured save playbook, and critical (80-100) for executive escalation. Aim for a 70-80% true positive rate while keeping false positives under 30%.
Learn More
Enhance your retention strategy with these complementary resources:
- Usage Monitoring & Alerts - Implement automated tracking systems to identify engagement changes before they become churn risks
- Cancellation Flow Optimization - Design cancellation experiences that recover at-risk customers and gather actionable feedback
- Win-Back Campaigns - Re-engage churned customers with targeted campaigns based on their historical usage patterns and churn reasons
- Net Revenue Retention (NRR) - Understand how churn prevention contributes to overall revenue retention and expansion metrics

Senior Operations & Growth Strategist
On this page
- Understanding Churn Risk Detection Fundamentals
- The Four Signal Categories
- Usage Signal Detection
- Engagement Signal Detection
- Sentiment Signal Detection
- Business Signal Detection
- Detection System Architecture
- Risk Scoring Methodology
- Operational Response Framework
- Continuous Improvement
- Frequently Asked Questions
- Learn More