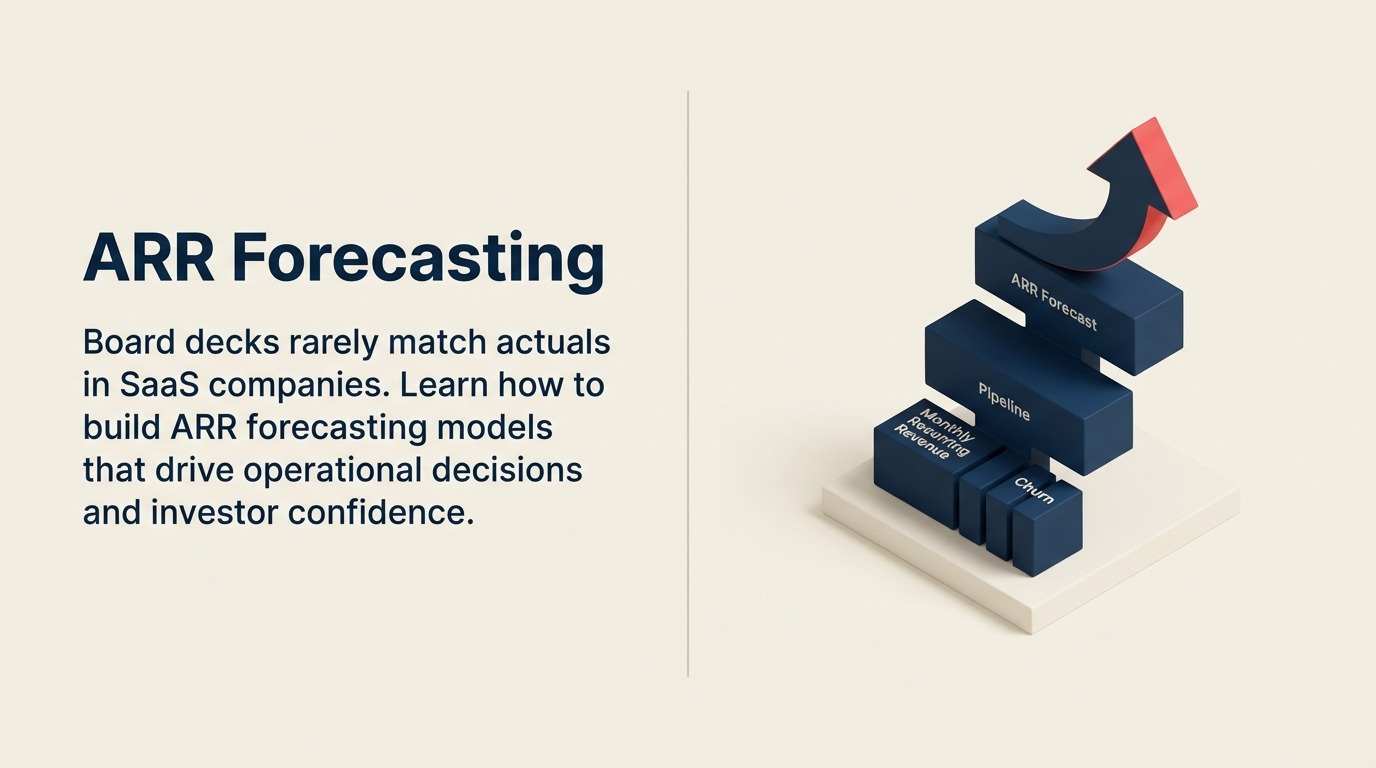
ARR Forecasting: Building Predictable Revenue Models for SaaS
Turn this article into takeaways for your work.
Each assistant summarizes the article only for you and suggests best practices for your work.
Your board deck shows $22M ARR projection for the quarter. Two weeks before quarter-end, you're tracking to $19.5M. The CFO scrambles to explain the gap. The CEO questions whether the forecast was ever realistic. Sales swears their pipeline justified the number.
This is the forecast credibility gap that plagues SaaS companies. Forecasts are built optimistically, reality disappoints, and trust erodes with every missed projection.
The problem isn't that forecasting is hard, though it is. The problem is that most companies lack systematic methodology for building forecasts that accurately model reality. They use gut feel, political negotiation, and hope rather than rigorous analysis of pipeline, conversion rates, and customer behavior.
Building reliable ARR forecasts requires understanding the components that drive revenue, applying consistent methodologies, and maintaining data discipline that makes forecasts testable and improvable over time.
When done well, forecasting becomes a strategic capability that enables proactive decision-making, accurate resource allocation, and board relationships built on trust rather than excuse-making. This discipline becomes foundational to your SaaS economics and unit metrics framework.
ARR Forecasting Fundamentals
Before building models, understand what you're forecasting and why it matters.
ARR vs Revenue Recognition
Annual Recurring Revenue (ARR) represents the run-rate value of subscription contracts, not the revenue you can recognize under GAAP accounting rules.
If a customer signs a $120K annual contract on December 15th, your ARR increases by $120K immediately. But revenue recognition happens ratably over 12 months, you recognize only half a month ($5K) in December revenue.
ARR forecasts drive operational planning: headcount decisions, marketing spend, quota setting. Revenue recognition forecasts drive financial statements and investor reporting.
SaaS companies need both, but this article focuses on ARR forecasting because it's more actionable for operational decision-making.
Why ARR Matters for SaaS
ARR is the single most important metric for SaaS companies because it represents recurring revenue momentum. Unlike one-time sales, ARR compounds, this quarter's ARR becomes next quarter's starting point.
Growth in ARR requires winning new customers and expanding existing ones faster than customers churn. Understanding this balance sheet enables strategic resource allocation decisions and is central to evaluating your B2B SaaS growth model performance.
Forecast Accuracy Benchmarks
What accuracy should you target? Context matters:
Current quarter forecasts (with 3-4 weeks remaining) should be within ±3% of actuals. You have enough visibility into closing deals to be precise.
Next quarter forecasts should be within ±10% of actuals. Pipeline coverage and historical conversion rates enable reasonable accuracy.
Annual forecasts typically land within ±15-20% of actuals, improving as the year progresses and you incorporate actual results.
These benchmarks assume mature forecasting practices. Early-stage companies with limited historical data will have wider variance initially.
Common Forecasting Mistakes
Most forecast errors stem from predictable mistakes:
Ignoring historical patterns: Using gut feel instead of actual conversion rates, win rates, and sales cycle length.
Stale pipeline: Including opportunities that will never close because sales hasn't updated status.
Sandbagging: Sales teams artificially lowering forecasts to make targets easier to beat.
Happy ears: Sales (or leadership) being overly optimistic about deal timing and probability.
Forgetting churn: Modeling new customer ARR without accounting for churned customer ARR.
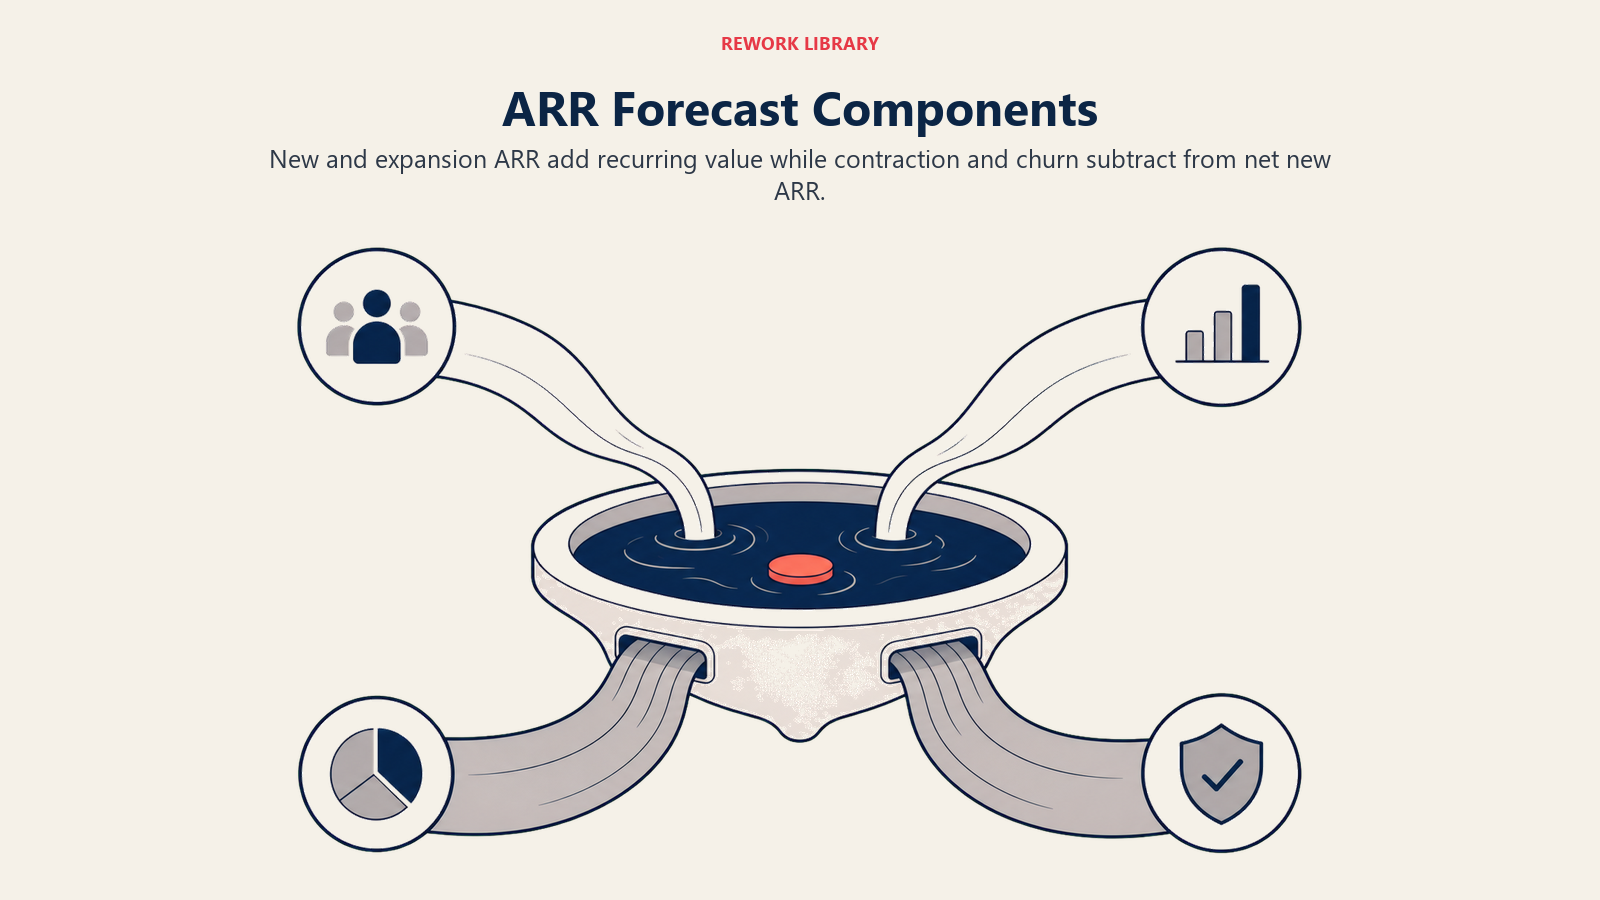
ARR Components to Model
ARR movement has four components. Model each separately for accuracy.
New ARR (New Customers)
This is ARR from customers who weren't customers at the start of the period. Model new ARR based on your sales pipeline, conversion rates, average deal size, and sales capacity.
Expansion ARR (Upsell, Cross-Sell)
This is additional ARR from existing customers who increase their spending. It includes seat expansion, product upsells, tier upgrades, and usage-based growth.
Expansion ARR is often more predictable than new ARR because you have behavioral data about customer usage and engagement. Building a systematic expansion revenue strategy significantly improves forecast accuracy for this component.
Contraction ARR (Downgrades)
This is ARR lost when customers reduce their spending without fully churning. They might drop from Enterprise to Professional tier, reduce seat count, or decrease usage-based consumption.
Contraction is often overlooked in forecasts but significantly impacts net growth.
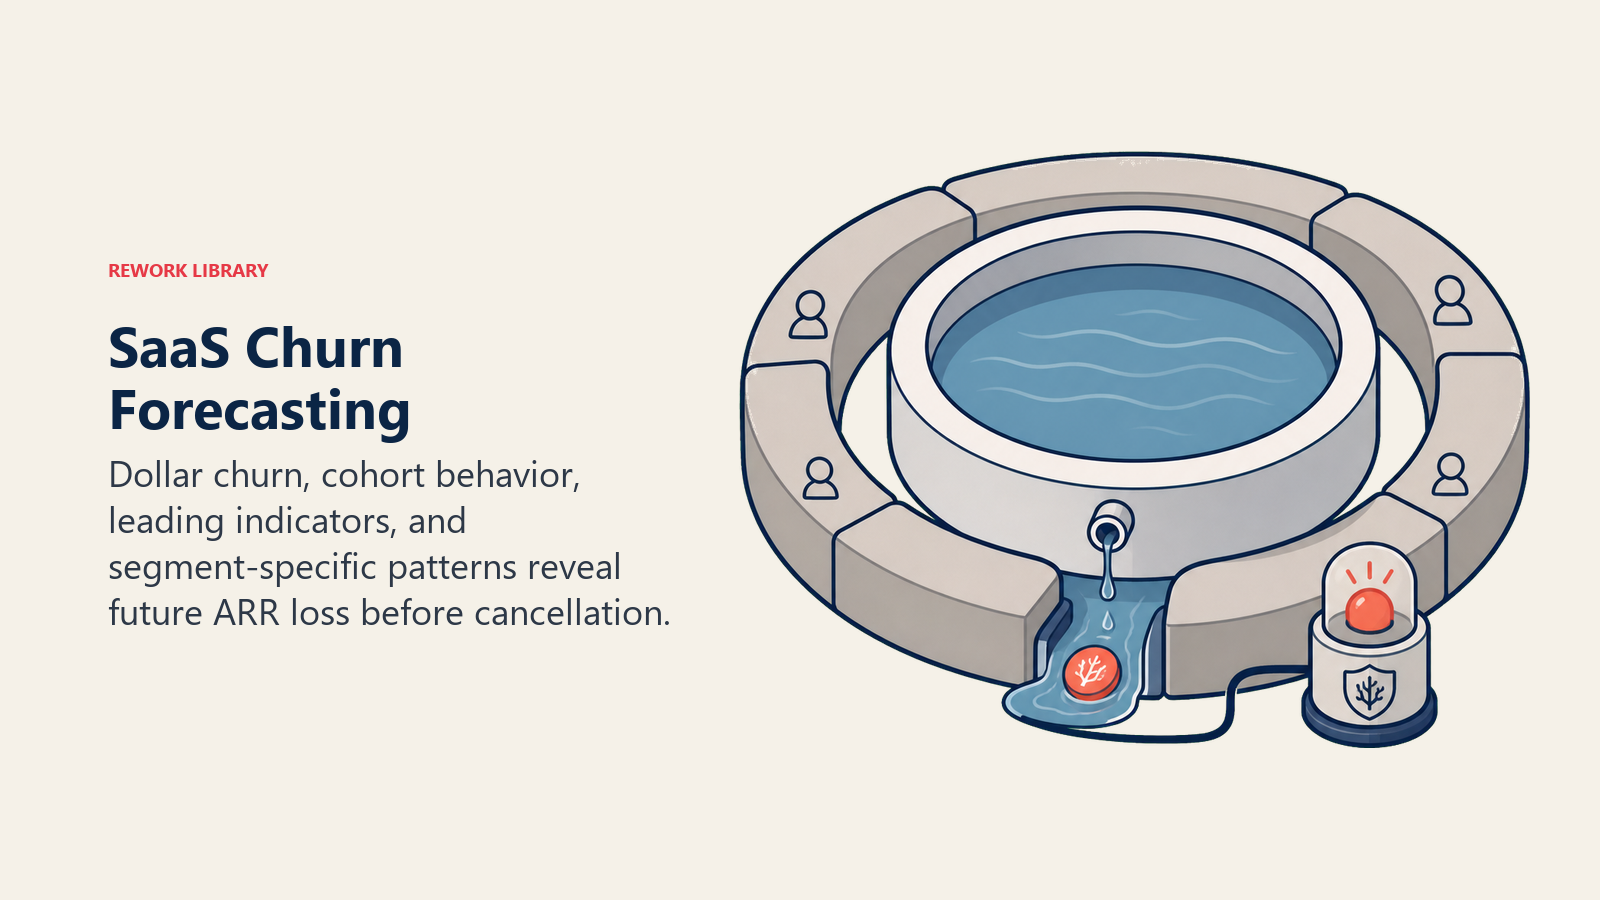
Churn ARR (Lost Customers)
This is ARR from customers who cancel completely. Model churn based on cohort analysis, customer health data, and renewal tracking. Effective churn risk detection enables you to forecast churn 60-90 days in advance.
Net New ARR (The Sum)
Net New ARR = New ARR + Expansion ARR - Contraction ARR - Churn ARR
This is the number that drives growth. Your ARR next quarter equals current ARR plus Net New ARR.
Building the New ARR Model
New customer acquisition is typically the most complex component to forecast.
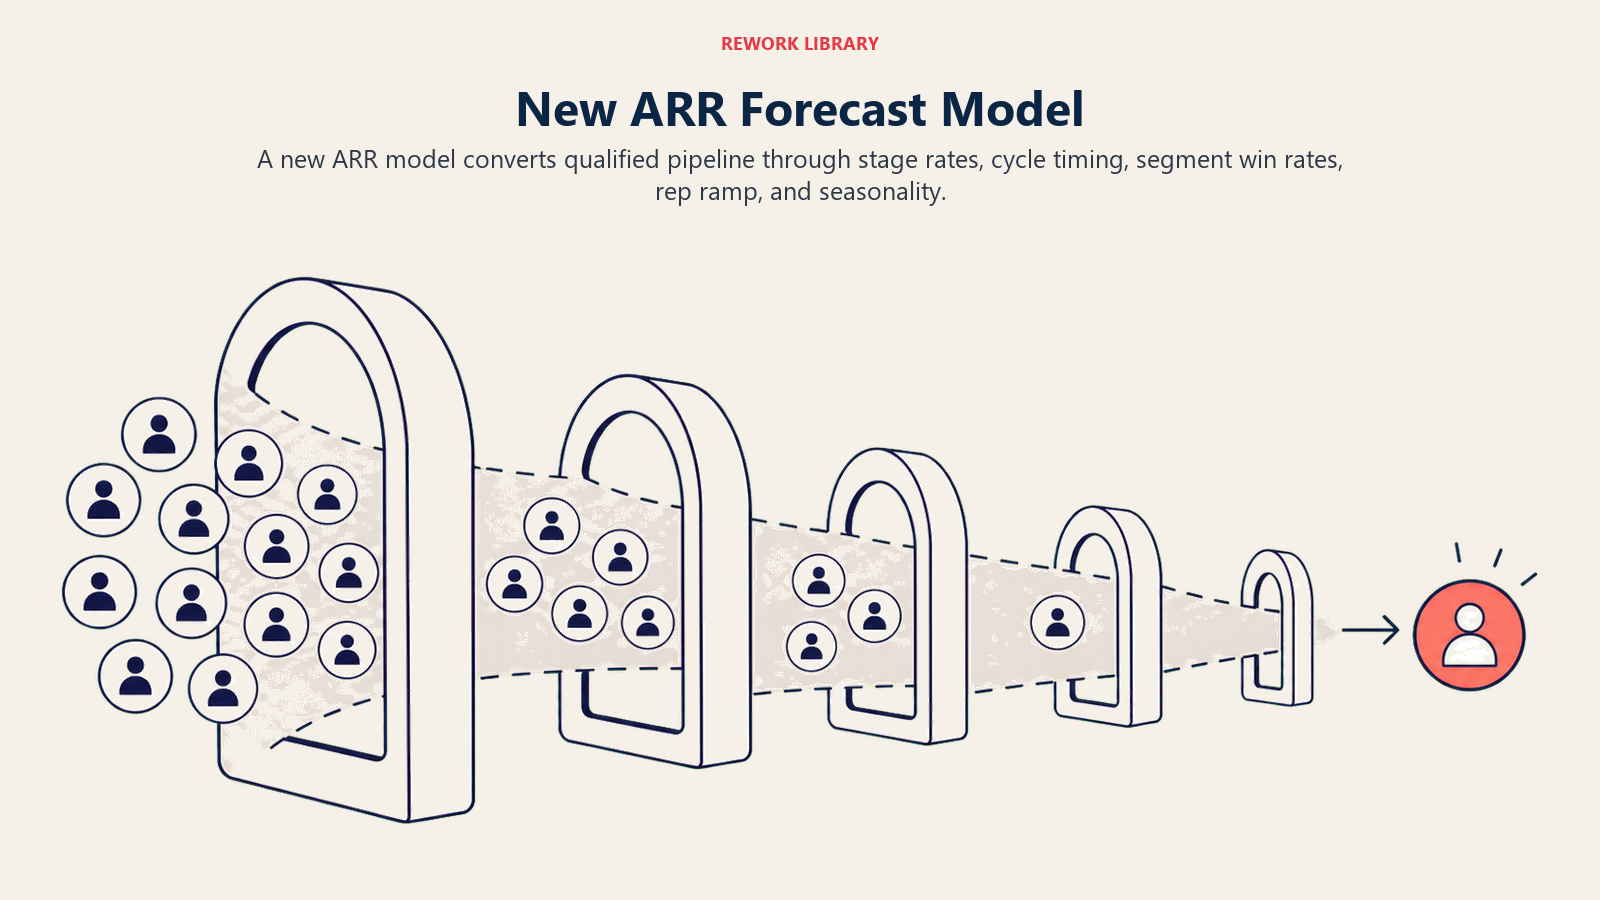
Pipeline-Based Forecasting
Start with your current pipeline segmented by stage. For each stage, calculate historical conversion rates to close and average time in stage.
If you have 50 opportunities in the "Demo Scheduled" stage worth $2M total ARR, and historically 30% of demo opportunities reach "Proposal," you can project $600K moving to the next stage.
Repeat this calculation through every stage to build bottoms-up forecasts.
Stage Conversion Rates
Calculate conversion rates between stages based on historical data. Don't use gut feel or aspirational targets, use actual results from the past 3-6 quarters.
Your conversion rates might look like:
- Lead to Opportunity: 15%
- Demo to Proposal: 45%
- Proposal to Negotiation: 60%
- Negotiation to Closed-Won: 75%
Track these rates monthly. When they change significantly, investigate why and adjust forecasts accordingly. Understanding your SaaS marketing funnel conversion patterns is critical for accurate pipeline-based forecasting.
Sales Cycle Length Analysis
How long do opportunities typically stay in each stage? Measure actual durations, not what you wish they were.
If opportunities spend an average of 45 days in the Demo stage, opportunities that entered Demo last week won't close this quarter, they'll close next quarter.
Sales cycle length determines how much pipeline you need to hit targets. If your average cycle is 90 days and you need $3M in Q4, you need sufficient pipeline entering Q2 to give deals time to progress.
Win Rate by Segment/Source
Not all opportunities are created equal. Track win rates by:
- Lead source (inbound, outbound, partner, referral)
- Company size (SMB, mid-market, enterprise)
- Industry vertical
- Deal size range
Apply segment-specific win rates to pipeline rather than using blended averages. Your enterprise deals might close at 35% while SMB deals close at 65%.
Ramp Assumptions for New Reps
New sales reps aren't productive immediately. They typically take 3-6 months to ramp to full productivity.
Factor ramp time into forecasts. If you hired three reps in January, don't assume they'll contribute full quota in Q1. Model graduated productivity: Month 1-2: 10% of quota, Month 3-4: 40% of quota, Month 5-6: 70% of quota, Month 7+: 100% of quota.
Seasonality Factors
Most SaaS businesses have seasonality. Enterprise deals often close in Q4 due to budget cycles. SMB might be stronger in Q1 when small businesses have renewed focus.
Identify your seasonal patterns by analyzing historical results. Adjust forecasts to reflect these patterns rather than assuming linear growth.
Expansion ARR Forecasting
Expansion is often more predictable than new customer acquisition because you have customer usage data.
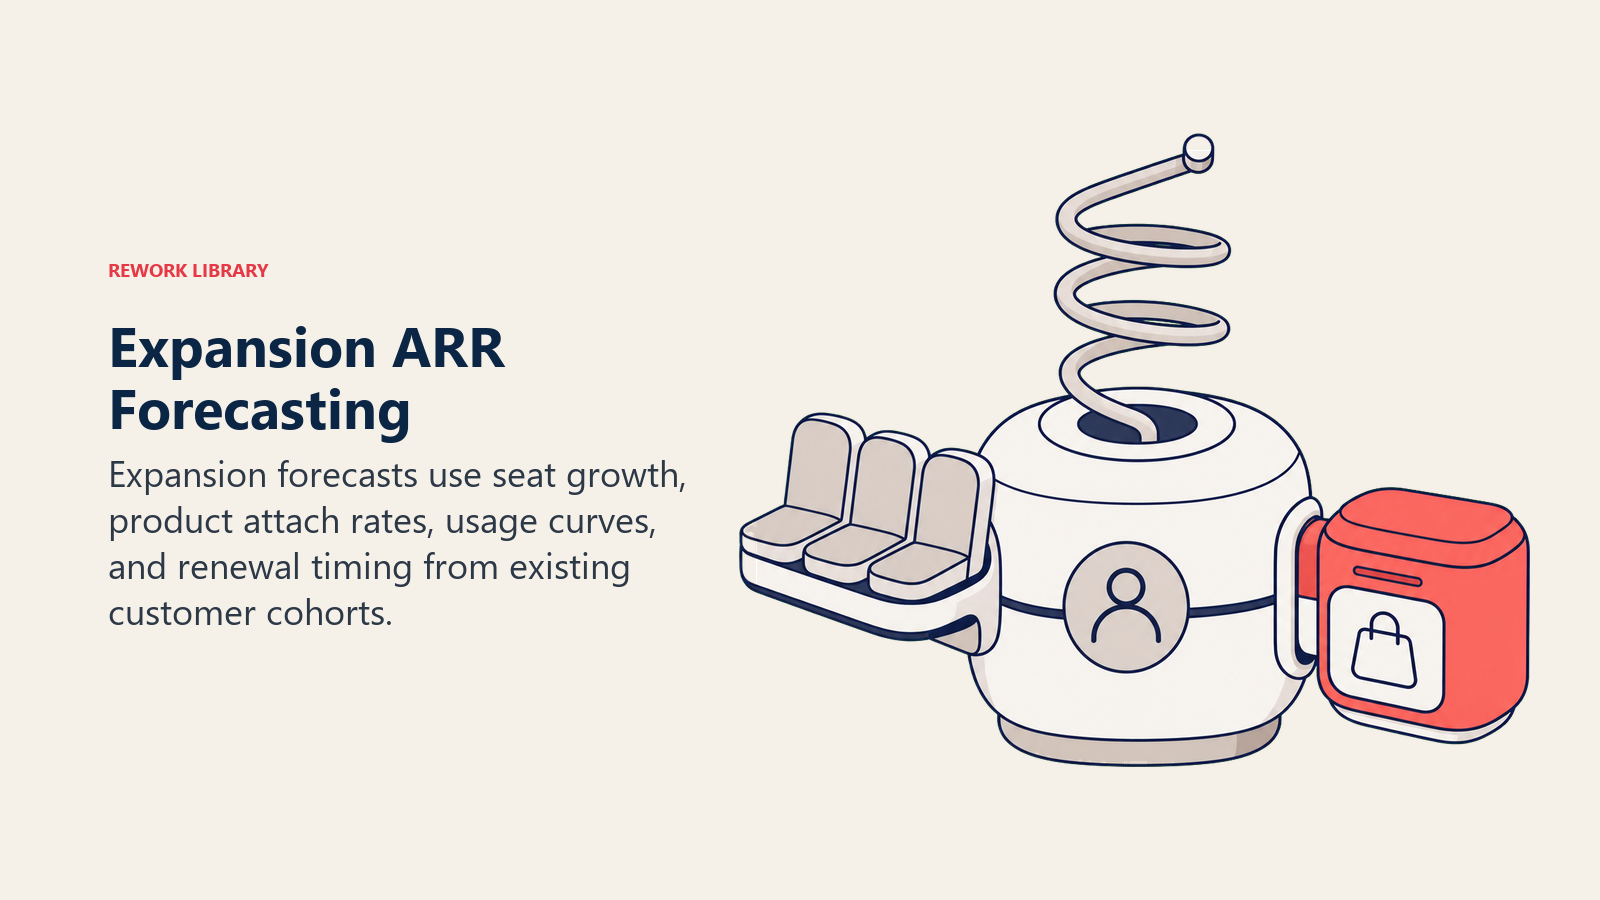
Seat Expansion Patterns
For seat-based pricing, analyze historical seat growth patterns. What percentage of customers add seats within their first year? How many seats do they typically add?
If 40% of customers add an average of 5 seats within 12 months of contract signature, you can forecast expansion based on your new customer cohorts. A well-designed seat expansion strategy provides predictable growth you can model accurately.
Product Upsell Rates
If you have multiple products, track attach rates and upsell timing. What percentage of customers buy Product B after starting with Product A? How long after initial purchase?
Use this historical data to forecast cross-sell revenue from your existing customer base.
Usage-Based Growth Curves
For usage-based pricing (API calls, storage, transactions), analyze how customer usage grows over time.
Plot usage growth curves by cohort. Customers might consume 100 units in Month 1, 140 units in Month 3, 200 units in Month 6. These curves enable forecasting organic expansion as usage grows.
Expansion Cycle Timing
When do expansion conversations typically happen? Many companies see expansion cluster around:
- Annual renewal discussions
- Quarterly business reviews
- Feature releases that unlock new use cases
- Organizational changes (new hires, team growth)
Model expansion timing based on these patterns rather than assuming it happens randomly.
Cross-Sell Attach Rates
What percentage of customers who buy Product A eventually buy Product B? Track these attach rates and the typical time lag between purchases.
If 30% of Product A customers buy Product B within 18 months, you can forecast Product B expansion from your Product A customer cohorts.
Churn Modeling
Churn destroys growth. Model it accurately to understand net ARR movement.
Logo Churn vs Dollar Churn
Logo churn measures what percentage of customers cancel. If you start the month with 100 customers and 5 cancel, logo churn is 5%.
Dollar churn (or ARR churn) measures what percentage of ARR is lost. If those 5 customers represented $10K of your $1M ARR base, dollar churn is 1%.
Dollar churn matters more for forecasting because it directly impacts ARR. A company with 5% logo churn but 1% dollar churn (small customers churning) is much healthier than one with 5% logo churn and 8% dollar churn (large customers churning). This distinction is critical when measuring net revenue retention performance.
Cohort-Based Analysis
Different customer cohorts have different churn rates. Analyze churn by:
- Customer acquisition period (Q1 2023 cohort, Q2 2023 cohort)
- Company size
- Industry
- Contract value
- Lead source
This analysis reveals patterns like "enterprise customers acquired through partnerships have 12% annual churn while enterprise customers from outbound have 28% churn."
Apply cohort-specific churn rates to your renewal forecasts rather than using blended averages.
Leading Indicators
Don't wait for customers to cancel to forecast churn. Use leading indicators:
- Declining product usage
- Decreasing engagement with CS
- Support tickets about "how to cancel"
- Budget cuts or reorganizations
- Champion departures
Build predictive churn models using these signals to forecast churn 60-90 days before it happens. This enables intervention and more accurate forecasting. Implementing customer health scoring provides the foundation for predictive churn modeling.
Seasonal Patterns
Churn often has seasonality. B2B SaaS might see lower churn in Q1-Q3 when budgets are active and higher churn in Q4 when customers cut costs heading into new fiscal years.
SMB SaaS might see spikes around holidays when small businesses close or pause operations.
Identify your patterns and incorporate them into churn forecasts.
Segment-Specific Rates
Different segments have different churn characteristics:
- SMB: 30-50% annual churn (2.5-4% monthly)
- Mid-Market: 15-25% annual churn (1.2-2% monthly)
- Enterprise: 8-15% annual churn (0.7-1.2% monthly)
Apply appropriate rates to each segment rather than using company-wide averages.
Voluntary vs Involuntary Churn
Voluntary churn: Customers actively choose to cancel due to dissatisfaction, budget cuts, or switching to competitors.
Involuntary churn: Customers churn due to payment failures, credit card expirations, or business closure.
Involuntary churn is often 20-40% of total churn for SMB SaaS and can be reduced through better payment infrastructure. Model these components separately because interventions differ.
Forecasting Methodologies
Several approaches exist for building forecasts. Most companies use hybrid methods.
Bottom-Up (Rep-by-Rep)
Sales reps provide forecasts for their territories. You aggregate individual forecasts to build company forecast.
Advantages: Reps have best visibility into deal status and customer conversations.
Disadvantages: Reps have incentives to sandbag or be overly optimistic. Forecasts are subjective and hard to challenge.
Top-Down (Market-Based)
Start with market size and growth rate, estimate achievable market share, and work down to revenue targets.
Advantages: Provides strategic context and ensures ambition aligns with market opportunity.
Disadvantages: Disconnected from operational reality. Doesn't account for actual pipeline or capacity constraints.
Trend-Based (Historical)
Extrapolate from historical growth rates. If you've grown 10% quarter-over-quarter for the past four quarters, forecast 10% growth next quarter.
Advantages: Simple and based on actual performance.
Disadvantages: Assumes future will look like past. Doesn't account for changes in strategy, team size, or market conditions.
Cohort-Based (Retention Curves)
Model ARR retention curves for customer cohorts and layer new customer acquisition on top.
Advantages: Accurately models retention dynamics and expansion behavior.
Disadvantages: Requires significant historical data and sophisticated analysis.
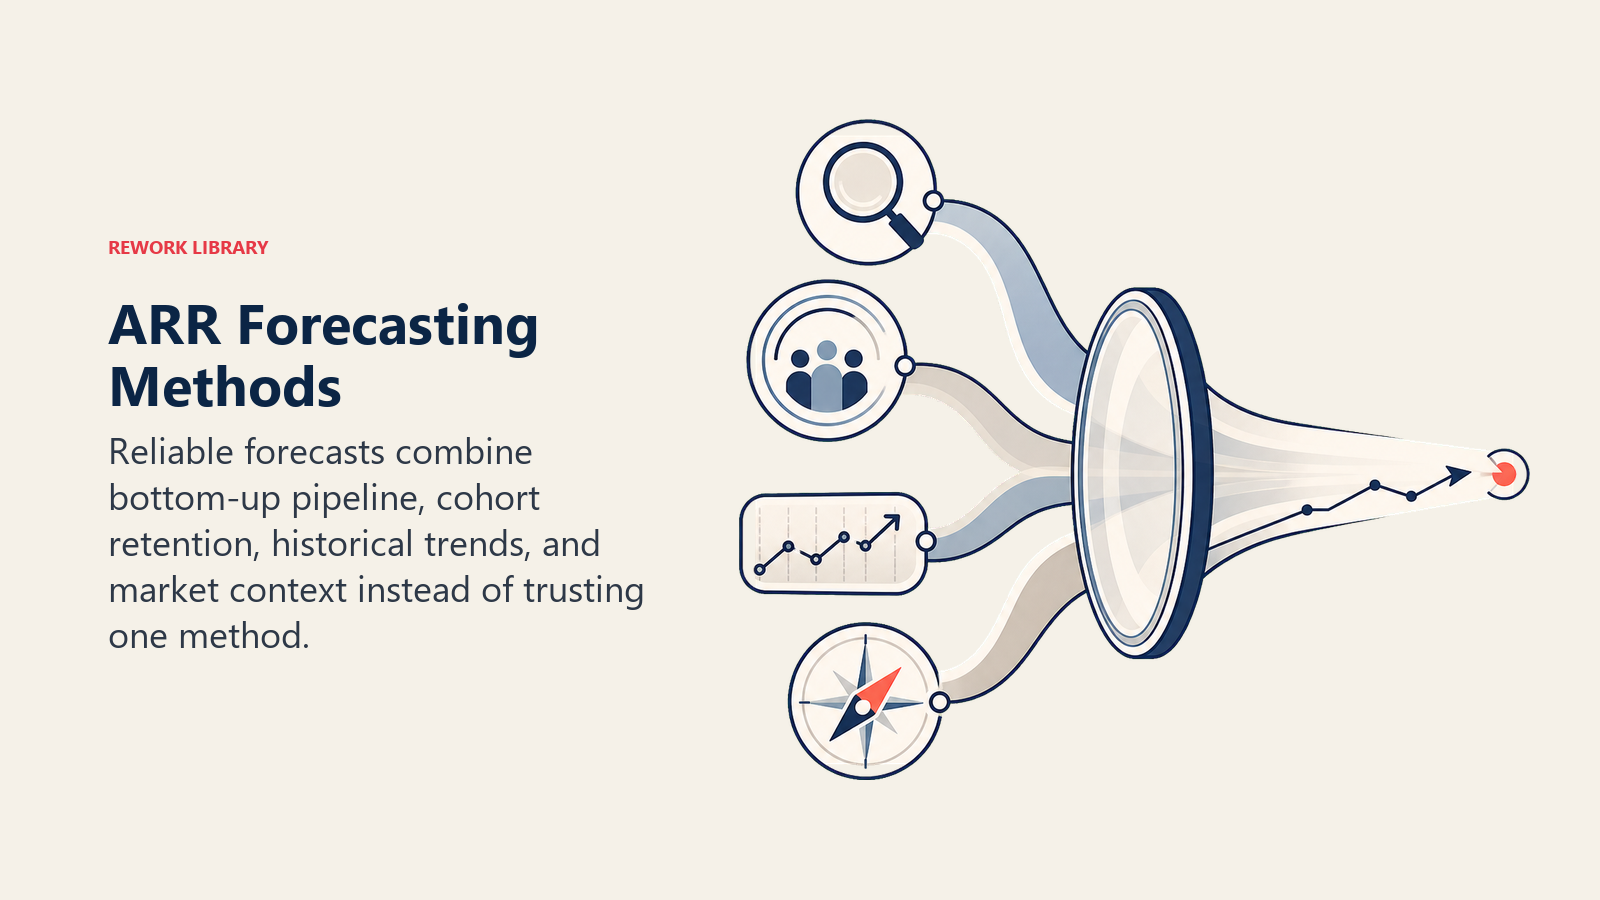
Hybrid Approach
Most successful forecasts combine methods:
- Use bottom-up pipeline analysis for near-term forecasts (current and next quarter)
- Apply cohort-based modeling for retention and expansion
- Validate against top-down market opportunity to ensure targets are achievable
- Calibrate against historical trends to identify unrealistic assumptions
The Three-Forecast Model
Presenting a single forecast implies false precision. Use three forecasts that reflect uncertainty ranges.
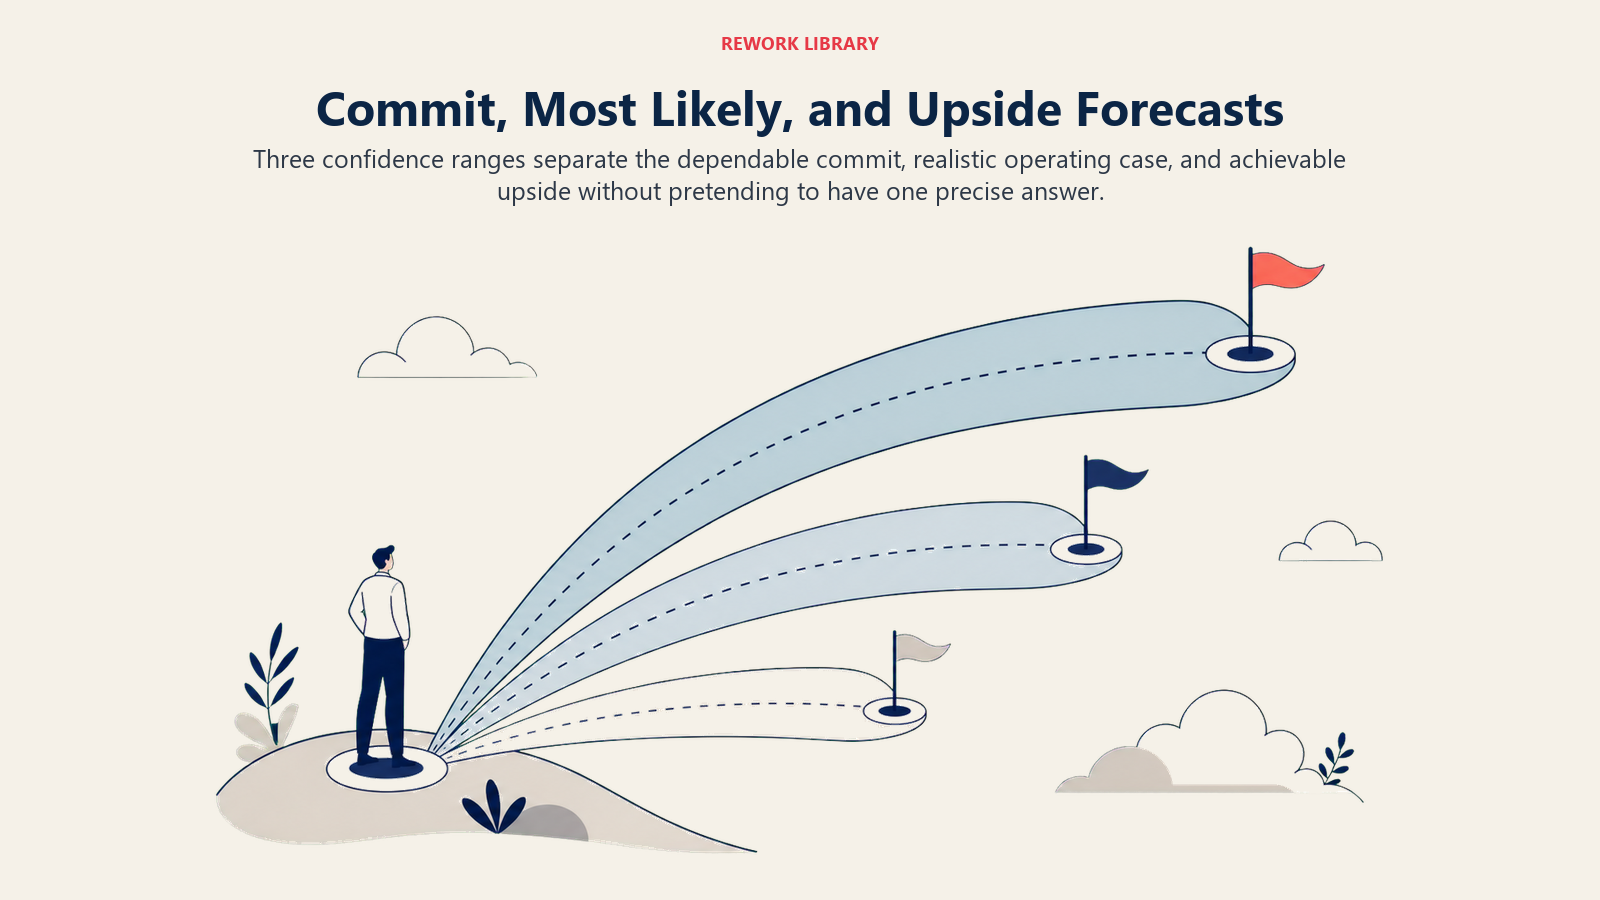
Commit Forecast (90%+ Confidence)
This is what you're nearly certain to achieve. Include only opportunities with:
- Signed contracts not yet recognized as ARR
- Late-stage deals with verbal commitments
- Renewals with high probability
- Extremely predictable churn and expansion
This forecast should be conservative. Missing your commit forecast damages credibility severely.
Most Likely Forecast (50% Confidence)
This is your realistic projection based on current pipeline and historical conversion rates. Include:
- All commit opportunities
- Mid-stage pipeline at historical conversion rates
- Expected renewals based on health scores
- Forecasted churn based on leading indicators
This forecast should be accurate more often than not. It drives operational planning and resource allocation.
Upside Forecast (Stretch Goals)
This is what's possible if things go well. Include:
- All most likely opportunities
- Early-stage pipeline at optimistic conversion rates
- Expansion opportunities under discussion
- Lower churn if interventions succeed
This forecast should be achievable perhaps 20-30% of the time. It represents your best-case scenario that guides stretch goals and aggressive hiring.
How to Present to Board
Present all three forecasts with clear definitions of what each includes. Show historical accuracy of each forecast type to build confidence.
Explain variances when actuals differ from forecasts. "We committed to $18M, forecasted $20M, achieved $19.2M. The shortfall from forecast came from two enterprise deals that slipped to next quarter due to procurement delays."
This transparency builds trust over time even when forecasts aren't perfect.
Time Horizons
Different time horizons require different methodologies and have different accuracy expectations.
Weekly Forecasts (Current Quarter)
With 4-12 weeks remaining in the quarter, you should have high accuracy. Focus on:
- Deal inspection (reviewing every significant opportunity)
- Close date validation
- Risk identification
- Resource allocation to close gaps
Monthly Forecasts (Next Quarter)
Looking one quarter out, use pipeline coverage analysis. You typically need 3-5x pipeline coverage for the ARR target based on your historical conversion rates.
If you need $5M ARR next quarter and your pipeline-to-close rate is 25%, you need $20M in qualified pipeline.
Quarterly Forecasts (Annual Plan)
For the full year, combine top-down market analysis with bottom-up capacity planning. How many sales reps will you have? What's their expected productivity? How much expansion should existing customers generate?
Validate whether these numbers can realistically deliver your annual target.
Annual Forecasts (3-Year Plan)
Long-term forecasts are strategic exercises, not operational tools. Focus on:
- Market size and growth trajectory
- Competitive positioning
- Required investments in product, sales, marketing
- Unit economics at scale
Don't pretend to forecast quarterly results three years out. Show directional targets and key assumptions.
Data Requirements
Garbage in, garbage out. Forecasting accuracy depends on data quality.
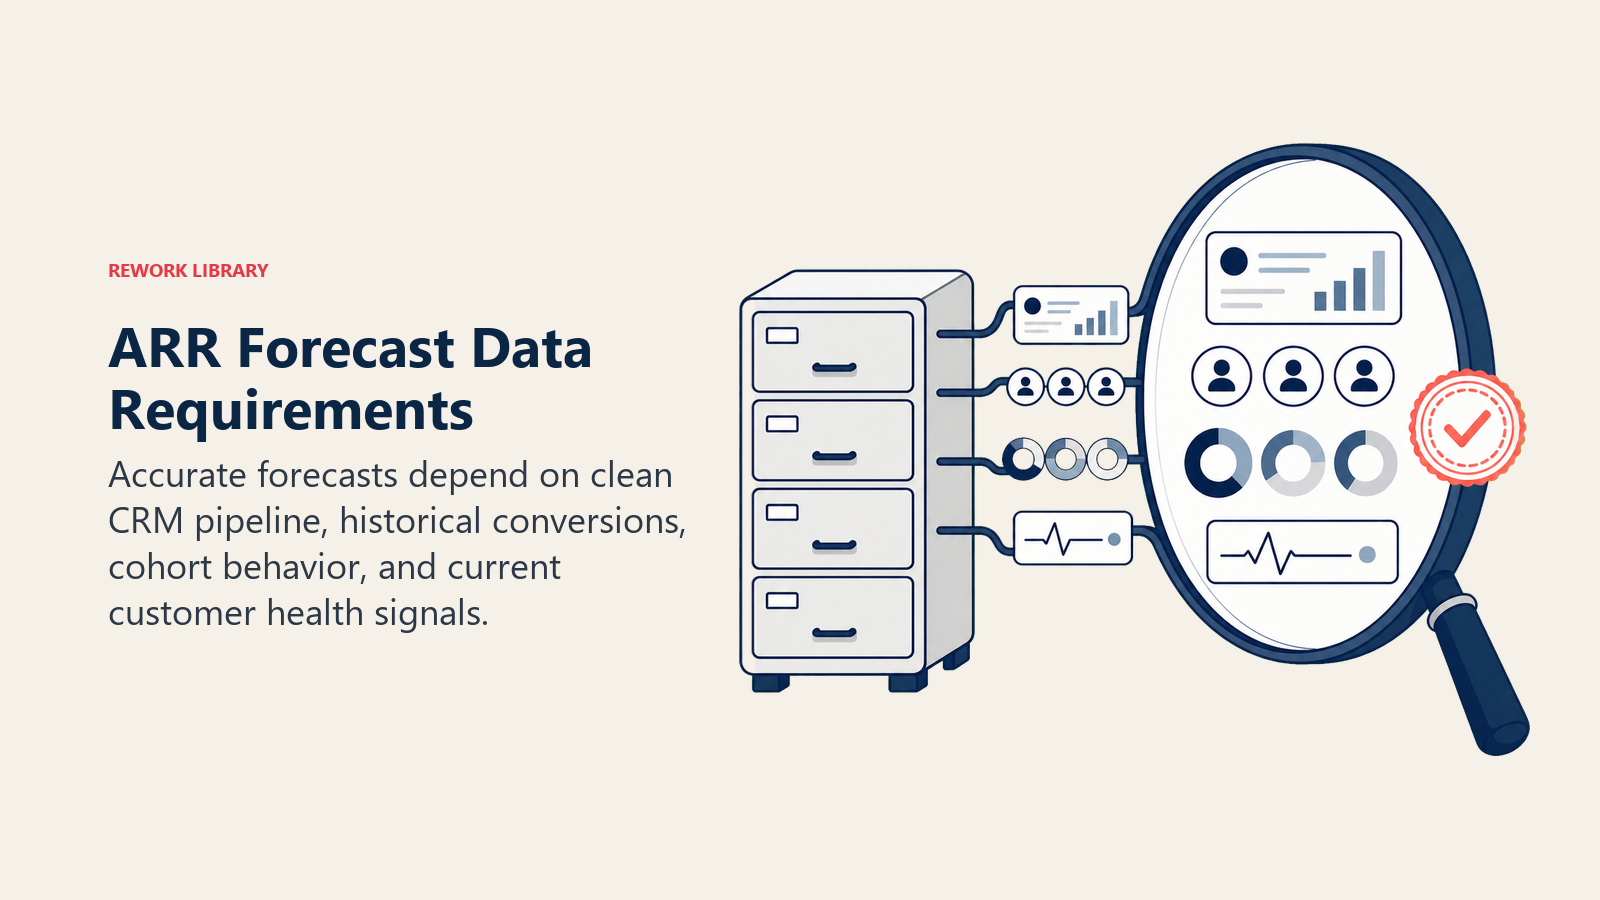
CRM Pipeline Hygiene
Your pipeline data must be accurate and current. This requires:
- Regular opportunity reviews where sales updates status, close dates, and probability
- Automated reminders for stale opportunities
- Mandatory fields that ensure complete information
- Regular pipeline audits to identify and clean bad data
Most CRMs have 20-40% junk opportunities that will never close but clutter forecasts. Clean them out ruthlessly.
Historical Conversion Data
You need at least 2-4 quarters of historical data to calculate reliable conversion rates. Track:
- Stage-to-stage conversion rates
- Overall win rates
- Sales cycle length by segment
- Average deal size trends
Store this data in your RevOps reporting infrastructure, not just tribal knowledge.
Customer Cohort Data
For churn and expansion forecasting, maintain detailed cohort data:
- ARR by customer by month
- Retention curves for each cohort
- Expansion patterns
- Churn reasons and timing
This data enables sophisticated retention and expansion modeling that makes forecasts significantly more accurate.
Renewal Tracking
Maintain a renewal pipeline separate from new business pipeline. Track:
- Upcoming renewal dates
- Renewal risk scores
- Expansion opportunities attached to renewals
- Historical renewal rates by segment
Many companies build separate renewal forecasts that feed into overall ARR models.
Sales Capacity Model
Know how many quota-carrying reps you have, their productivity levels, and their ramp status. Your new ARR capacity is:
Number of reps × Average productivity × Ramp factor
If you have 10 reps at $1M annual quota but two are new and ramping at 40%, your effective capacity is $9.2M, not $10M.
Forecast Review Process
Forecasting isn't a monthly spreadsheet exercise. It's an ongoing discipline with regular reviews.
Weekly Pipeline Reviews
Sales leadership reviews pipeline with individual reps, focusing on:
- Key deal progression (or lack thereof)
- Close date validation
- Risk identification
- Required support and resources
These reviews keep pipeline fresh and identify problems early.
Monthly Forecast Calls
Revenue leadership (sales, marketing, CS, RevOps) reviews:
- Current quarter forecast update
- Next quarter pipeline coverage
- Gaps requiring action
- Marketing lead generation requirements
- Resource allocation needs
These calls align the organization around forecast reality and required actions.
Quarterly Business Reviews
Executive team and board review:
- Prior quarter actuals vs forecast
- Variance analysis and explanations
- Current year forecast update
- Strategic implications
- Required course corrections
QBRs are accountability moments where forecasting accuracy (or lack thereof) gets examined closely.
Board Reporting Cadence
Present forecast updates to the board monthly or quarterly depending on your board cadence. Show:
- Three forecast model (commit, likely, upside)
- Actuals vs previous forecasts
- Variance explanations
- Forward-looking forecast with key assumptions
Transparency about methodology and assumptions builds trust even when forecasts miss.
Technology Stack
Modern tools make forecasting more accurate and less manual.
CRM Forecasting Tools
Salesforce, HubSpot, and other CRMs have built-in forecasting modules. Use them for pipeline visibility, forecast categories, and rep submissions.
The limitation is they typically forecast opportunities, not full ARR waterfall including retention and expansion.
Spreadsheet Models
Most companies build ARR waterfall models in Google Sheets or Excel that combine:
- Pipeline forecasts from CRM
- Retention models from cohort analysis
- Expansion forecasts from CS data
- Churn predictions from health scores
Spreadsheets remain the backbone of sophisticated forecasting despite fancier tools.
Dedicated Forecasting Platforms
Tools like Clari and InsightSquared specialize in revenue forecasting. They pull data from your CRM, apply AI to improve accuracy, and provide forecast management interfaces.
These platforms are expensive ($30-100K+ annually) but valuable for companies with complex forecasting needs and large sales teams.
Data Warehouse Integration
For sophisticated forecasting, pull data from CRM, CS platforms, product analytics, and billing systems into a data warehouse where you can build custom models and reports.
This infrastructure pays off once you've reached $20M+ ARR and forecast accuracy directly impacts major resource allocation decisions.
Improving Forecast Accuracy
Forecasting is a muscle that strengthens with discipline and iteration.
Deal Inspection Disciplines
The most reliable forecasts come from rigorous deal inspection. Sales leaders must regularly review every significant opportunity with reps, asking:
- What specifically needs to happen for this deal to close?
- Who are all the stakeholders and what's their position?
- What could go wrong?
- Is the close date realistic?
This inspection surfaces deals that shouldn't be in the forecast and improves close date accuracy. Consistent SaaS sales qualification processes ensure opportunities in your forecast are truly qualified.
Sales Process Rigor
Forecasting accuracy improves when sales follows consistent processes. Define clear stage criteria, require evidence to progress opportunities, mandate regular opportunity updates, and don't allow deals to jump stages.
Process discipline creates reliable data that enables reliable forecasts.
Historical Accuracy Tracking
Measure your forecast accuracy over time. Create a scorecard showing:
- Forecast vs actual for each period
- Variance percentage
- Direction of error (optimistic or pessimistic)
- Improvement trends
This data helps calibrate future forecasts and identifies systematic biases.
Bias Identification
Most sales organizations have consistent biases. They might be:
- Chronically optimistic about deal timing (happy ears)
- Consistently pessimistic to make targets easier (sandbagging)
- Accurate on win rates but wrong on timing
Identify your biases and adjust accordingly. If deals consistently close one month later than forecast, factor that into your projections.
Calibration Sessions
Hold quarterly calibration sessions where RevOps presents forecast accuracy data and facilitates discussion about systematic errors.
These sessions create shared understanding of what "70% probability" really means in your organization and align teams around realistic forecasting.
Common Pitfalls
Even experienced teams make these forecasting mistakes:
Sandbagging: Sales teams lowering forecasts artificially to make targets easier. Counter this by measuring accuracy, not just attainment.
Happy Ears: Leadership hearing what they want to hear and pushing optimistic forecasts that don't match pipeline reality. Counter with transparent methodology and data.
Stale Pipeline: Including deals that will never close because nobody removed them. Counter with regular pipeline cleaning and opportunity aging rules.
Poor Data Hygiene: Forecasting from incomplete or inaccurate CRM data. Counter with mandatory fields, regular audits, and accountability for data quality.
No Accountability: Not measuring forecast accuracy or investigating variances. Counter with formal accuracy tracking and review processes.
Conclusion
ARR forecasting transforms from guesswork to discipline through systematic methodology, rigorous data management, and consistent review processes.
The companies that forecast accurately gain strategic advantages: they allocate resources more effectively, adjust course before small problems become crises, build board relationships based on trust, and make decisions confidently based on realistic projections.
This doesn't happen overnight. It requires building data infrastructure, training teams on consistent processes, implementing review disciplines, and iterating based on accuracy measurement.
But the investment pays off. When your board trusts your forecasts, when your CFO can plan cash needs accurately, and when your team makes decisions based on realistic projections rather than wishful thinking, you've built a capability that compounds as your company scales.
If your forecasts consistently miss targets, if board meetings involve explaining variances rather than discussing strategy, or if you're making resource decisions based on unreliable projections, it's time to build forecasting as a core revenue operations capability.
The forecast credibility gap costs companies dearly in lost trust, poor decisions, and missed opportunities. Closing that gap is one of the highest-value investments a SaaS company can make.
Learn More
Building accurate ARR forecasts requires mastery of several interconnected disciplines:
- SaaS Metrics Dashboard - Build comprehensive dashboards that surface the metrics driving your forecasts
- Product Analytics Setup - Instrument product usage data for expansion and churn prediction
- Churn Reduction Framework - Systematic approach to reducing churn and improving forecast stability
- Rule of 40 Optimization - Balance growth and profitability targets that inform annual forecasting

Senior Operations & Growth Strategist
On this page
- ARR Forecasting Fundamentals
- ARR vs Revenue Recognition
- Why ARR Matters for SaaS
- Forecast Accuracy Benchmarks
- Common Forecasting Mistakes
- ARR Components to Model
- New ARR (New Customers)
- Expansion ARR (Upsell, Cross-Sell)
- Contraction ARR (Downgrades)
- Churn ARR (Lost Customers)
- Net New ARR (The Sum)
- Building the New ARR Model
- Pipeline-Based Forecasting
- Stage Conversion Rates
- Sales Cycle Length Analysis
- Win Rate by Segment/Source
- Ramp Assumptions for New Reps
- Seasonality Factors
- Expansion ARR Forecasting
- Seat Expansion Patterns
- Product Upsell Rates
- Usage-Based Growth Curves
- Expansion Cycle Timing
- Cross-Sell Attach Rates
- Churn Modeling
- Logo Churn vs Dollar Churn
- Cohort-Based Analysis
- Leading Indicators
- Seasonal Patterns
- Segment-Specific Rates
- Voluntary vs Involuntary Churn
- Forecasting Methodologies
- Bottom-Up (Rep-by-Rep)
- Top-Down (Market-Based)
- Trend-Based (Historical)
- Cohort-Based (Retention Curves)
- Hybrid Approach
- The Three-Forecast Model
- Commit Forecast (90%+ Confidence)
- Most Likely Forecast (50% Confidence)
- Upside Forecast (Stretch Goals)
- How to Present to Board
- Time Horizons
- Weekly Forecasts (Current Quarter)
- Monthly Forecasts (Next Quarter)
- Quarterly Forecasts (Annual Plan)
- Annual Forecasts (3-Year Plan)
- Data Requirements
- CRM Pipeline Hygiene
- Historical Conversion Data
- Customer Cohort Data
- Renewal Tracking
- Sales Capacity Model
- Forecast Review Process
- Weekly Pipeline Reviews
- Monthly Forecast Calls
- Quarterly Business Reviews
- Board Reporting Cadence
- Technology Stack
- CRM Forecasting Tools
- Spreadsheet Models
- Dedicated Forecasting Platforms
- Data Warehouse Integration
- Improving Forecast Accuracy
- Deal Inspection Disciplines
- Sales Process Rigor
- Historical Accuracy Tracking
- Bias Identification
- Calibration Sessions
- Common Pitfalls
- Conclusion
- Learn More