Rule of 40 Optimization: Balancing Growth and Profitability for SaaS Success
Turn this article into takeaways for your work.
Each assistant summarizes the article only for you and suggests best practices for your work.
The Rule of 40 is the standard benchmark for healthy B2B SaaS growth: your revenue growth rate plus your profit margin should equal or exceed 40%. It tells investors and boards whether your growth is efficient or you are simply burning cash to grow. Hit 40% and you are on track; clear 50% and you are a top-quartile performer commanding premium valuation multiples. This guide shows how to calculate it, what target to aim for at each stage, and which levers move both sides of the equation.
There's a simple formula that determines whether public market investors will love or hate your SaaS company: Revenue Growth Rate + EBITDA Margin.
If that sum is 40% or higher, you're in good shape. Below 40%, and you're underperforming market expectations. Above 50%, you're a top-quartile performer commanding premium valuation multiples.
This is the Rule of 40, and it's become the dominant framework for measuring SaaS company performance. It's not just a metric - it's the lens through which CFOs, investors, and boards evaluate strategic trade-offs between growth and profitability.
If you're running a SaaS business post-Series A, understanding and optimizing for Rule of 40 isn't optional. It directly impacts your valuation, your ability to raise capital, and your strategic positioning.
What is the Rule of 40?
The Rule of 40 states that a healthy SaaS company's combined growth rate and profit margin should equal or exceed 40%.
Formula: Revenue Growth Rate (%) + EBITDA Margin (%) ≥ 40%
Example calculations:
- 50% growth + 10% margin = 60% (excellent)
- 30% growth + 15% margin = 45% (strong)
- 20% growth + 20% margin = 40% (acceptable)
- 60% growth - 10% margin = 50% (strong, despite losses)
- 15% growth + 5% margin = 20% (concerning)
Why 40%?
The 40% threshold emerged from observing successful public SaaS companies and correlating their combined growth and profitability metrics with valuation multiples. Companies consistently above 40% commanded premium valuations. Those below 40% traded at discounts.
The logic is intuitive: investors want growth or profitability, ideally both. A company growing 50% but losing money heavily is investing in future value. A company growing 20% but generating 25% margins is delivering current value. Both can be attractive. But a company growing slowly and losing money offers neither growth nor profit - that's the danger zone.
The Rule of 40 captures this trade-off in a single number that's easy to track and compare.
Historical Context: From Growth at All Costs to Efficient Growth
In the 2010s, the dominant SaaS strategy was "growth at all costs." Companies like Salesforce and Workday scaled rapidly while burning cash. Investors rewarded pure revenue growth without much concern for profitability.
That era ended around 2022. Rising interest rates, public market corrections, and scrutiny on cash burn shifted investor preferences. "Efficient growth" became the mantra. The Rule of 40 framework became the standard for measuring efficiency.
Now, instead of asking "How fast are you growing?" investors ask "What's your Rule of 40 score?" This single question captures both growth performance and operational discipline.
Understanding the Components
Let's break down each element of the formula:
Revenue Growth Rate
This measures your year-over-year ARR growth percentage.
Calculation: (Current Period ARR - Prior Year ARR) / Prior Year ARR × 100
Example: You went from $10M ARR to $14M ARR. Growth rate = ($14M - $10M) / $10M = 40%
What counts as "revenue growth":
- ARR growth is the standard for SaaS companies
- Some companies use revenue growth (GAAP revenue recognition)
- Use consistent methodology quarter over quarter
Growth rate considerations:
- Calculated on year-over-year basis (not quarter-over-quarter)
- Typically uses trailing twelve months (TTM) ARR
- Organic growth (excluding acquisitions) is the purest measure
EBITDA Margin
This measures profitability as a percentage of revenue.
Calculation: (EBITDA / Revenue) × 100
Where EBITDA = Earnings Before Interest, Taxes, Depreciation, and Amortization
Example: $14M in revenue, $2M in EBITDA = 14.3% margin
What counts as "EBITDA":
- Operating income
- Plus depreciation and amortization
- Typically excludes stock-based compensation (though methodologies vary)
- Some companies use "Adjusted EBITDA" with additional add-backs
Alternative: Free Cash Flow Margin
Some investors prefer Free Cash Flow (FCF) margin instead of EBITDA:
FCF Margin = (Free Cash Flow / Revenue) × 100
Free cash flow is EBITDA minus capital expenditures and working capital changes. It's a more conservative measure because it accounts for actual cash generation, not just accounting profitability.
For asset-light SaaS businesses, FCF and EBITDA margins are usually similar. For companies with significant infrastructure costs or payment timing issues, they can diverge meaningfully.
Why the Sum Matters
The beauty of Rule of 40 is that it treats growth and profitability as substitutable within bounds. You can achieve a 45% score with:
- 45% growth + 0% margin (high-growth, breakeven)
- 30% growth + 15% margin (balanced)
- 15% growth + 30% margin (profitable, moderate growth)
All three scenarios can be defensible depending on market opportunity, competitive dynamics, and company stage. The framework gives management flexibility to optimize the trade-off based on strategic context.
Understanding SaaS economics and unit metrics helps you determine which balance makes sense for your business.
Rule of 40 Performance Benchmarks
Public SaaS companies provide performance benchmarks:
Below 20%: Distressed territory. The company is neither growing fast nor generating profits. This typically signals fundamental business model problems or intense competitive pressure.
20-30%: Below market expectations. The company is underperforming peers. Valuation multiples will be compressed, and investor pressure for improvement will be significant.
30-40%: Acceptable performance. The company is executing adequately but not exceptionally. This is the minimum bar for a healthy SaaS business.
40-50%: Strong performance. This is median-to-good for public SaaS companies. You're meeting or slightly exceeding market expectations.
50-60%: Excellent performance. Top quartile of public SaaS companies. You're demonstrating both strong growth and good efficiency. Valuation multiples will be premium.
60%+: Elite performance. Only a handful of companies sustain this level. Companies like Snowflake, Datadog, and Cloudflare have posted Rule of 40 scores above 60% at various points.
For private companies, expectations vary by stage. Early-stage companies (Series A/B) often run below 40% while prioritizing growth. By Series C and beyond, investors expect Rule of 40 performance in the 30-40% range minimum.
The Growth-Profitability Trade-Off
Different combinations of growth and margin tell different strategic stories:
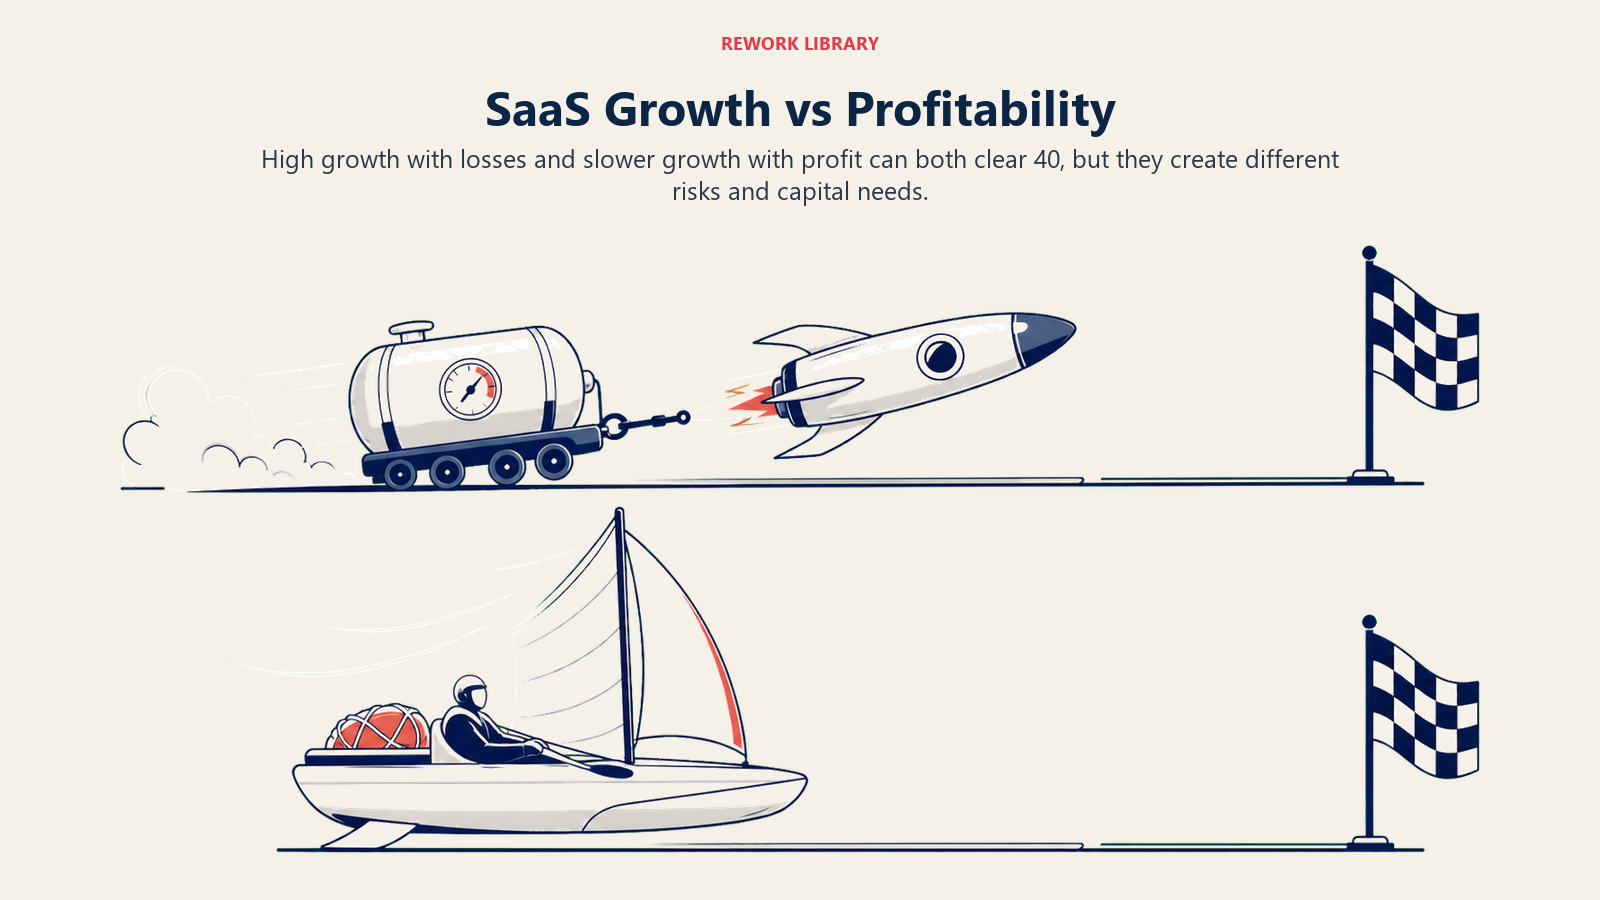
High Growth, Low/Negative Margin (60% growth, -10% margin = 50%)
This is the classic land-grab strategy. You're investing heavily in sales, marketing, and R&D to capture market share while the opportunity is open.
When this makes sense:
- Large, rapidly expanding market
- First-mover advantage to capture
- Strong unit economics and CAC metrics (CAC:LTV, payback period)
- Clear path to profitability once growth moderates
Risks:
- Capital intensive - requires continued fundraising
- If growth slows before reaching profitability, the story breaks
- Competitive dynamics can sustain losses longer than expected
Companies like Snowflake and Databricks ran this playbook successfully by combining high growth with strong unit economics that promised eventual profitability.
Balanced Model (25% growth, 15% margin = 40%)
This is the "efficient growth" model that became popular post-2022. You're growing solidly while demonstrating operational discipline and moving toward profitability.
When this makes sense:
- Mature market with steady demand
- Proven business model with understood economics
- Desire to reduce capital dependency
- Moving toward IPO or profitability requirements
Benefits:
- Less capital intensive
- De-risks the business model
- Demonstrates operational excellence
- Creates optionality (can invest in growth or harvest profits)
This is often the sweet spot for Series C/D companies moving toward public markets.
High Margin, Moderate Growth (15% growth, 25% margin = 40%)
This is the "cash cow" model. You're prioritizing profitability over growth, often because the market opportunity is maturing or you're optimizing for cash generation.
When this makes sense:
- Market leadership position established
- Growth opportunities become more expensive
- Shareholders prioritize cash returns over growth
- Preparing for strategic exit or dividend potential
Trade-offs:
- May cede market share to faster-growing competitors
- Can signal market maturity or saturation
- Risk of disruption if you under-invest in innovation
This is typical for late-stage private companies or public companies in mature markets.
The right balance depends on your market position, growth stage (as outlined in SaaS growth stages), competitive dynamics, and capital strategy.
Optimization by Growth Stage
Rule of 40 targets should vary based on company maturity:
Early Stage ($0-$10M ARR)
Target: Focus on growth, don't worry about Rule of 40 yet.
You should be growing 100-200%+ annually while burning capital to find product-market fit and initial scale. Rule of 40 is irrelevant at this stage.
Metrics that matter more:
- Retention rates
- CAC payback period
- Product-market fit validation
Scaling Stage ($10-$50M ARR)
Target: 40-50% Rule of 40, weighted toward growth.
You're proving your business model can scale. Typical pattern might be 50% growth + 0% margin = 50%, or 60% growth - 10% margin = 50%.
Focus areas:
- Efficient CAC/LTV ratios
- Improving gross margins
- Building operational leverage through RevOps
Growth Stage ($50M-$100M ARR)
Target: 45-55% Rule of 40, moving toward balance.
You're a proven business approaching public market readiness. Typical pattern might be 40% growth + 10% margin = 50%, or 35% growth + 15% margin = 50%.
Focus areas:
- Demonstrable path to profitability
- Multi-product or multi-segment expansion
- Operational efficiency improvements
Mature Stage ($100M+ ARR)
Target: 40-50% Rule of 40, balanced or margin-weighted.
You're in or approaching public markets. Investors expect both growth and profitability. Typical pattern might be 30% growth + 20% margin = 50%, or 25% growth + 25% margin = 50%.
Focus areas:
- Free cash flow generation
- Sustainable competitive advantages
- Capital allocation decisions
Levers for Improving Rule of 40
You have five primary levers to improve your Rule of 40 score:
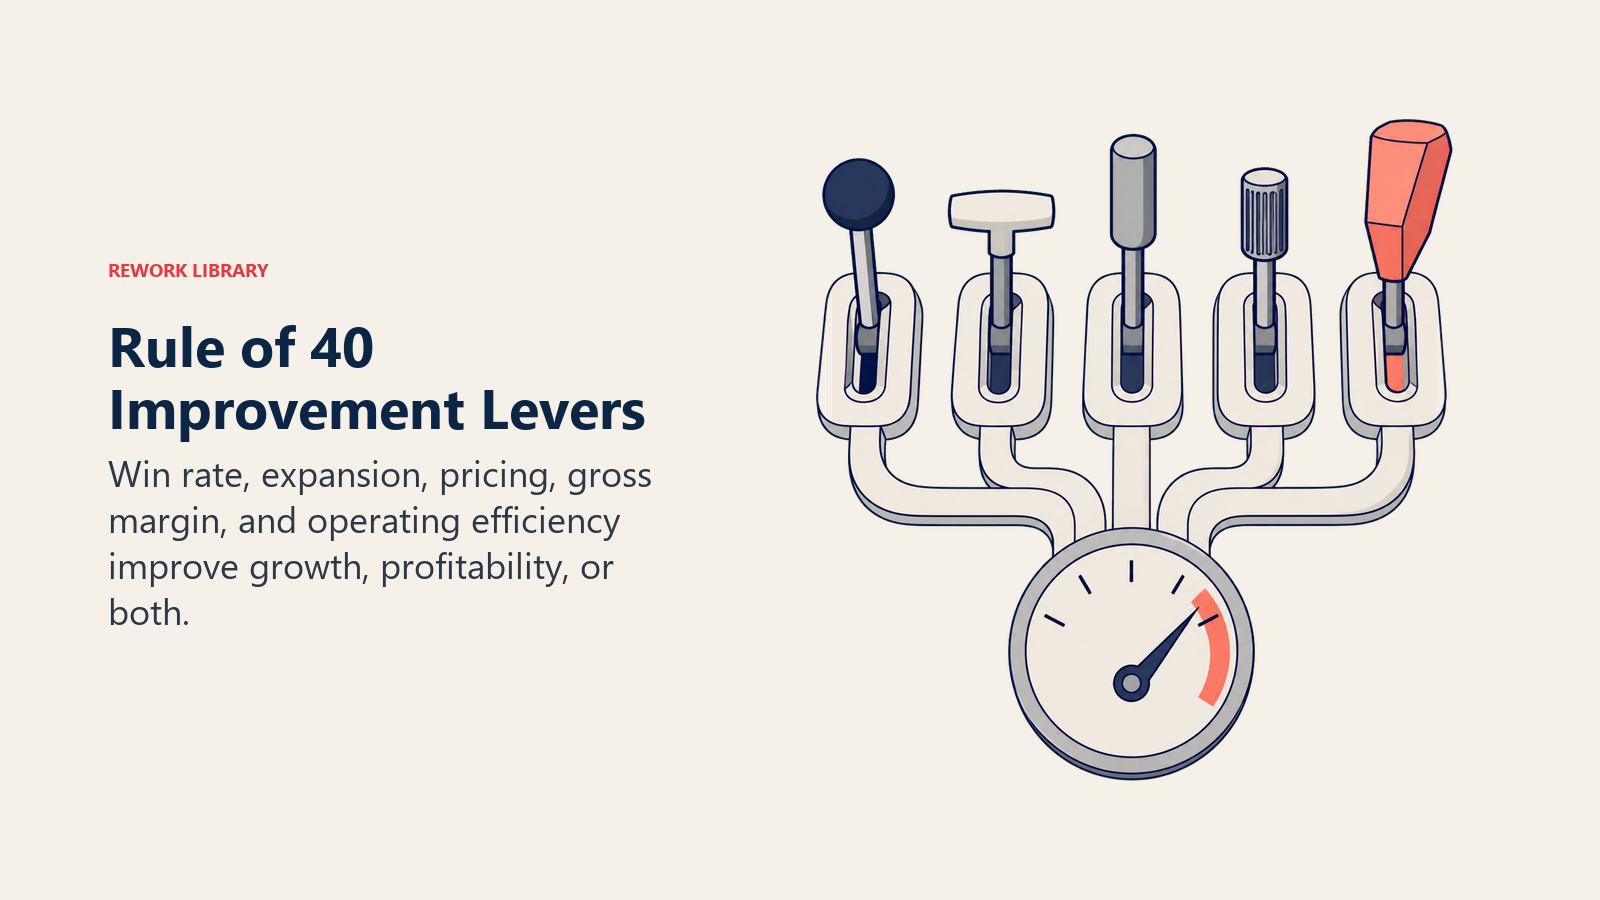
Growth Side: Increase Win Rates
Improve conversion rates across your funnel without increasing spend. If you can go from 20% to 25% close rate on qualified opportunities, you've increased growth rate without touching costs.
Tactics:
- Better qualification frameworks (focus on best-fit prospects)
- Improved sales process and enablement
- Product improvements that make buying decision easier
- Stronger competitive differentiation
Growth Side: Expand Existing Customers
Drive net revenue retention above 100% through upsells, cross-sells, and usage expansion.
Tactics:
- Usage-based pricing that grows with customer value
- Product roadmap that creates natural upsell paths
- Customer success programs that identify expansion opportunities
- Multi-product strategy
Growth Side: Improve Market Penetration
Increase market share or enter adjacent markets to drive top-line growth.
Tactics:
- Geographic expansion
- New customer segments
- Product-led growth motions (detailed in product-led growth strategy)
- Strategic partnerships and channels
Profitability Side: Reduce CAC
Lower customer acquisition costs through more efficient marketing and sales.
Tactics:
- Improve conversion rates across the funnel (less spend per customer)
- Optimize channel mix (focus on high-ROI channels)
- Increase organic/inbound percentage
- Better sales productivity and efficiency
Profitability Side: Improve Gross Margin
Increase the margin on revenue by optimizing cost of goods sold.
Tactics:
- Infrastructure cost optimization
- Support and success efficiency improvements
- Price increases (where market supports)
- Product architecture improvements
Profitability Side: Operating Leverage
Reduce operating expenses as percentage of revenue by scaling efficiently.
Tactics:
- Automation and self-service capabilities
- Organizational efficiency improvements
- Strategic offshoring or outsourcing
- Improved retention and churn reduction (reduces replacement costs)
Structural Improvements
Fundamental business model changes that improve both growth and margin:
Pricing optimization: Most SaaS companies underprice. A 10% price increase with minimal churn impact flows directly to margin while funding growth investments. Explore SaaS pricing models systematically.
Product-led motion: Shift to product-led acquisition where the product drives customer acquisition and expansion. This can reduce CAC while increasing expansion revenue.
Self-service: Build self-service capabilities for onboarding, support, and purchasing to reduce service costs and improve scalability.
The highest-leverage improvements often come from structural changes rather than incremental optimizations.
Common Optimization Scenarios
Let's walk through real scenarios:
Scenario A: High Growth, Deep Losses (60% growth, -20% margin = 40%)
You're hitting Rule of 40, but barely, and you're burning significant cash.
Strategic options:
Maintain path: If unit economics are strong (good CAC:LTV, reasonable payback), and you're capturing a large market, staying aggressive on growth might be right. But you need clear line of sight to profitability.
Moderate growth: Reduce growth rate to 45-50% while cutting losses to -5 to -10%. This improves capital efficiency while maintaining strong growth.
Prove profitability: Temporarily slow growth to 30-40% while achieving breakeven. This de-risks the business model and creates optionality.
Key question: Can you raise additional capital to fund the burn? If not, option 2 or 3 becomes necessary.
Scenario B: Moderate Growth, Breakeven (30% growth, 10% margin = 40%)
You're at exactly 40% with balanced growth and emerging profitability.
Strategic options:
Invest in growth: Reinvest the margin back into sales and marketing to push growth to 40-45%. This is appropriate if market opportunity is large and competitors are aggressive.
Improve margin: Keep growth steady at 30% but optimize to 15-20% margin. This creates financial cushion and proves operating leverage.
Balanced optimization: Push both metrics up 5 points each to reach 35% growth + 15% margin = 50%.
Key question: What does your competitive landscape demand? In hot markets, growth usually wins. In maturing markets, efficiency matters more.
Scenario C: Slow Growth, Good Margin (20% growth, 20% margin = 40%)
You're hitting Rule of 40 but growth is slowing.
Strategic options:
Reignite growth: Invest margin back into growth initiatives - new products, new markets, new segments. Accept temporary margin compression to 10-15% to push growth to 30%+.
Accept maturity: If the market is mature and growth investments have diminishing returns, optimize for profitability. Push margin to 30-35% while accepting 15-20% growth.
Strategic pivot: Consider M&A, significant product expansion, or geographic moves to create new growth vectors.
Key question: Is the growth slowdown temporary or structural? If structural, accepting lower growth might be rational. If temporary, investing to reignite it is critical.
Rule of 40 and Valuation Impact
Rule of 40 correlates strongly with SaaS valuation multiples (EV/Revenue).
Public market patterns (general ranges, vary by market conditions):
- Rule of 40 below 30%: 3-6x revenue multiples
- Rule of 40 30-40%: 6-10x revenue multiples
- Rule of 40 40-50%: 8-12x revenue multiples
- Rule of 40 50-60%: 10-15x revenue multiples
- Rule of 40 60%+: 12-20x+ revenue multiples
These are rough approximations - individual valuations depend on many factors including market position, competitive dynamics, total addressable market, and growth durability.
Private market benchmarks:
Private markets are less efficient and more stage-dependent, but Rule of 40 still matters:
- Series B/C companies: Investors expect path to 35-40% minimum
- Series D/E companies: Investors expect 40-50% performance
- Pre-IPO companies: Investors expect 45%+ to justify public market readiness
Impact on fundraising:
When you raise capital, Rule of 40 performance directly impacts:
- Valuation: Better performance = higher valuations
- Terms: Better performance = more favorable terms
- Investor quality: Top-tier investors target top-tier performers
- Dilution: Better performance = less dilution required
Optimizing Rule of 40 before fundraising can meaningfully improve your negotiating position.
Building Your Optimization Roadmap
Here's a 12-month planning framework:
Month 1-2: Baseline and Analyze
- Calculate current Rule of 40 score
- Break down components (growth rate, margin)
- Analyze trajectory (improving or declining?)
- Benchmark against peers and market expectations
- Identify biggest gaps and opportunities
Month 3-4: Strategic Choices
- Decide growth vs profitability balance based on stage and market
- Set 12-month Rule of 40 target
- Allocate target improvement across growth and margin levers
- Get board/investor alignment on strategy
Month 5-7: Initiative Planning
- Identify specific initiatives for each lever
- Quantify expected impact of each initiative
- Prioritize based on impact and feasibility
- Assign ownership and resources
- Build tracking and analytics systems
Month 8-12: Execute and Adjust
- Launch prioritized initiatives
- Track leading indicators weekly/monthly
- Review Rule of 40 score quarterly
- Adjust tactics based on results
- Prepare for next year's planning
The key is treating Rule of 40 as a strategic framework, not just a metric you report. Use it to guide resource allocation, organizational priorities, and executive decisions.
Frequently Asked Questions
What is the Rule of 40 in B2B SaaS? The Rule of 40 states that a healthy SaaS company's revenue growth rate plus its profit margin should equal or exceed 40%. It treats growth and profitability as substitutable within bounds, so 50% growth with negative 10% margin and 20% growth with 20% margin both clear the bar. It has become the dominant lens for judging whether B2B SaaS growth is efficient.
How do you calculate the Rule of 40? Add your year-over-year revenue (or ARR) growth rate to your EBITDA margin, both expressed as percentages. For example, 30% growth plus 15% margin equals a Rule of 40 score of 45%. Some investors swap EBITDA margin for free cash flow margin, which is more conservative because it reflects actual cash generation.
What is a good Rule of 40 score? Above 40% is healthy, 50-60% is excellent and top quartile for public SaaS, and 60%+ is elite. Scores between 30% and 40% are acceptable but unexceptional, while anything below 30% signals compressed valuations and investor pressure. Early-stage companies are often judged on growth alone before the Rule of 40 applies.
Does the Rule of 40 apply to early-stage startups? Not really. Companies under roughly $10M ARR should prioritize growth and product-market fit, often growing 100% or more while burning capital. The Rule of 40 becomes a meaningful benchmark in the scaling stage and beyond, with investors expecting 35-50% performance by Series C and later.
How do you improve a Rule of 40 score? Pull growth levers (higher win rates, expansion revenue above 100% net retention, deeper market penetration) and profitability levers (lower CAC, better gross margin, operating leverage). Structural moves like pricing optimization and a product-led motion often deliver the biggest gains because they lift both growth and margin at once.
Conclusion: Rule of 40 as Strategic Compass
The Rule of 40 isn't just another SaaS metric. It's the framework that determines how investors value your company and how you should think about strategic trade-offs.
Every meaningful decision - sales hiring, marketing spend, pricing changes, product investments, organizational efficiency - impacts your Rule of 40 score. Understanding these relationships helps you optimize systematically rather than reactively.
Companies that consistently score above 40% - and ideally above 50% - build more valuable businesses, raise capital on better terms, and create more strategic options. Those that persistently score below 40% struggle with valuations, dilution, and competitive positioning.
Measure your Rule of 40 score. Understand what's driving it. Set ambitious but realistic targets. Execute initiatives that move both sides of the equation. And use the framework as your strategic compass for balancing growth and profitability.
In the modern SaaS landscape, Rule of 40 isn't just a metric to report. It's the score that matters most.
Ready to optimize your Rule of 40 performance? Explore strategies for improving net revenue retention and understanding SaaS pricing models to drive both growth and margin expansion.
Learn more:

Senior Operations & Growth Strategist
On this page
- What is the Rule of 40?
- Why 40%?
- Historical Context: From Growth at All Costs to Efficient Growth
- Understanding the Components
- Revenue Growth Rate
- EBITDA Margin
- Why the Sum Matters
- Rule of 40 Performance Benchmarks
- The Growth-Profitability Trade-Off
- High Growth, Low/Negative Margin (60% growth, -10% margin = 50%)
- Balanced Model (25% growth, 15% margin = 40%)
- High Margin, Moderate Growth (15% growth, 25% margin = 40%)
- Optimization by Growth Stage
- Early Stage ($0-$10M ARR)
- Scaling Stage ($10-$50M ARR)
- Growth Stage ($50M-$100M ARR)
- Mature Stage ($100M+ ARR)
- Levers for Improving Rule of 40
- Growth Side: Increase Win Rates
- Growth Side: Expand Existing Customers
- Growth Side: Improve Market Penetration
- Profitability Side: Reduce CAC
- Profitability Side: Improve Gross Margin
- Profitability Side: Operating Leverage
- Structural Improvements
- Common Optimization Scenarios
- Scenario A: High Growth, Deep Losses (60% growth, -20% margin = 40%)
- Scenario B: Moderate Growth, Breakeven (30% growth, 10% margin = 40%)
- Scenario C: Slow Growth, Good Margin (20% growth, 20% margin = 40%)
- Rule of 40 and Valuation Impact
- Building Your Optimization Roadmap
- Frequently Asked Questions
- Conclusion: Rule of 40 as Strategic Compass