Product Analytics Setup: Instrumenting Your SaaS Product for Growth
Turn this article into takeaways for your work.
Each assistant summarizes the article only for you and suggests best practices for your work.
Your SaaS product has 1,200 paying customers. You know how much ARR they represent and when they're up for renewal. You can see login counts from your server logs.
But you can't answer basic questions: Which features do power users adopt that churned customers never discover? What's the actual "aha moment" that turns trial users into paying customers? Which usage patterns predict expansion versus churn?
You're flying blind.
This is the product analytics gap that separates companies that truly understand their product-market fit from those guessing based on anecdotes and aggregate metrics.
Product analytics isn't about collecting more data, it's about instrumenting your product to answer specific questions about user behavior, feature adoption, and the connection between product usage and revenue outcomes.
Why Product Analytics Matters for SaaS
Traditional web analytics tells you how people interact with your marketing website. Product analytics tells you how they actually use your product after they become customers. The difference is critical.
Usage-Based Pricing Models
If you charge based on seats, API calls, storage, or any other usage metric, you need precise tracking of what customers consume. Product analytics gives you the data infrastructure to support usage-based pricing without surprises.
Product-Led Growth Strategies
Companies adopting product-led growth (PLG) let the product drive acquisition, conversion, and expansion. This only works when you understand exactly which product experiences drive these outcomes.
You can't optimize a PLG motion without knowing which features drive activation, which usage patterns predict upgrade behavior, and where trial users get stuck.
Churn Prediction and Prevention
Leading indicators of churn live in product usage data. Declining login frequency, dropping feature adoption, and ignored notifications all signal risk weeks before a customer actually cancels.
Product analytics enables proactive interventions: Customer success can reach out when usage drops, sales can identify expansion opportunities when adoption increases, and product teams can prioritize features that drive retention.
Feature Adoption Tracking
You shipped a major feature three months ago. Marketing announced it, sales pitched it, but you don't actually know how many customers use it or whether it impacts retention.
Product analytics answers these questions definitively. You can track adoption curves, identify segments that do or don't adopt, and correlate feature usage with customer outcomes.
Customer Health Scoring
The best customer health scores combine engagement data (meetings, email responses) with product usage data (login frequency, feature adoption, data volume). Product analytics provides half of this equation.
Core Analytics Platforms
Several platforms dominate the product analytics landscape. They have different philosophies, strengths, and ideal use cases.
Amplitude vs Mixpanel
Amplitude leads in behavioral cohort analysis. It excels at tracking user journeys, building complex cohorts based on behavior, and analyzing conversion funnels with precision.
Amplitude's strength is sophisticated analysis for product and growth teams. If you're running experiments, optimizing funnels, and doing deep behavioral analysis, Amplitude is purpose-built for this work.
Pricing scales with monthly tracked users (MTUs). Budget $1-2K/month at 10K MTUs, scaling to $30K+/month at larger volumes.
Mixpanel offers similar capabilities with a focus on real-time analysis and simpler interface. Many teams find Mixpanel more accessible to non-technical users.
Mixpanel's pricing is also MTU-based, with free tier up to 20M events/month. Paid plans start around $25/month and scale based on usage.
The choice often comes down to team preference. Both platforms handle core product analytics well. Amplitude has deeper analysis features; Mixpanel has a cleaner UI.
PostHog (Open-Source Option)
PostHog offers an open-source product analytics platform you can self-host or use their cloud version.
The advantage is transparency and control. You own the data, can customize the platform, and pay based on self-hosting costs rather than per-user pricing.
The disadvantage is operational overhead. Someone needs to maintain the infrastructure, manage updates, and handle scaling.
PostHog makes sense for companies with strong engineering resources, specific data sovereignty requirements, or those who want to avoid vendor lock-in. Most companies are better served by hosted solutions.
Heap (Auto-Capture Approach)
Heap differentiates itself with automatic event capture. Instead of manually instrumenting every event, Heap's JavaScript snippet captures all interactions automatically.
This sounds attractive, no engineering required! But auto-capture creates problems. You get massive data volumes of mostly irrelevant events, unclear event naming, and difficulty answering specific questions.
Heap works for basic adoption (get started quickly) but mature analytics requires intentional event design, not automatic capture of everything.
Pendo (Combined Analytics + Guidance)
Pendo combines product analytics with in-app guidance and feedback tools. You get usage analytics plus the ability to show tooltips, guides, and surveys inside your product.
This integration is valuable for product teams that want both measurement and intervention capabilities in one platform. The limitation is that Pendo's analytics aren't as sophisticated as pure-play platforms like Amplitude.
Consider Pendo if you're building out product-led growth motions that require both analytics and in-product communication.
When to Use Multiple Tools
Many companies use multiple analytics platforms:
- Amplitude for behavioral analysis and experimentation
- Pendo for in-app messaging and user onboarding
- Google Analytics for marketing website tracking
- Custom dashboards for operational metrics
This creates redundancy but serves different stakeholders with different needs. Your tech stack should match your organizational structure and use cases.
Event Tracking Framework
The foundation of product analytics is event tracking, capturing specific user actions with context that makes them analyzable.
![]()
Event Taxonomy Design
Good event tracking starts with intentional taxonomy design. Don't just track everything; design your event structure to answer specific questions.
Use a consistent naming convention. Most companies adopt Object_Action format: Report_Created, Filter_Applied, Dashboard_Viewed.
Group events into categories: Acquisition events (signup, trial start), Activation events (first value milestone), Engagement events (feature usage), Monetization events (upgrade, payment), and Retention events (return visits, ongoing usage).
Document your taxonomy before implementing. When multiple engineers instrument events without coordination, you end up with user-signup, User Signup, userSignup, and new_user_registered all tracking the same thing.
User Identification Strategy
Product analytics needs to track users across sessions and devices. This requires a consistent user identification strategy.
Use unique user IDs that persist across sessions. When users log in, identify them explicitly so all subsequent events associate with their profile.
Handle anonymous users thoughtfully. Before login, track anonymous IDs. After login, alias the anonymous ID to the actual user ID so you can connect pre-login behavior with post-login activity.
For B2B SaaS, also track company/account IDs as group properties. This enables account-level analysis: how many users per account, which accounts have high engagement, feature adoption by account size.
Properties and Attributes
Events need context to be useful. A Report_Created event without properties tells you someone created a report. The same event with properties tells you what kind of report, how many data sources, time to create, and user role.
Design properties systematically. User properties describe who (role, plan tier, signup date). Event properties describe what happened (report type, filters used, creation method). Group properties describe the account (company size, industry, plan).
Keep properties consistent across events. If you track plan_tier as a user property, use that exact field name everywhere. Don't have plan_tier, subscription_type, and pricing_plan meaning the same thing.
Event Naming Conventions
Establish clear naming rules before engineers start implementing:
- Use past tense for completed actions:
Report_CreatednotReport_Create - Use consistent separators (underscores or camelCase, not both)
- Start with objects, not actions:
Dashboard_ViewednotViewed_Dashboard - Avoid technical jargon in event names:
Account_UpgradednotStripe_Checkout_Completed
Documentation Requirements
Every event needs documentation that explains: what user action triggers it, what properties it includes, where in the product it fires, when it was implemented, and why it matters.
This documentation lives in a shared location, often a notion database, Airtable, or Google Sheet, that product, engineering, analytics, and marketing teams can reference.
Without documentation, your analytics becomes a black box where nobody knows what events actually mean or whether they're firing correctly.
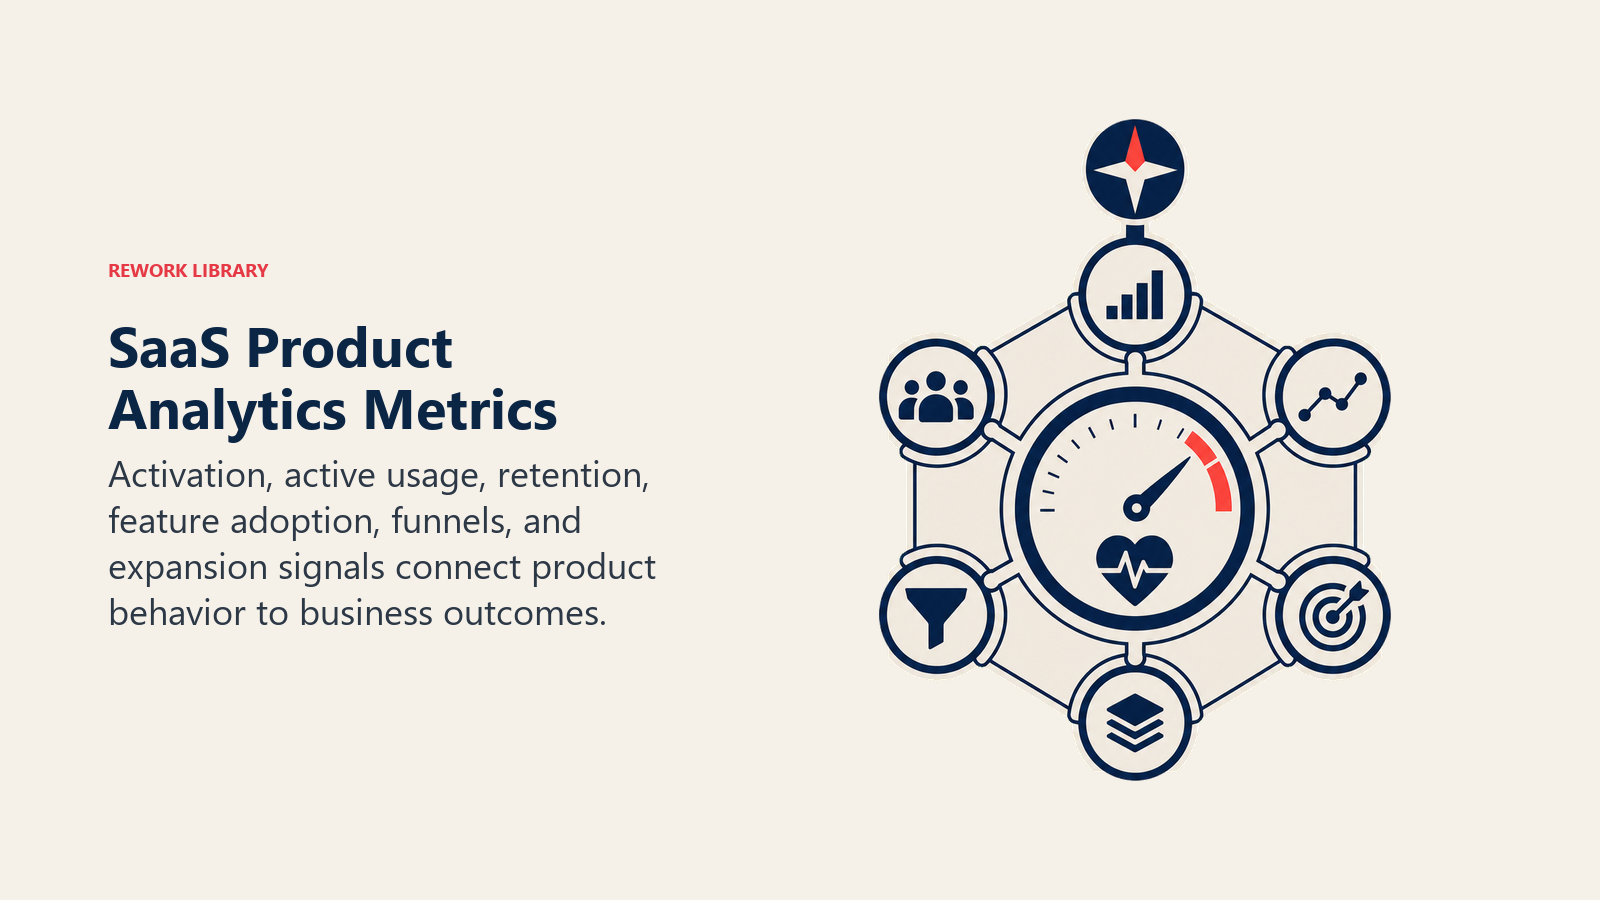
Key Metrics to Track
Product analytics should illuminate specific metrics that connect product usage to business outcomes.
Activation Metrics (Aha Moment)
What's the specific experience where users realize your product's value? This "aha moment" is your activation metric.
For Slack, it's sending 2,000 team messages. For Dropbox, it's getting one file on one device. For your product, it's the specific feature usage or workflow completion that predicts long-term retention.
Finding your activation metric requires analysis. Look at users who become power users versus those who churn. What did the power users do in their first session, first day, or first week that churned users didn't?
Once identified, your activation metric becomes the North Star for onboarding, trial optimization, and product-led growth efforts.
Engagement Metrics (DAU, WAU, MAU)
Daily Active Users (DAU), Weekly Active Users (WAU), and Monthly Active Users (MAU) measure how often people return to your product.
The right engagement metric depends on your product's natural usage frequency. If you're a project management tool, daily engagement makes sense. If you're quarterly planning software, monthly engagement is more appropriate.
More important than absolute numbers are ratios. DAU/MAU ratio (often called stickiness) reveals what percentage of your monthly users engage daily. High-performing products often achieve 60%+ stickiness.
Retention Cohorts
Cohort analysis tracks groups of users who signed up in the same period and measures what percentage remain active over time.
A typical retention cohort shows: 100% of users in Week 0 (signup), 40% in Week 1, 25% in Week 4, 20% in Week 12. The curve shape reveals your retention dynamics.
Healthy SaaS products show retention curves that flatten after initial drop-off. If your curve keeps declining without flattening, you haven't found product-market fit.
Compare retention across cohorts to see if product changes improve retention. If your Week 12 retention improved from 15% to 25% after a major feature release, you've validated that feature's impact.
Feature Adoption Rates
For every feature, track: what percentage of users have tried it at least once, what percentage use it regularly (weekly/monthly), how long after signup do users typically adopt it, and whether usage correlates with retention or expansion.
Build a feature adoption matrix that shows adoption rates by customer segment. Enterprise customers might adopt advanced features that SMB customers never touch, informing both product development and pricing strategies.
Power User Behaviors
Identify your power users, the customers who get exceptional value from your product, and study their behavior patterns.
What features do they use that others don't? How frequently do they log in? What workflows do they complete? What's different about their first 30 days compared to average users?
These patterns become playbooks for customer success teams to help other customers achieve similar value.
Expansion Indicators
Which product usage patterns predict upsell readiness? Users who approach seat limits, teams adding integrations, accounts using premium features in trial mode, and power users evangelizing the product internally all signal expansion opportunities.
Track these indicators in your product analytics, then surface them to your sales and customer success teams through your SaaS metrics dashboard.
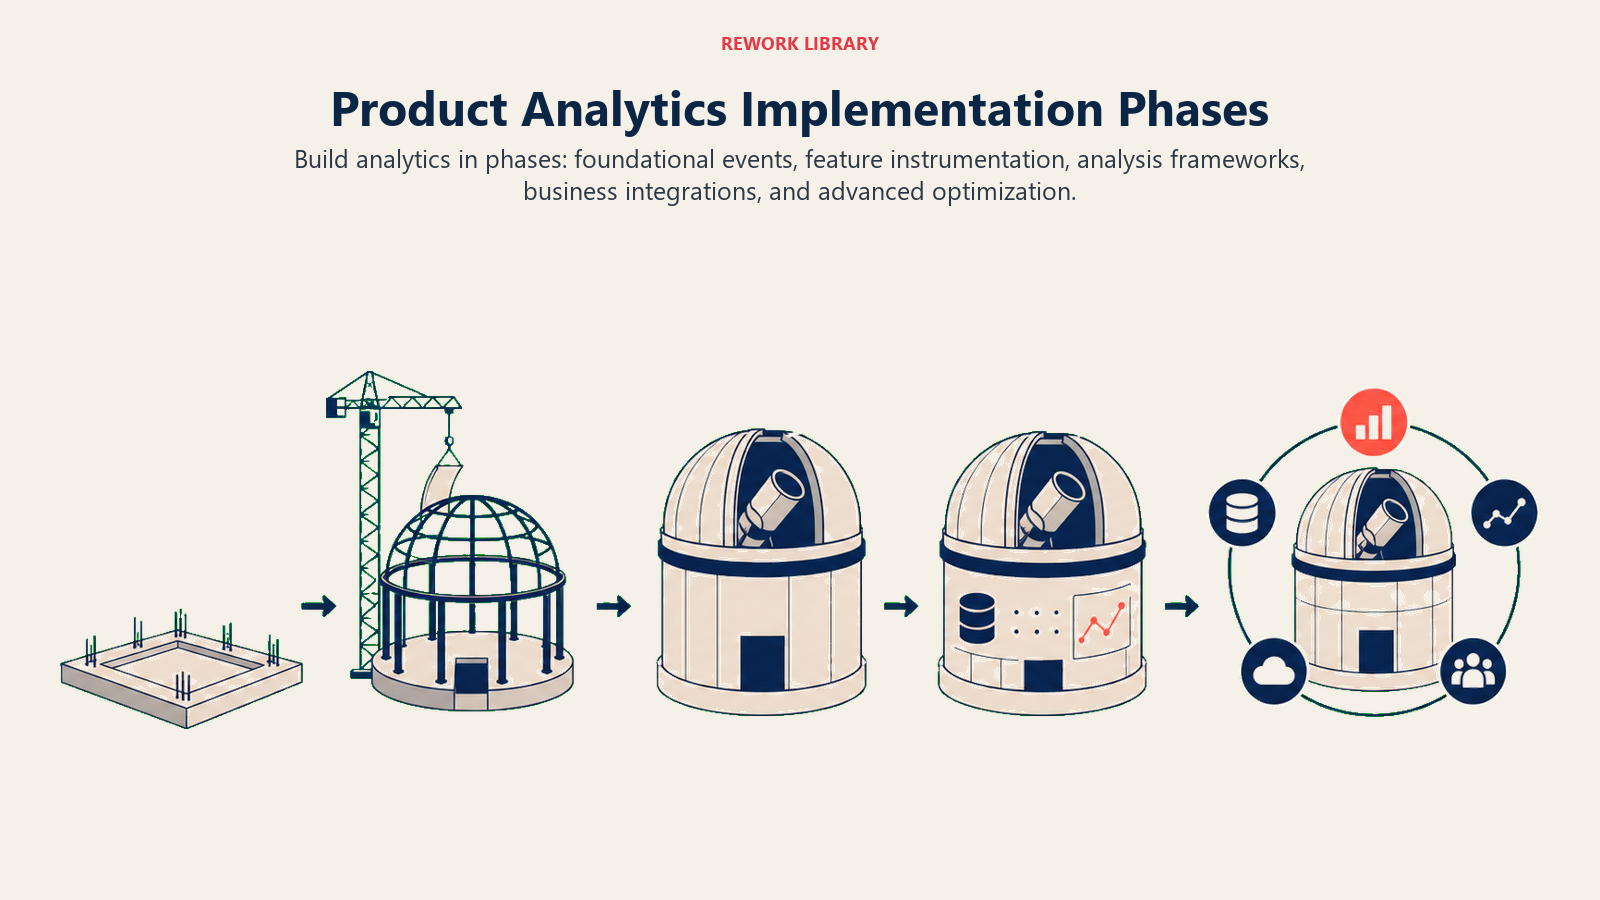
Implementation Phases
Don't try to implement comprehensive product analytics overnight. Build in phases that deliver incremental value.
Phase 1: Core Tracking (Authentication, Key Actions)
Start with foundational events: user signup, login, logout, key workflows completion. Get these working reliably with proper user identification before adding complexity.
This phase typically takes 2-4 weeks for a development team. The goal is baseline visibility into who's using your product and how often.
Phase 2: Feature-Level Tracking
Now instrument specific features and workflows. Track when users create, edit, view, and delete key objects in your product. Add properties that provide context about how features are used.
This phase takes 4-8 weeks and requires collaboration between product, engineering, and analytics teams to design the right event structure.
Phase 3: Advanced Analytics (Funnels, Cohorts)
With comprehensive event tracking in place, build analysis frameworks. Define your key funnels (signup to activation, trial to paid, free to upgrade), create retention cohorts, and establish behavioral segments.
This phase is analytical rather than engineering-focused. It's about learning from the data you've collected.
Phase 4: Predictive Models
The mature state of product analytics includes predictive models: churn risk scores based on usage patterns, expansion propensity models, ideal customer profile refinement based on successful user patterns.
This phase requires data science capabilities and sufficient historical data to build reliable models. Most companies reach this phase 12-18 months into their analytics journey.
Technical Implementation
Product analytics requires both technical precision and thoughtful architecture.
Client-Side vs Server-Side Tracking
Client-side tracking uses JavaScript in the browser to capture events. It's easier to implement and captures user interactions that never hit the server (button clicks, page scrolls, form interactions).
The limitation is accuracy. Ad blockers prevent client-side tracking, offline usage doesn't get captured, and determined users can manipulate or block events.
Server-side tracking instruments your application backend to send events directly from your servers. This is more reliable and accurate but requires more engineering effort and misses client-only interactions.
The best approach is hybrid: use client-side tracking for front-end interactions and server-side tracking for critical business events (purchases, account changes, key feature usage).
SDK Integration Patterns
Most analytics platforms provide SDKs for popular languages and frameworks. Use them. Don't try to build custom integration by calling API endpoints directly.
SDKs handle batching, retry logic, offline queuing, and other edge cases that will bite you if you roll your own implementation.
Initialize your analytics SDK early in your application lifecycle so it's available throughout the codebase. In single-page apps, integrate with your routing layer to automatically track page views.
Data Layer Architecture
For complex applications, implement an analytics data layer that sits between your application code and analytics platforms.
This layer standardizes how events are tracked, enabling you to send the same event to multiple destinations (Amplitude for product analytics, CRM for sales follow-up, data warehouse for custom analysis).
Popular data layer frameworks include Segment (now Twilio Segment), RudderStack, and custom implementations. They add overhead but provide flexibility and reduce vendor lock-in.
Privacy and Compliance (GDPR, CCPA)
Product analytics must respect data privacy regulations. This requires:
Obtaining proper consent before tracking (especially in EU), implementing data retention policies that delete old data, enabling users to request data deletion, anonymizing PII in analytics events, and documenting what data you collect and why.
Build these considerations into your implementation from day one. Retrofitting privacy controls after you've collected data improperly is painful and risky.
Data Quality Assurance
Bad data is worse than no data because it drives incorrect decisions.
Implement data quality checks: automated tests that verify events fire correctly, dashboard alerts for abnormal event volumes, regular audits comparing event data to ground truth (like comparing Purchase_Completed events to actual billing records).
Assign someone ownership of data quality. In RevOps organizations, this often falls to revenue analysts or product operations specialists.
Analytics for Different Roles
Different stakeholders need different views of product analytics data.
Product Team Dashboards
Product managers need feature adoption metrics, A/B test results, funnel analysis, and user feedback correlation. Their dashboards focus on understanding what's working and informing roadmap decisions.
Customer Success Views
CS teams need account-level health scores, usage trends over time, feature adoption by customer segment, and early warning indicators of churn risk.
Integrate product analytics into your CS platform so CSMs see usage data alongside engagement data when reviewing accounts.
Sales Intelligence
Sales teams need expansion signals: accounts approaching limits, teams showing high engagement, departments within larger accounts not yet using the product.
Product analytics provides the intelligence that helps sales prioritize which accounts to target for expansion conversations.
Executive Reporting
Executives need aggregated metrics: overall engagement trends, activation and retention by cohort, feature adoption rates for strategic initiatives, and product-qualified lead (PQL) volumes for PLG motions.
Build executive dashboards that connect product metrics to business outcomes, show how product improvements impact retention, expansion, and ultimately ARR growth.
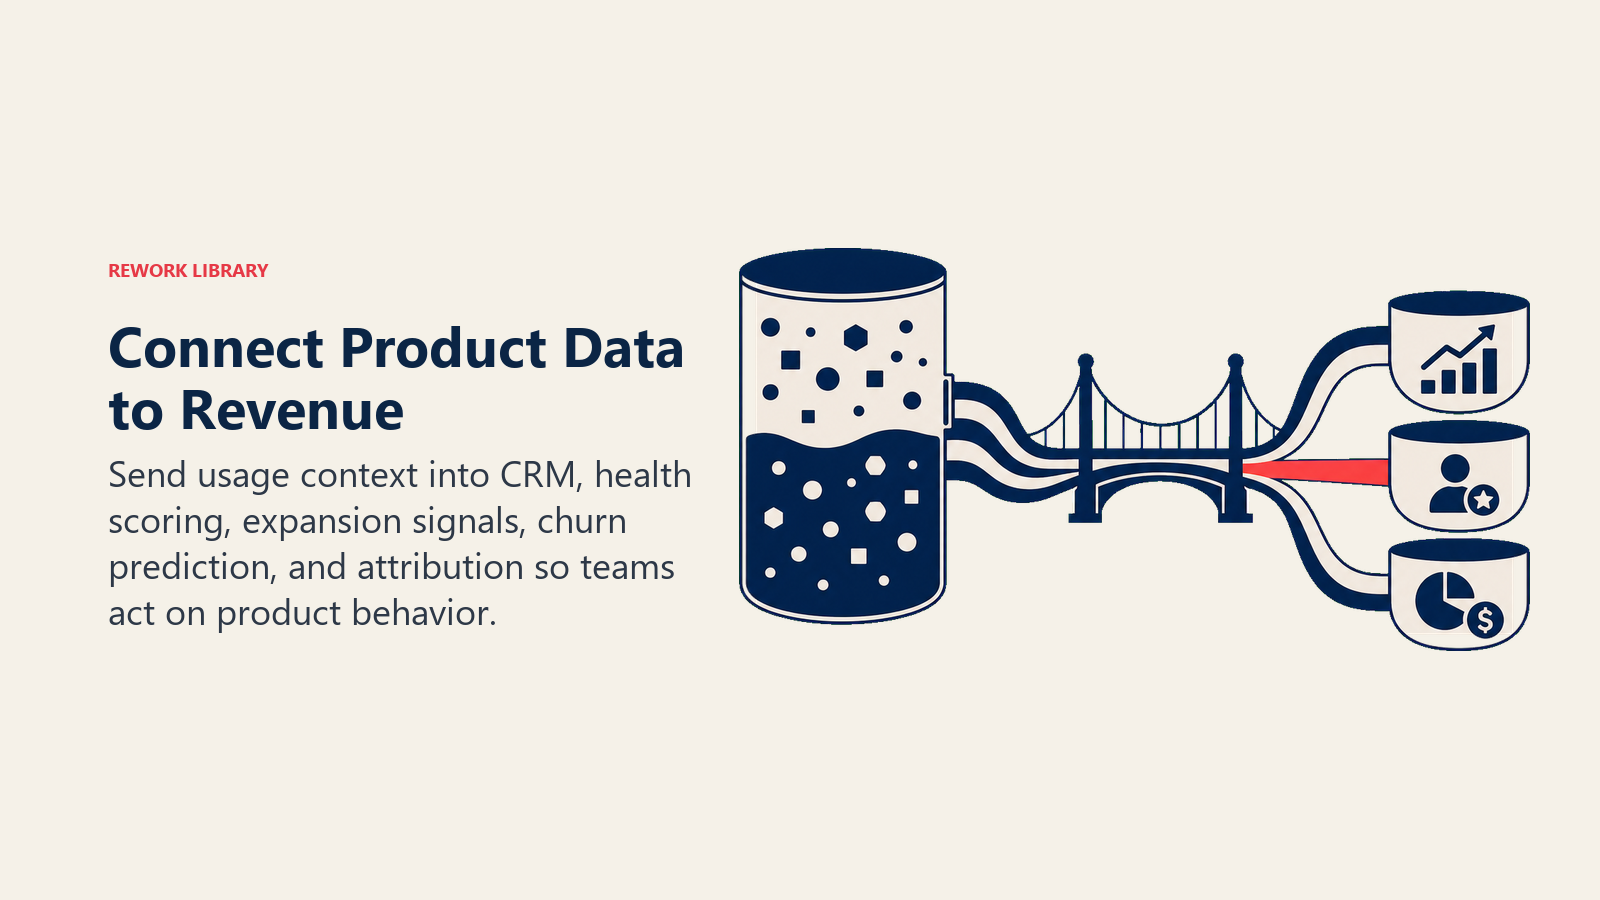
Connecting Product Data to Revenue
The most powerful product analytics implementations bridge the gap between product usage and revenue outcomes.
CRM Integration Patterns
Send key product usage data to your CRM so sales and CS teams see usage context when viewing accounts.
This might include: days since last login, monthly active users per account, feature adoption percentage, product qualified lead (PQL) score, and usage trend (increasing, stable, declining).
These data points inform outreach timing, conversation topics, and risk assessment.
Usage-Based Health Scores
Build customer health scores that combine engagement data with product usage data. A customer who responds quickly to emails but barely uses your product is at risk despite appearing engaged.
Weight product usage heavily in health scores, it's the most objective indicator of whether customers get value from your product.
Expansion Signal Detection
Use product analytics to identify accounts ready for expansion conversations: teams at 80%+ of seat limit, users accessing features available only in higher tiers, power users who might champion account-wide adoption.
Route these signals automatically to account managers so they can act while the opportunity is hot.
Churn Risk Identification
Leading indicators of churn appear in product usage long before customers actually cancel.
Build churn risk models that flag accounts showing: declining login frequency (compared to their baseline), decreasing feature adoption, ignored onboarding milestones, and support tickets about "how to cancel."
Surface these accounts to customer success teams for proactive intervention while there's still time to save the relationship.
Advanced Use Cases
Once you've mastered foundational product analytics, advanced use cases multiply your impact.
A/B Testing Infrastructure
Product analytics platforms integrate with experimentation frameworks to measure A/B test results. You can test different onboarding flows, feature variations, or pricing presentations and measure impact on activation, retention, and revenue.
Behavioral Cohort Analysis
Group users by behavior rather than demographics: users who adopted feature X in their first week, teams that completed the onboarding checklist, power users who log in daily.
Analyze how these behavioral cohorts differ in retention, expansion, and product usage patterns.
Conversion Funnel Optimization
Map critical user journeys (signup to activation, free to paid, basic to premium) as funnels in your analytics platform.
Measure conversion rates at each step, identify where users drop off, run experiments to improve weak steps, and track funnel performance over time.
Feature Flag Analytics
Combine feature flags (gradual rollout tools like LaunchDarkly) with product analytics to measure new feature impact before full release.
Roll out features to 10% of users, measure adoption and engagement, compare to control group, and decide whether to expand rollout based on data.
Common Implementation Mistakes
Even experienced teams make these product analytics mistakes:
Over-tracking: Instrumenting every possible event creates noise without signal. Focus on events that answer specific questions.
Inconsistent Naming: Different engineers using different conventions makes analysis impossible. Establish standards before implementation.
No Governance: Without clear ownership and documentation, your analytics decay into useless noise as team members change and context is lost.
Missing Business Context: Tracking user actions without connecting them to business outcomes (activation, retention, expansion) makes analytics interesting but not actionable.
Conclusion
Product analytics transforms how SaaS companies understand and improve their products. But the goal isn't sophisticated analytics for their own sake, it's making better decisions about product development, customer success, and growth strategies.
Start with clear questions you need to answer. Design event tracking that provides answers. Implement systematically, starting with foundational tracking before advanced analysis. Connect product data to revenue outcomes so insights drive action.
The companies winning in SaaS aren't necessarily those with the best products, they're the ones that understand their products best, iterate based on usage data, and connect product improvement directly to revenue growth.
If you're building a SaaS product without comprehensive product analytics, you're operating blind. The question isn't whether to implement product analytics. It's how quickly you can start making decisions based on how customers actually use your product rather than how you hope they do.
Related Resources
Deepen your understanding of product analytics and growth strategies with these complementary resources:
- Product Qualified Leads (PQLs) - Learn how to identify and convert users showing buying signals based on product usage
- User Activation Framework - Build systematic approaches to getting users to their first value moment
- Usage-Based Expansion Strategy - Leverage product analytics to drive expansion revenue through usage patterns
- Proactive Customer Success - Use product data to deliver preventive, data-driven customer success interventions

Senior Operations & Growth Strategist
On this page
- Why Product Analytics Matters for SaaS
- Usage-Based Pricing Models
- Product-Led Growth Strategies
- Churn Prediction and Prevention
- Feature Adoption Tracking
- Customer Health Scoring
- Core Analytics Platforms
- Amplitude vs Mixpanel
- PostHog (Open-Source Option)
- Heap (Auto-Capture Approach)
- Pendo (Combined Analytics + Guidance)
- When to Use Multiple Tools
- Event Tracking Framework
- Event Taxonomy Design
- User Identification Strategy
- Properties and Attributes
- Event Naming Conventions
- Documentation Requirements
- Key Metrics to Track
- Activation Metrics (Aha Moment)
- Engagement Metrics (DAU, WAU, MAU)
- Retention Cohorts
- Feature Adoption Rates
- Power User Behaviors
- Expansion Indicators
- Implementation Phases
- Phase 1: Core Tracking (Authentication, Key Actions)
- Phase 2: Feature-Level Tracking
- Phase 3: Advanced Analytics (Funnels, Cohorts)
- Phase 4: Predictive Models
- Technical Implementation
- Client-Side vs Server-Side Tracking
- SDK Integration Patterns
- Data Layer Architecture
- Privacy and Compliance (GDPR, CCPA)
- Data Quality Assurance
- Analytics for Different Roles
- Product Team Dashboards
- Customer Success Views
- Sales Intelligence
- Executive Reporting
- Connecting Product Data to Revenue
- CRM Integration Patterns
- Usage-Based Health Scores
- Expansion Signal Detection
- Churn Risk Identification
- Advanced Use Cases
- A/B Testing Infrastructure
- Behavioral Cohort Analysis
- Conversion Funnel Optimization
- Feature Flag Analytics
- Common Implementation Mistakes
- Conclusion
- Related Resources