Churn Reduction Framework: Systematic Approach to Retention Optimization
Turn this article into takeaways for your work.
Each assistant summarizes the article only for you and suggests best practices for your work.
A 5% reduction in churn can increase company valuation by 25-95%. Yet most companies treat churn as an unfortunate reality rather than a solvable operational problem.
The churn crisis in SaaS stems from a fundamental misunderstanding. Most teams view churn as a sales or product failure requiring better targeting or features. In reality, churn is an operational failure requiring systematic identification, intervention, and prevention. Understanding SaaS economics and unit metrics is essential for quantifying churn's true impact on business health.
Companies that reduce churn successfully don't rely on better features or more persuasive sales conversations. They build comprehensive operating systems that monitor customer health continuously, detect risk signals early, intervene effectively, and learn from every lost customer. They've transformed churn reduction from reactive firefighting into proactive operational discipline.
Understanding Churn Fundamentals
Not all churn is created equal. Different metrics measure different aspects of customer loss.
Logo churn vs revenue churn distinguishes between losing customers and losing money. Logo churn measures the percentage of customers who cancel. Revenue churn measures the percentage of revenue lost from those cancellations.
A company that loses 5% of customers but those customers represent only 2% of revenue has 5% logo churn but 2% revenue churn. The reverse scenario (2% logo churn, 5% revenue churn) indicates you're losing your most valuable customers.
Track both metrics. Logo churn reveals product-market fit and customer satisfaction. Revenue churn reveals business sustainability and customer concentration risk.
Gross churn vs net churn separates total losses from expansion-adjusted losses. Gross churn measures revenue lost from cancellations and downgrades. Net churn subtracts expansion revenue from existing customers.
A company with 5% gross churn and 8% expansion from remaining customers has -3% net churn (negative churn). Revenue from existing customers grows despite some customer losses. This metric reveals whether expansion revenue offsets customer losses. Achieving strong Net Revenue Retention (NRR) requires balancing churn prevention with expansion strategies.
Good churn vs bad churn distinguishes between customers you want to lose and customers you need to retain. Good churn happens when non-ideal customers (wrong size, wrong industry, wrong use case) leave. These customers wouldn't have succeeded long-term anyway.
Bad churn happens when ideal customers who fit your target profile leave. A mid-market B2B software company losing enterprise customers represents good churn if they don't serve enterprise needs well. The same company losing mid-market customers in their core industry represents bad churn.
Acceptable churn rates by segment vary dramatically:
SMB customers: 3-7% monthly churn (30-60% annually) is typical due to high business failure rates and low switching costs.
Mid-market: 1-3% monthly churn (10-30% annually) reflects more stable businesses and higher implementation investment.
Enterprise: Less than 1% monthly churn (under 10% annually) is standard given high switching costs and deep integrations.
Understanding these benchmarks prevents panic over normal churn rates while highlighting when rates exceed healthy levels.
The Four Churn Types
Different churn causes require different prevention and intervention strategies.
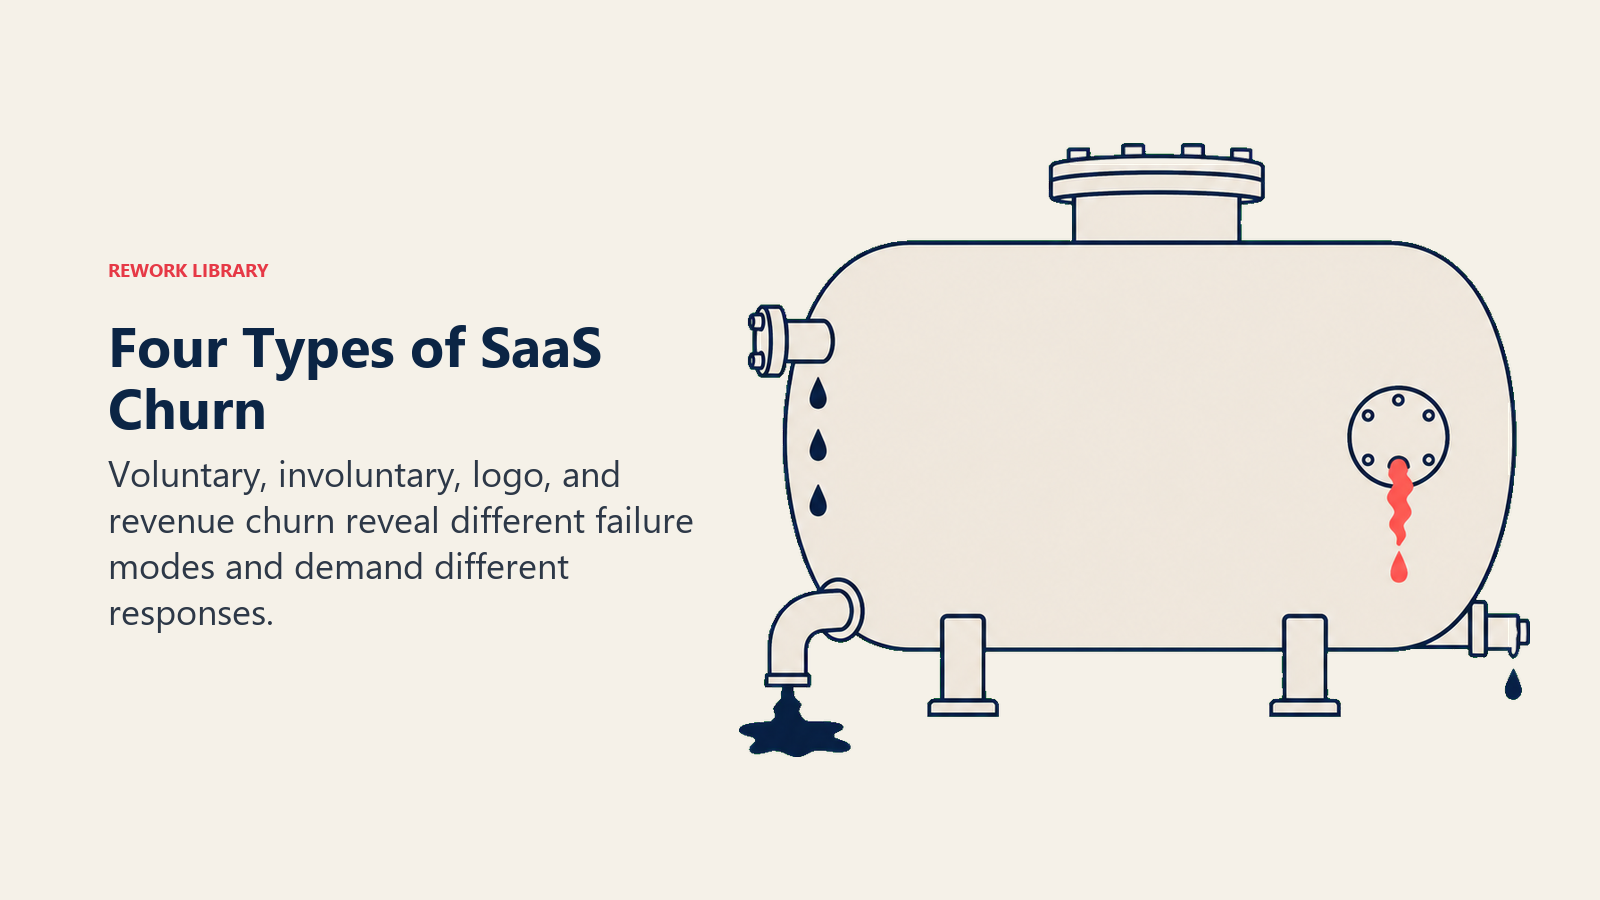
Voluntary churn occurs when customers actively choose to cancel. They evaluate your product against alternatives, decide it's not delivering sufficient value, and deliberately terminate their subscription.
Voluntary churn represents the most addressable churn type because it stems from fixable problems: poor onboarding, insufficient value realization, better competitive alternatives, or relationship failures.
Involuntary churn happens when customers don't intend to cancel but payment failures cause subscription termination. Expired credit cards, insufficient funds, or billing errors create involuntary churn.
Involuntary churn is often the easiest to reduce. Payment recovery systems, automated payment method updates, and proactive billing notifications can recover 20-40% of involuntary churn. Implementing cancellation flow optimization strategies can further reduce unnecessary losses.
Organizational churn results from company events beyond product satisfaction. Mergers eliminate redundant tools. Acquisitions change vendor preferences. Bankruptcies end all subscriptions. Leadership changes trigger vendor reviews.
Organizational churn is hardest to prevent because it's not about product value. However, early detection of organizational events enables transition management and potential win-back conversations with new entities.
Structural churn indicates fundamental product-market fit issues. Customers consistently churn because your product doesn't solve their core problems, pricing doesn't match perceived value, or your target market has inherent retention challenges.
Structural churn requires product or positioning changes, not just better customer success. If every cohort churns at 10% monthly regardless of onboarding quality, you have structural problems.
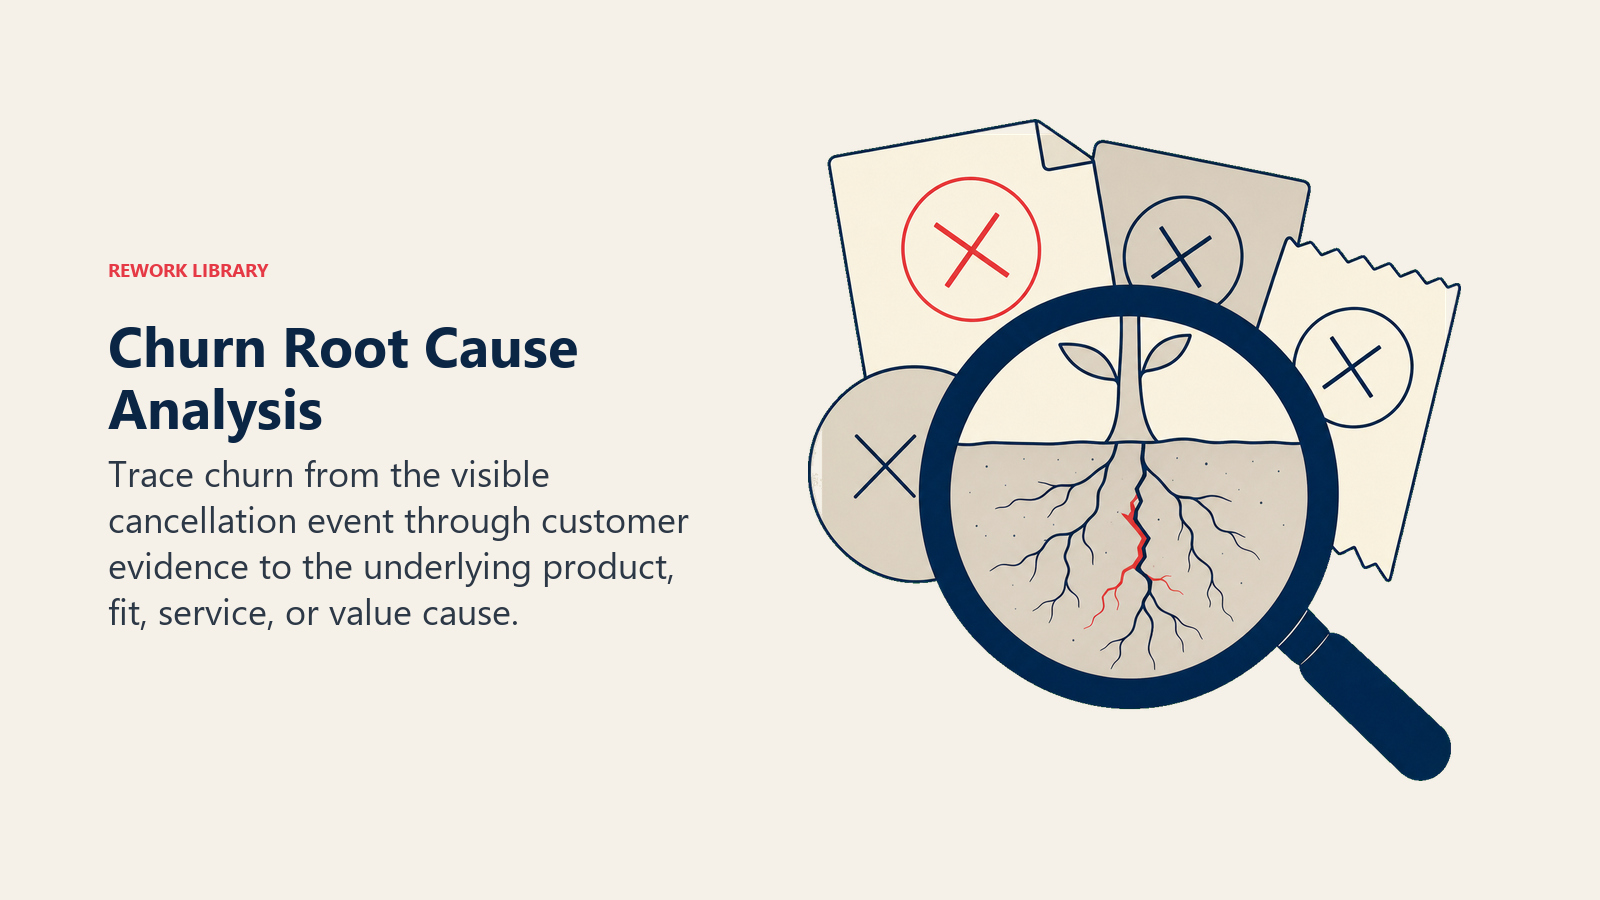
Root Cause Analysis Framework
Understanding why customers churn enables targeted prevention strategies.
Onboarding failure represents customers who never successfully adopted your product. They signed up, maybe logged in a few times, but never achieved meaningful outcomes or integrated your product into workflows.
These customers churn in their first 90 days because they never experienced value. Prevention requires onboarding and time-to-value optimization that accelerates meaningful outcomes and ensures customers achieve critical early milestones.
Value realization failure describes customers who used your product but didn't achieve expected outcomes. They adopted features, invested time learning, but never saw promised results materialize.
These customers typically churn after 3-12 months once they conclude your product won't deliver anticipated value. Prevention requires proactive customer success that ensures outcome achievement.
Product fit failure happens when customers realize your product doesn't match their actual needs. They thought your CRM would work for their complex sales process, but it's built for simpler deals. They expected marketing automation but got basic email tools.
These customers churn when they find better-fit alternatives. Prevention requires better pre-sale qualification that prevents poor-fit customers from buying in the first place.
Competitive displacement occurs when competitors offer superior products, better pricing, or more attractive terms. Your customers don't dislike your product. They just like a competitor's more.
These customers often churn at renewal when they've had time to evaluate alternatives. Prevention requires continuous product improvement and differentiation that maintains competitive advantages.
Economic factors drive churn during budget cuts, downsizing, or financial challenges. Customer companies reduce costs by eliminating nice-to-have tools, consolidating vendors, or renegotiating contracts.
Economic churn spikes during recessions but happens continuously at struggling companies. Prevention requires positioning your product as must-have rather than nice-to-have.
Relationship failure results from poor customer service, unresponsive support, broken promises, or champion departure without relationship transfer.
These customers churn because they've lost confidence in you as a partner even if they still value the product. Prevention requires relationship management that survives personnel changes and maintains trust.
Organizational change includes mergers, acquisitions, restructuring, and leadership transitions that trigger vendor reviews or technology consolidation.
While often unavoidable, early detection enables transition planning that preserves relationships through organizational changes.
The Churn Reduction Operating System
Systematic churn reduction requires five interconnected components.
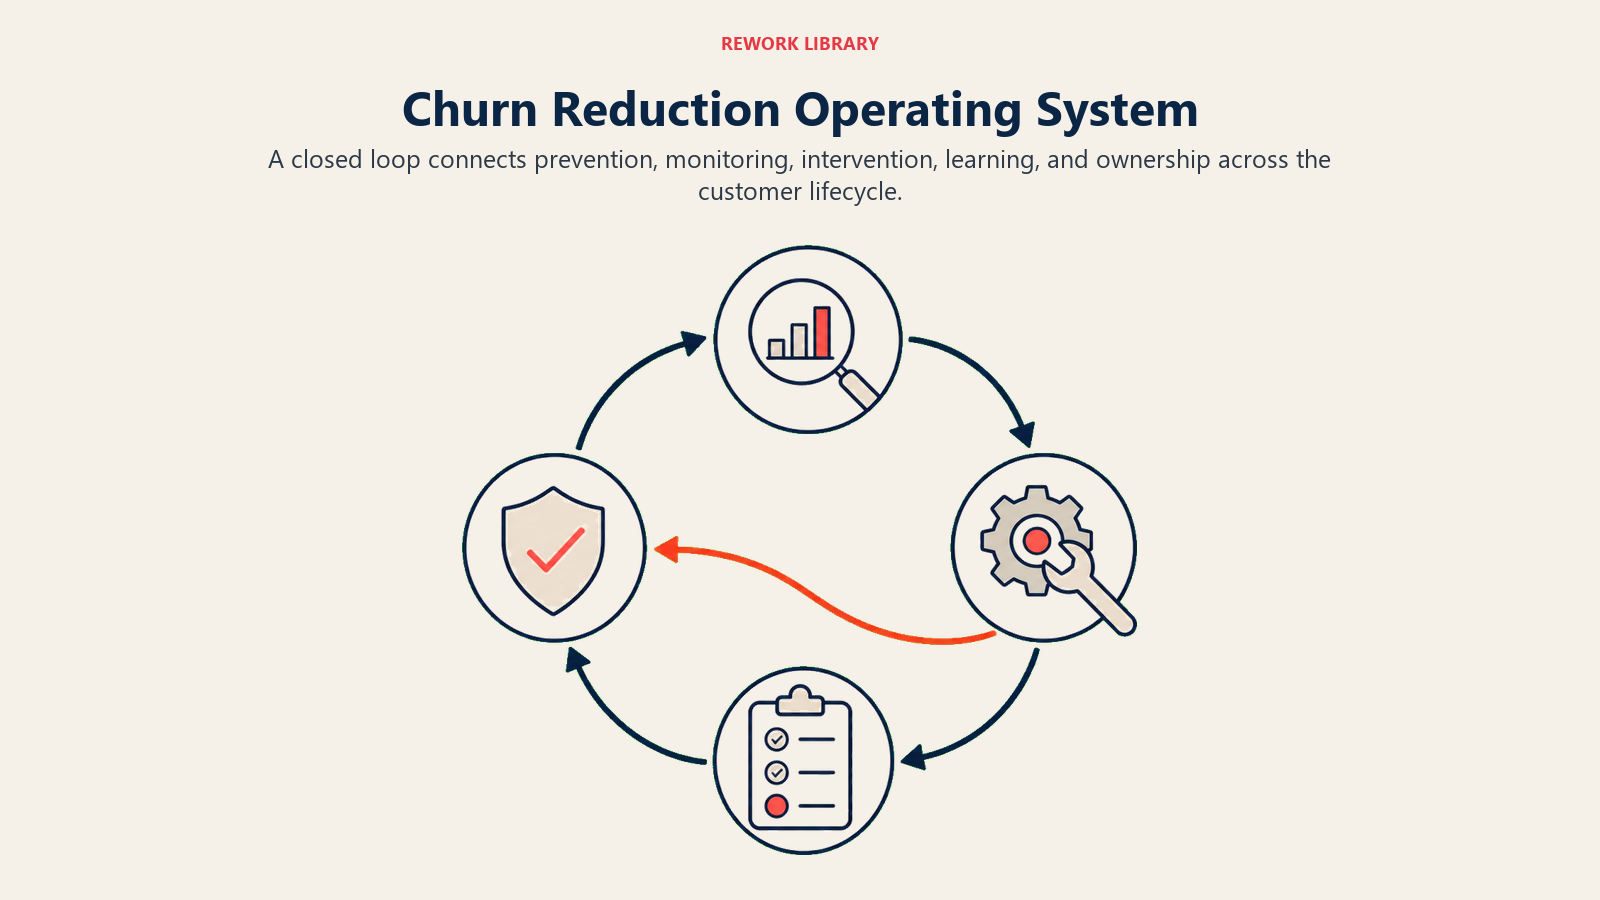
Prevention: Proactive health monitoring identifies and addresses problems before they become churn risks. Customer health scoring surfaces which customers are thriving and which are struggling. Regular business reviews reinforce value. Success planning aligns your roadmap with customer objectives.
Prevention works because it addresses problems when they're small and fixable rather than waiting until customers decide to leave.
Detection: Early warning signals alert teams when customers show churn risk indicators. Usage decline, engagement drop-off, support ticket sentiment, and contract signals all predict future churn. Churn risk detection systems aggregate these signals into actionable alerts.
Detection works because most churn signals appear 60-90 days before cancellation. Early detection enables intervention while customers remain persuadable.
Intervention: Save playbooks provide structured approaches to winning back at-risk customers. Different churn causes require different interventions. Customers churning due to lack of value need outcome recovery plans. Those facing budget constraints need pricing flexibility. Those frustrated with support need relationship repair.
Intervention works when it's tailored to specific churn reasons rather than generic "please don't leave" conversations.
Learning: Post-churn analysis extracts insights from every lost customer. Exit interviews reveal true churn reasons. Cohort analysis identifies which customer segments churn most frequently. Win/loss analysis against competitors shows where you're losing ground.
Learning works by feeding insights back into prevention strategies. Patterns detected in churned customers guide improvements that prevent similar future losses.
Optimization: Continuous improvement refines each system component based on performance data. Which health score indicators best predict churn? Which intervention playbooks have highest save rates? Which customer segments have highest retention?
Optimization compounds over time. Small improvements in detection accuracy, intervention effectiveness, and prevention focus yield significant churn reduction.
Prevention Strategies
The best churn fight is the one you never have because customers never consider leaving.
Onboarding excellence establishes strong foundations during critical first 90 days. Time-to-value optimization ensures customers achieve meaningful outcomes quickly. Guided onboarding walks customers through critical setup steps. Success milestones celebrate early wins that build momentum. Implementing a comprehensive user activation framework ensures customers reach their "aha moment" quickly.
Companies with exceptional onboarding reduce first-year churn by 30-50% compared to companies with poor onboarding.
Regular business reviews maintain ongoing value demonstration and relationship depth. Quarterly business reviews showcase outcomes achieved, ROI delivered, and future opportunities. These conversations reinforce why customers buy while identifying potential issues before they become problems. Establishing periodic business reviews as a standard practice strengthens customer relationships and prevents drift.
Customers who participate in regular business reviews churn at one-third the rate of those who don't.
Success planning aligns your product roadmap with customer objectives. Customers articulate their business goals. You map how your product helps achieve them. Together you track progress and adjust strategies.
Success planning transforms your product from a tool customers use into a strategic asset invested in their success.
Engagement programs maintain customer connections through community, education, and events. User communities provide peer support and knowledge sharing. Training programs ensure customers maximize product capabilities. Events create belonging and network effects.
Engaged customers who participate in community and training churn at less than half the rate of disengaged customers.
Product adoption monitoring tracks which features customers use and which they ignore. Low adoption of core features predicts churn. High adoption of advanced features predicts retention and expansion.
Proactive adoption campaigns target customers with low usage, providing guided tours, best practices, and optimization sessions that increase feature utilization.
Detection and Early Warning
Finding at-risk customers before they decide to leave creates intervention opportunities.
Usage decline patterns reveal disengagement before customers communicate dissatisfaction. Login frequency drops from daily to weekly. Session duration decreases. Feature usage narrows to basic capabilities only.
Set alerts for 30% usage declines over 30 days. These thresholds catch meaningful changes without generating false positives from normal usage variation. Implementing comprehensive usage monitoring and alerts enables early detection of at-risk accounts.
Engagement drop-off signals show relationship deterioration. Customers stop responding to emails. They cancel scheduled business reviews. Champions become unresponsive or leave the company without introducing replacements.
Unresponsiveness often predicts churn 60-90 days before cancellation. It signals customers have mentally moved on even if they haven't formally canceled.
Support ticket sentiment indicates customer frustration levels. Negative language, repeated issues, and escalation patterns predict churn. Customers who feel their problems aren't being solved start looking for alternatives.
Analyze ticket sentiment using text analysis tools. Identify accounts with consistently negative sentiment or sentiment deterioration over time.
Contract and billing signals provide concrete churn indicators. Customers request contract terms, ask about cancellation policies, or question billing charges. These questions often precede formal cancellation notices.
Train support teams to flag these conversations for immediate account team follow-up.
Stakeholder changes create risk when champions leave, executives change, or organizational restructuring happens. New stakeholders haven't experienced your value and may review all vendor relationships.
Monitor LinkedIn and press releases for organizational changes at customer accounts. Proactively reach out to introduce yourself to new stakeholders.
Intervention Playbooks
Once churn risk is detected, structured intervention increases save rates.
Executive alignment calls engage senior leadership at at-risk accounts. Sometimes customer users love your product but executives don't see strategic value. Direct executive conversations can reframe your product as strategic investment rather than departmental expense.
Business value reviews quantify outcomes achieved and ROI delivered. Customers considering cancellation often haven't recently evaluated actual value received. Comprehensive value reviews showing time saved, revenue generated, or costs avoided can shift cancellation decisions.
Product optimization sessions help struggling customers improve their implementation. Poor configuration, underutilized features, or workflow misalignment often cause dissatisfaction. Technical optimization that improves their experience can transform frustrated customers into advocates.
Pricing/packaging adjustments address affordability concerns. Customers facing budget constraints might stay at reduced pricing rather than churn entirely. Downgrades preserve relationships and create future upsell opportunities once budgets recover. Understanding SaaS pricing models enables flexible retention-focused pricing strategies.
Outcome recovery plans help customers who haven't achieved expected results. Work with them to diagnose why outcomes aren't materializing. Adjust implementation, provide additional training, or modify success criteria to align expectations with reality.
Win-back offers and incentives provide financial motivation to stay. Discount next renewal, extend contract at current rates, or include premium features temporarily. These offers work for price-sensitive customers but fail when core dissatisfaction isn't economic.
Organizational Structure
Churn reduction requires clear ownership and appropriate incentives.
Retention team responsibilities vary by company structure. Some companies create dedicated retention specialists who handle at-risk accounts. Others distribute retention across CSMs with specific save responsibilities.
Regardless of structure, someone must own churn metrics and retention initiatives.
CSM churn targets and incentives align customer success behavior with retention objectives. CSMs compensated purely on expansion neglect retention. Those compensated on Net Revenue Retention balance growth and retention appropriately.
Many companies use tiered compensation: base comp for retention above threshold, upside comp for expansion revenue.
Cross-functional churn committees bring together product, sales, customer success, and support to address systemic churn causes. Monthly churn reviews analyze recent losses, identify patterns, and initiate cross-functional improvement projects.
This prevents churn from being solely a customer success problem when root causes span multiple departments.
Executive escalation paths define when senior leadership engages with at-risk customers. Clear criteria (ARR thresholds, strategic accounts, recoverable situations) determine which situations warrant executive involvement.
Executive engagement signals customer importance and can save relationships that frontline teams can't.
Metrics and Continuous Improvement
Measurement enables optimization. Track metrics that reveal performance and guide improvements.
Monthly/annual churn rates provide baseline retention performance. Calculate both to understand short-term volatility and long-term trends. Monthly churn volatility is normal. Annual churn trends reveal systematic improvements or deterioration.
Churn by segment, cohort, source identifies which customer types churn most. Segment analysis shows SMB vs enterprise retention differences. Cohort analysis reveals whether recent customers retain better than older cohorts. Source analysis shows which acquisition channels generate highest-quality customers. Effective customer segmentation enables targeted retention strategies for each customer type.
Save rate and intervention effectiveness measure how often intervention attempts succeed. Overall save rate (saves attempted / saves succeeded) and playbook-specific rates reveal which approaches work. Optimize resources toward highest-performing interventions.
Leading indicators dashboard surfaces predictive metrics that forecast future churn. Health score distribution, at-risk account count, intervention queue depth, and usage trend analysis predict next quarter's churn before it happens.
Churn impact on ARR and LTV quantifies business impact. Calculate monthly recurring revenue lost to churn and customer lifetime value impact. This economic view justifies retention investments and prioritizes high-impact initiatives.
The companies winning at churn reduction recognize that every percentage point of churn reduction is worth 10-20x in enterprise value. They've built systematic operations that prevent churn before it starts, detect it early when it emerges, intervene effectively when customers waver, and learn continuously from every loss.
Churn reduction isn't a feature improvement project or a sales training initiative. It's an operational discipline requiring dedicated resources, systematic processes, and continuous optimization. Build the operating system. Reduce the churn. Protect the revenue.
Related Resources
Essential Retention Strategies:
- Proactive Customer Success - Build customer success operations that prevent churn before it starts
- Win-Back Campaigns - Re-engage churned customers with strategic win-back programs
- Upsell & Cross-Sell Motions - Transform retained customers into expansion revenue opportunities
Post-Sale Management Foundations:
- Churn Prevention Strategy - Foundational approaches to systematic churn prevention
- At-Risk Customer Management - Tactics for identifying and recovering at-risk accounts
- Exit Interviews - Learn from churned customers to improve future retention

Senior Operations & Growth Strategist