Product Qualified Leads (PQLs): Using Product Data to Identify High-Intent Buyers
Turn this article into takeaways for your work.
Each assistant summarizes the article only for you and suggests best practices for your work.
The best buying signals aren't on forms. They're in your product usage data.
When someone fills out a "Request Demo" form, they might be interested. When someone has logged in daily for two weeks, added their entire team, integrated with three other tools, and is hitting usage limits - they're ready to buy.
This is the insight behind product qualified leads. Instead of relying on traditional lead scoring based on demographics and content engagement, PQLs identify buying intent through actual product behavior.
For product-led growth companies, PQLs convert 3-5x better than marketing qualified leads (MQLs) because they're based on demonstrated value, not predicted interest. Users who are already getting value from your product in a freemium or free trial model are exponentially more likely to become paying customers.
What Are Product Qualified Leads?
Product qualified leads are free or trial users who exhibit strong buying signals through their product usage behavior and firmographic fit. They're qualified not by what they say but by what they do. Four key characteristics define PQLs:
Usage-based qualification, not demographic. Traditional MQLs qualify based on company size, industry, role, and content engagement. PQLs qualify based on login frequency, feature adoption, team size, outcomes achieved, and usage patterns.
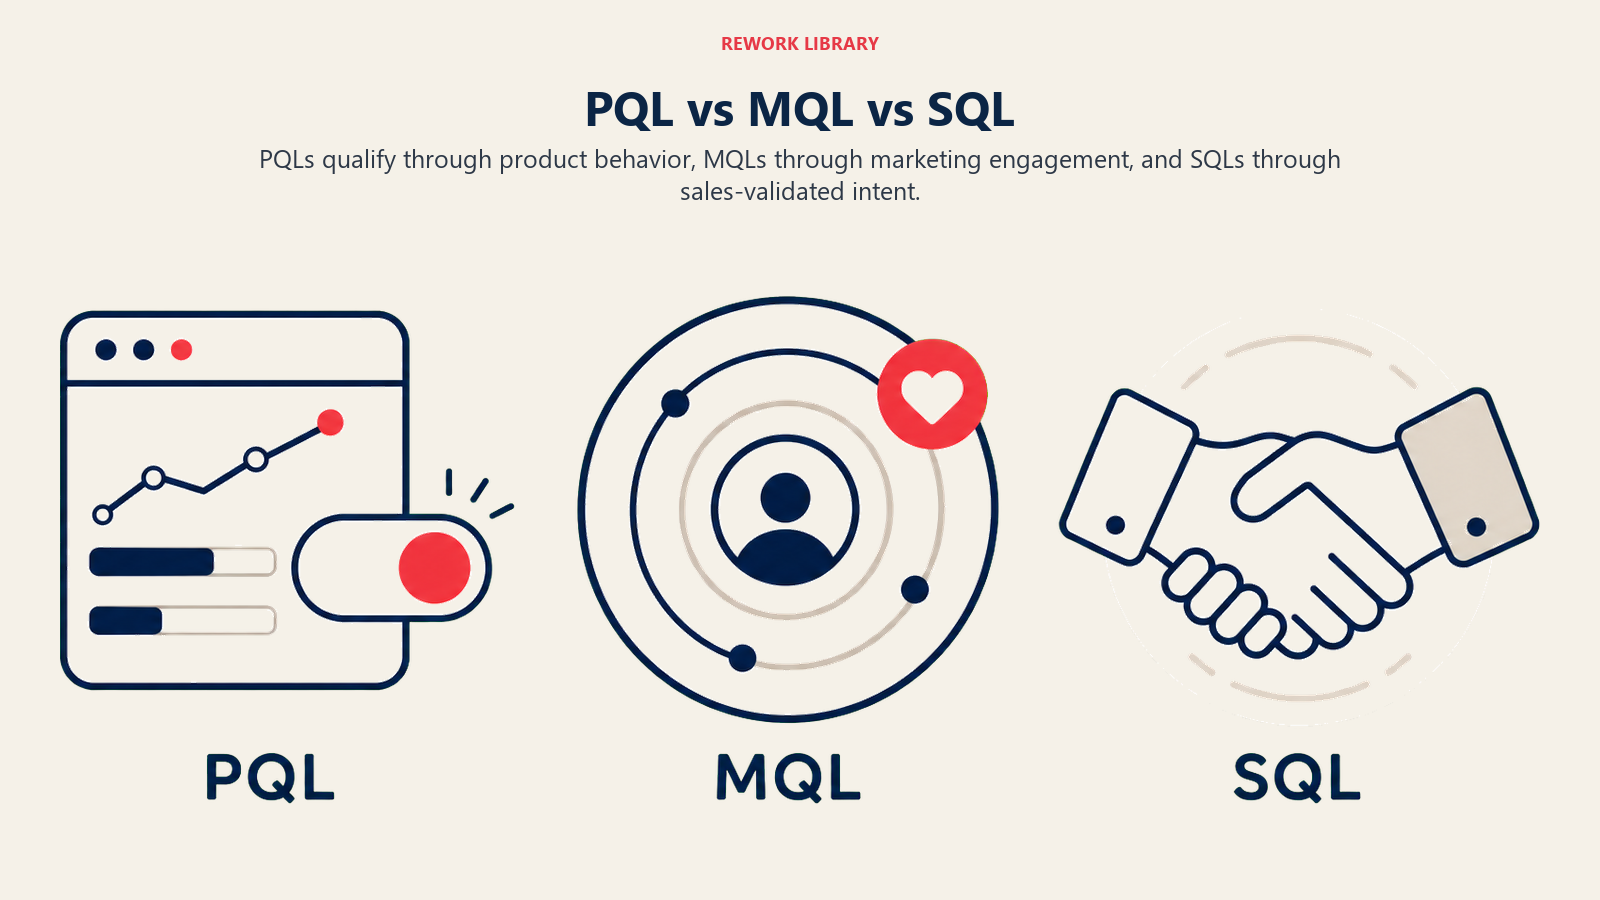
Alternative to traditional MQL/SQL framework. While MQLs and SQLs (sales qualified leads) rely on marketing and sales teams to identify potential, PQLs let the product reveal buying intent automatically.
Based on engagement and value realization. PQLs have actually used your product and experienced value. They understand what it does, how it helps them, and why they might need more. This dramatically reduces sales cycle friction.
Triggers sales outreach in PLG motion. In a product-led growth strategy, PQLs indicate when it's appropriate for sales to engage. Instead of cold outreach, sales contacts users who are already engaged and experiencing value through usage-based sales triggers.
PQLs vs MQLs vs SQLs: Understanding the Differences
Let's compare the three qualification frameworks:
MQL (Marketing Qualified Lead)
Qualification criteria:
- Downloaded whitepaper or attended webinar
- Visited pricing page 3+ times
- Engaged with email campaigns
- Matches ICP based on firmographics (company size, industry, role) Conversion rates: 10-15% MQL to opportunity typically Who qualifies: Marketing team based on scoring models
Next step: Hand off to sales for qualification call
Problem: Many MQLs are just researching, not ready to buy
SQL (Sales Qualified Lead)
Qualification criteria:
- Has budget for solution
- Has decision-making authority
- Articulated clear need
- Committed to evaluation timeline
- (BANT framework: Budget, Authority, Need, Timeline)
Conversion rates: 20-30% SQL to closed-won typically
Who qualifies: Sales team through discovery calls
Next step: Move into active sales process (demo, evaluation, proposal)
Problem: Requires sales time investment before knowing if opportunity is real
PQL (Product Qualified Lead)
Qualification criteria:
- Active usage (daily/weekly logins)
- Feature adoption (using key features)
- Team expansion (invited teammates)
- Achieved outcomes (completed workflows)
- Hitting limitations (reaching free tier caps)
Conversion rates: 30-50% PQL to closed-won (much higher!)
Who qualifies: Automated scoring based on product analytics
Next step: Sales reaches out with contextual, helpful message
Problem: Only works for products with free/trial offerings
Why PQLs Convert 3-5x Better Than MQLs
The conversion advantage comes from several factors:
They've experienced value directly. They're not guessing whether your product will help. They know it does because they're already using it.
Lower friction sales process. Sales conversations start with "How can we help you get more value?" not "Let me convince you that you have a problem."
Self-selection. Users who become PQLs have opted in through usage. They're pre-qualified by their own behavior.
Shorter sales cycles. No need for long discovery or demos showing basic features. They've already seen them.
Better product-market fit. If your PQL conversion rates are high, it validates strong product-market fit. Users who try your product love it enough to pay for it.
Complementary Frameworks (Not Replacement)
PQLs don't replace MQLs and SQLs entirely. Many successful companies use all three:
- MQLs for brand-aware prospects who aren't ready to try the product yet
- PQLs for users who've tried the product and shown buying signals
- SQLs for qualified opportunities regardless of source (MQL or PQL)
The key is recognizing that PQLs are often the highest-quality lead source for product-led companies. Understanding how to leverage product-led sales strategies helps you integrate all three frameworks effectively.
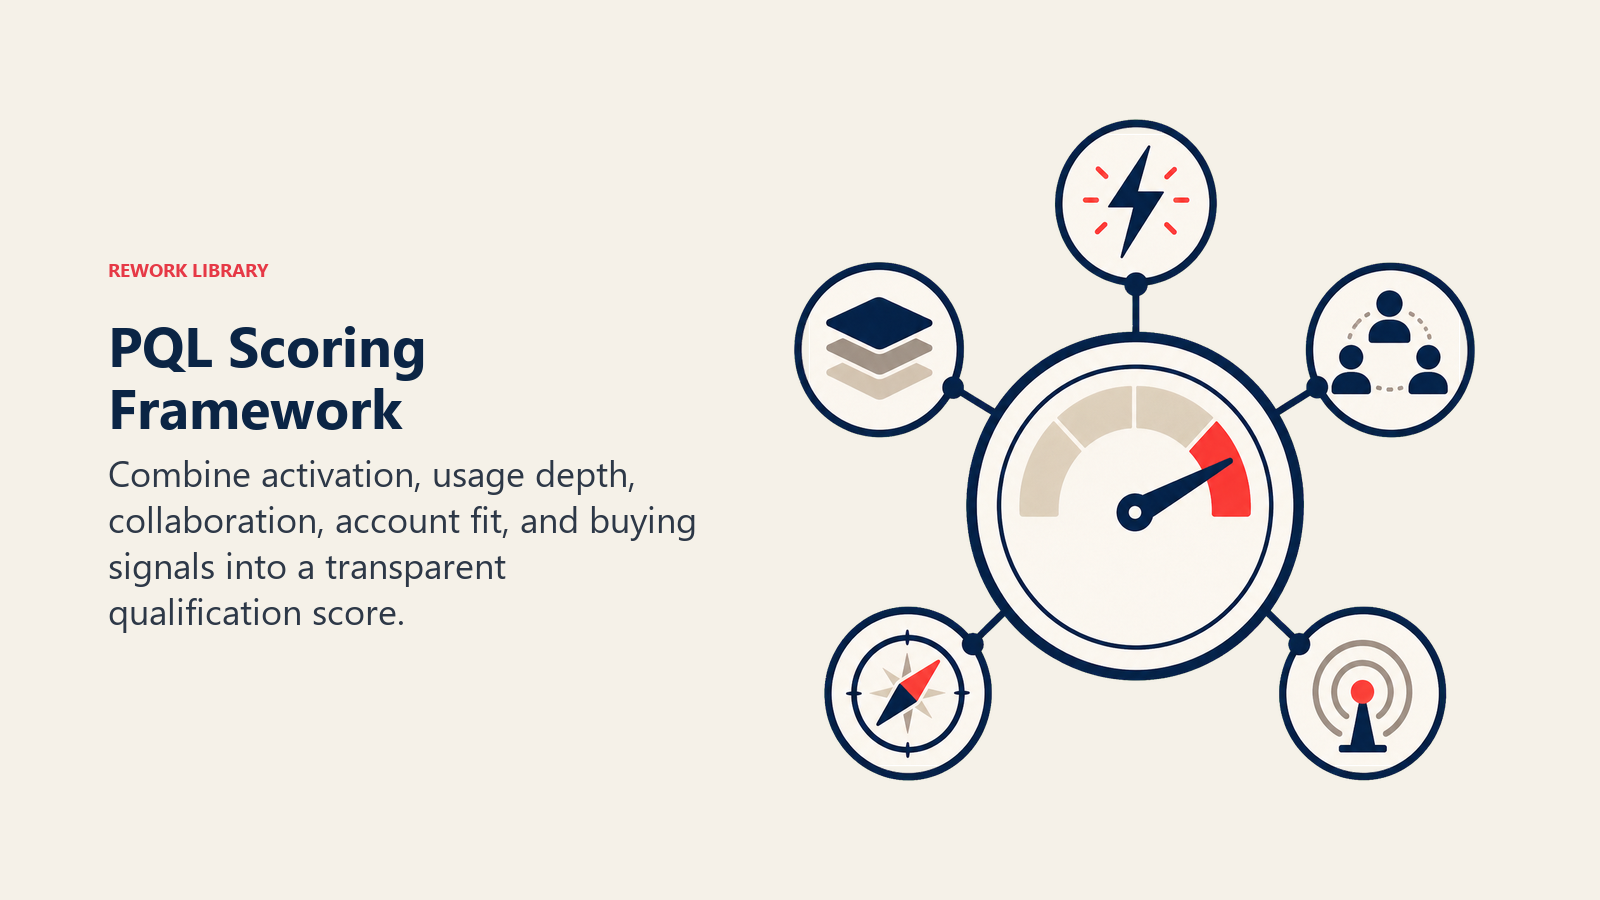
The PQL Scoring Framework
Building a systematic PQL scoring model requires evaluating leads across multiple dimensions:
Dimension 1: Engagement Depth (Feature Usage, Frequency)
What to measure:
- Login frequency (daily, weekly, monthly active users)
- Feature breadth (how many features used)
- Feature depth (advanced vs basic feature usage)
- Session duration and activity level Scoring example:
- Daily active user: +20 points
- Used 5+ features: +15 points
- Used advanced features: +10 points
- Sessions averaging 15+ minutes: +10 points Why it matters: Engaged users understand your value and are more likely to pay for more.
Dimension 2: Team Expansion (Users Added, Invites Sent)
What to measure:
- Number of team members added
- Invites sent (even if not accepted)
- Cross-functional usage (different roles/departments)
- Admin or owner role assignment
Scoring example:
- Added 3+ teammates: +25 points
- Sent 5+ invites: +15 points
- Multiple departments using: +20 points
- Set up team workspace: +15 points
Why it matters: Team adoption signals organizational buy-in and reduces single-user churn risk.
Dimension 3: Value Realization (Completed Workflows, Outcomes)
What to measure:
- Activation milestones achieved
- Workflows completed end-to-end
- Outcomes or goals accomplished
- Data or content created
Scoring example:
- Reached aha moment: +30 points
- Completed 10+ workflows: +20 points
- Achieved stated goal: +25 points
- Created 50+ records/items: +15 points
Why it matters: Users who've achieved real outcomes have experienced tangible value worth paying for. Optimizing your user activation framework ensures more users reach these critical milestones.
Dimension 4: Upgrade Signals (Hitting Limits, Exploring Paid Features)
What to measure:
- Hitting free tier usage limits
- Attempting to use paid-only features
- Viewing pricing page
- Clicking upgrade prompts
Scoring example:
- Hit usage limit 3+ times: +30 points
- Attempted paid feature: +25 points
- Visited pricing page: +15 points
- Clicked upgrade CTA: +20 points
Why it matters: These are explicit buying signals. Users are showing they need more than free tier provides.
Dimension 5: Firmographic Fit (Company Size, Industry)
What to measure:
- Company size matches ICP
- Industry matches target verticals
- Revenue range fits your pricing
- Tech stack indicates good fit
Scoring example:
- Company size 50-500 employees (target range): +20 points
- Target industry (SaaS, FinTech, etc.): +15 points
- Revenue >$10M (indicates budget): +10 points
- Uses tools you integrate with: +10 points
Why it matters: Usage signals + firmographic fit = highest probability opportunities.
Total PQL Score and Thresholds
Combine scores across dimensions:
Total Score = Engagement + Team + Value + Signals + Fit
Scoring thresholds:
- 0-50 points: Not qualified (nurture in free tier)
- 51-75 points: Warm PQL (automated nurture + monitoring)
- 76-100 points: Hot PQL (sales outreach within 24 hours)
- 100+ points: Critical PQL (immediate sales engagement)
The exact scoring and thresholds should be calibrated based on your product and what predicts conversion in your specific context.
Defining PQL Criteria: Product-Specific Examples
PQL criteria vary by product type. Here are examples:
Collaboration Tool (like Slack)
Critical criteria:
- 2,000+ messages sent by team (Slack's aha moment)
- 10+ team members active
- 3+ channels created
- Daily usage for 7+ days
- Integration with email or calendar
Project Management Tool (like Asana)
Critical criteria:
- 3+ projects created
- 20+ tasks completed
- 5+ team members added
- Used for 2+ weeks consistently
- Set up at least one custom workflow
Analytics Tool (like Amplitude)
Critical criteria:
- Tracked 10K+ events
- Created 5+ dashboards or reports
- Shared reports with team
- Used weekly for 3+ weeks
- Hit data volume limits
Design Tool (like Figma)
Critical criteria:
- Created 10+ design files
- Shared files with others 5+ times
- Team members added comments
- Used advanced features (components, prototyping)
- Daily usage for 2+ weeks
The key is identifying behaviors that correlate strongly with conversion in your product. Analyze your existing customer cohorts to find these patterns, which you can then leverage in your trial-to-paid conversion strategy.
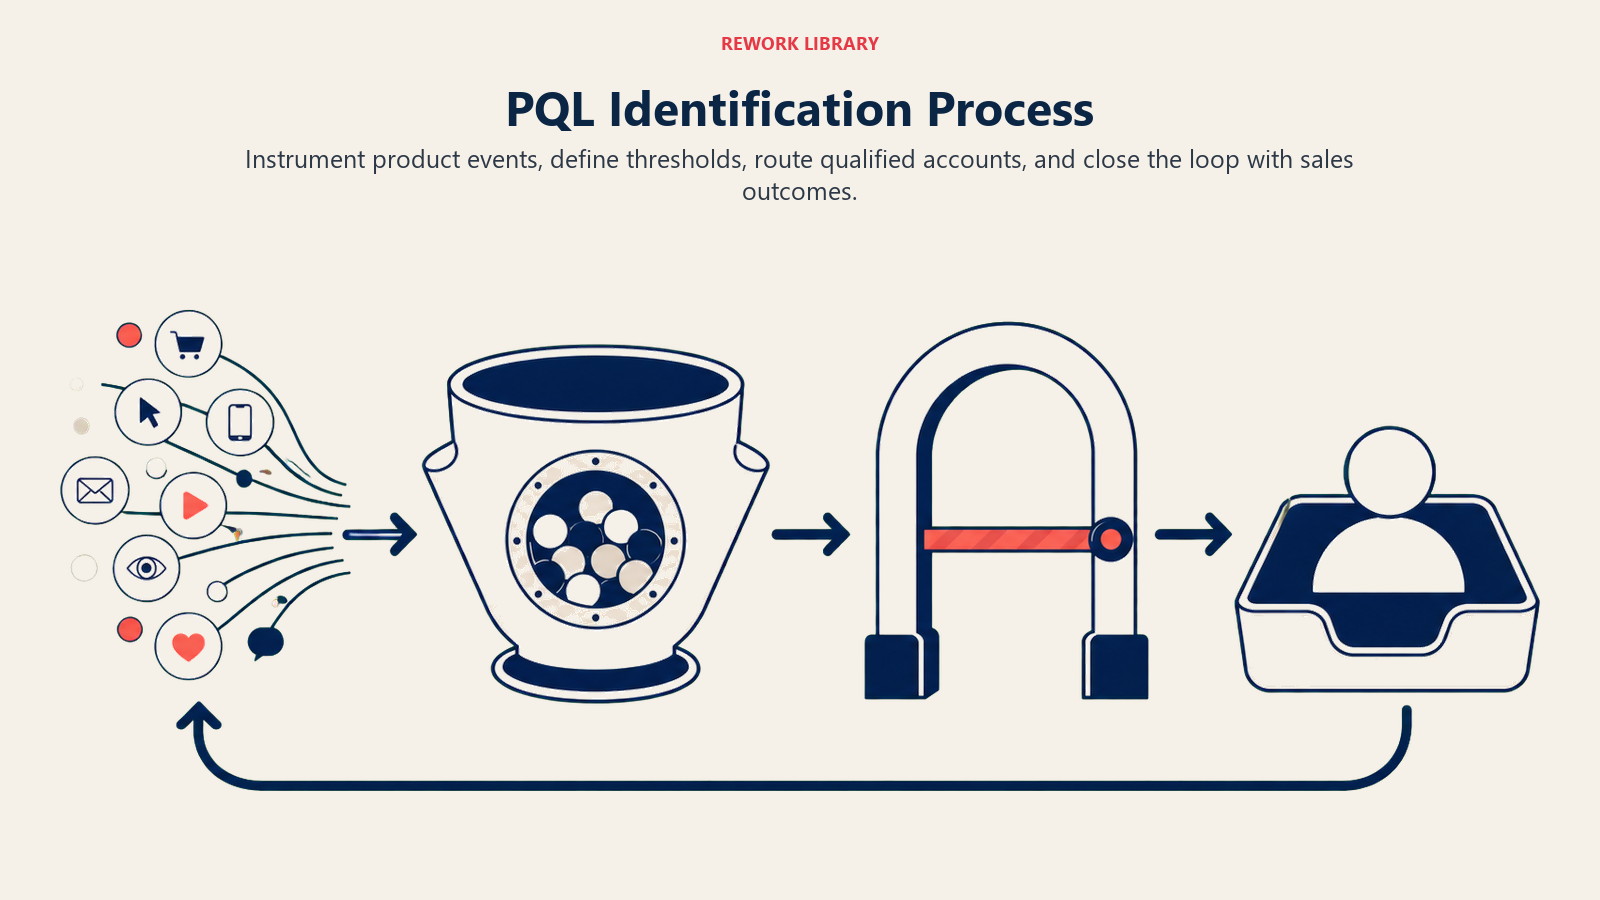
PQL Identification Process: Making It Operational
Building a PQL system requires specific infrastructure:
Product Analytics Setup Requirements
Event tracking:
- User actions (logins, feature usage, workflows completed)
- Team actions (invites sent, members added, sharing)
- Limit encounters (hitting caps, attempting paid features)
- Conversion events (viewing pricing, starting checkout) User properties:
- Firmographic data (company, size, industry)
- Usage metadata (signup date, plan type, activation status)
- Engagement metrics (DAU/MAU, feature breadth, depth) Tools commonly used:
- Amplitude or Mixpanel for product analytics
- Segment for data collection and routing
- Custom data warehouse for advanced analysis
Learn more about implementing these tools in our product analytics setup guide.
Event Tracking and User Properties
Define specific events that contribute to PQL scoring:
// Example event structure
{
  event: "feature_used",
  user_id: "user123",
  properties: {
    feature: "advanced_analytics",
    is_paid_feature: true,
    usage_count: 5
  },
  timestamp: "2025-01-15T10:30:00Z"
}
Track user-level properties that update based on behavior:
// Example user properties
{
  user_id: "user123",
  company_size: 150,
  industry: "SaaS",
  activation_date: "2025-01-10",
  team_size: 8,
  pql_score: 85,
  pql_status: "hot"
}
Scoring Model Implementation
Calculate PQL scores in real-time or daily batch:
Real-time scoring: Updates immediately when users perform qualifying actions. Enables instant sales alerts.
Batch scoring: Recalculates daily based on rolling windows of activity. Less resource-intensive.
Most companies use daily batch scoring with real-time updates for critical signals (pricing page views, limit hits).
Real-Time Lead Generation
When users cross PQL thresholds, trigger alerts:
To sales team:
- Slack notification: "Hot PQL: Company X hit 85 score"
- Email with usage context and company info
- CRM task assignment
To users (in some cases):
- In-app message offering help or trial extension
- Email from success team with upgrade assistance
- Personalized upgrade offer
CRM Integration and Handoff
PQLs should flow into your CRM automatically:
Data to sync:
- PQL score and status
- Usage summary (features used, team size, activity level)
- Firmographic data
- Trigger events (what made them a PQL)
- Recommended next action
Common integrations:
- Salesforce, HubSpot, Pipedrive
- API-based syncing via Zapier or custom builds
- Reverse ETL tools like Census or Hightouch
The goal is giving sales complete context when they reach out. A well-configured SaaS tech stack ensures seamless data flow from product to CRM.
PQL Prioritization Tiers
Not all PQLs are equal. Prioritize based on combined usage and fit:
Hot PQLs: Ready to Buy Now (Immediate Outreach)
Characteristics:
- High PQL score (90+)
- Recent surge in activity
- Hit multiple usage limits
- Strong firmographic fit
- Viewed pricing in last 48 hours
Action: Sales outreach within 24 hours (ideally same day)
Approach: Personalized email or call offering upgrade assistance
Warm PQLs: High Engagement (Nurture + Light Touch)
Characteristics:
- Moderate PQL score (70-89)
- Consistent usage over weeks
- Some team adoption
- Good firmographic fit
- Haven't hit hard limits yet
Action: Automated nurture + monitoring for hot signals
Approach: Email sequences showing advanced features, success stories, upgrade benefits
Cool PQLs: Showing Interest (Automated Nurture)
Characteristics:
- Low to moderate PQL score (50-69)
- Occasional usage
- Individual user, no team yet
- Maybe outside ideal ICP
- No urgent buying signals
Action: Keep in automated nurture, re-score regularly
Approach: Educational content, feature highlights, periodic check-ins
Priority Matrix: Usage + Fit Combination
| High Firmographic Fit | Low Firmographic Fit | |
|---|---|---|
| High Usage | Hot PQL - Immediate sales outreach | Warm PQL - Monitor & nurture |
| Low Usage | Warm PQL - Engagement campaigns | Cool PQL - Long-term nurture |
This matrix helps allocate limited sales resources to highest-probability opportunities.
Sales Process for PQLs: Different from Traditional Leads
Selling to PQLs requires a different approach than traditional cold leads:
When to Reach Out (Trigger Timing)
Optimal timing:
- Within 24 hours of becoming Hot PQL
- Immediately after pricing page view + high score
- Same day as hitting usage limit multiple times
- After trial is 50% complete (for trial PQLs) Poor timing:
- Too early (before they've experienced value)
- Too late (after trial expired or they found alternative)
- During low-engagement periods (haven't logged in for a week)
Outreach Messaging (Personalized to Usage)
Traditional lead outreach (generic): "Hi, I saw you downloaded our whitepaper. Would you like to schedule a demo?"
PQL outreach (personalized): "Hi Sarah, I noticed your team has created 15 projects and added 8 members. You're getting great results! I wanted to reach out because you've hit your project limit a few times. Would it help if I showed you how our Pro plan removes these limits and adds team administration features?"
Key differences:
- Reference specific usage patterns
- Acknowledge value they're already getting
- Offer to remove friction, not convince them to try
- Personalize to their actual use case
Sales Motion (Consultative, Not Pushy)
With PQLs, you're not selling from scratch. You're helping users get more value:
Discovery questions:
- "What are you primarily using [product] for?"
- "How's the free tier working for your team?"
- "Are there any limitations you're running into?"
- "What would make [product] even more valuable for you?"
Value demonstration:
- Show how paid features solve their specific problems
- Demonstrate ROI based on their usage patterns
- Share success stories from similar customers
- Address concerns about migration or setup
Conversion Approach (Remove Friction)
Your goal is removing obstacles, not creating urgency:
Remove pricing friction:
- Transparent pricing, no "contact us"
- Show exact cost based on their team size/usage
- Offer annual vs monthly options with savings
Implementing these strategies through pricing page optimization can significantly reduce conversion barriers.
Remove implementation friction:
- "Your data and setup migrate automatically"
- "Upgrade takes one click, no re-onboarding"
- "Your team continues using exactly as before"
Remove decision friction:
- "Try Pro features for 30 days, downgrade anytime"
- "No contract, cancel if it's not valuable"
- Social proof from similar companies
Follow-Up Strategy Based on Response
Engaged response (asking questions, interested):
- Schedule demo or walkthrough
- Provide additional resources
- Follow up within 24-48 hours
Neutral response (need time to decide):
- Offer to check back in a week
- Send relevant case study or ROI resource
- Monitor for re-engagement with product
No response:
- One follow-up after 3-4 days
- Then move back to automated nurture
- Re-engage if usage patterns improve
The key is respecting that PQLs are already engaged with your product. You're helping, not selling hard.
PQL Metrics and Optimization
Track these metrics to measure and improve your PQL program:
PQL Generation Rate (% of Free Users)
Formula: (PQLs generated / Total free users) × 100
Benchmarks:
- 5-10%: Typical for many PLG companies
- 10-20%: Strong PQL generation
- 20%+: Exceptional (product is very engaging)
Optimization: Improve activation and engagement to increase PQL rate
PQL-to-Opportunity Conversion
Formula: (PQLs converting to opportunities / Total PQLs) × 100
Target: 50-70%
If conversion is low, either PQL criteria are too loose (generating low-quality PQLs) or sales approach needs improvement.
PQL-to-Closed-Won Rate
Formula: (PQLs converting to customers / Total PQLs) × 100
Target: 30-50%
This is dramatically higher than MQL-to-closed rates (typically 5-15%), demonstrating PQL advantage.
Time-to-Conversion from PQL Status
Metric: Average days from PQL designation to closed-won
Benchmark: 7-21 days (much faster than traditional sales cycles)
Faster conversion indicates strong buying intent and effective sales process.
Revenue per PQL
Metric: Total revenue / Number of PQLs converted
Helps you understand the economic value of PQLs and justify sales investment.
Iterating on PQL Definition
Continuously refine your PQL criteria:
Analyze false positives: PQLs that didn't convert - what's different about them?
Analyze false negatives: Customers who converted without being flagged as PQL - what signals did we miss?
Adjust scoring weights: Which dimensions actually predict conversion best?
Add or remove criteria: Test new behavioral signals or remove criteria that don't add predictive value
PQL models should evolve as your product and market mature. Building this into your SaaS metrics dashboard enables continuous monitoring and optimization.
Building Your PQL System: Implementation Roadmap
Here's a practical path to implementing PQLs:
Month 1: Define and Track
- Analyze existing customer data to find conversion patterns
- Define PQL criteria based on what successful customers did
- Implement event tracking for these behaviors
- Set up basic scoring model
Month 2: Automate Scoring
- Build automated scoring system (daily batch or real-time)
- Integrate with CRM
- Create sales alerts and workflows
- Train sales team on PQL outreach
Month 3: Test and Refine
- Monitor PQL generation and conversion rates
- Gather sales feedback on lead quality
- Refine scoring criteria based on results
- Optimize outreach timing and messaging
Month 4+: Scale and Optimize
- Expand to multiple PQL tiers (Hot, Warm, Cool)
- Add automated nurture for different tiers
- Build feedback loop from closed-won analysis
- Continuously iterate on criteria and scoring
Tech Stack Recommendations
Product analytics:
- Amplitude (best for SaaS)
- Mixpanel (strong alternative)
- Heap (autocapture events)
Data activation:
- Segment (customer data platform)
- Hightouch or Census (reverse ETL)
CRM:
- Salesforce (enterprise)
- HubSpot (mid-market)
- Pipedrive (smaller companies)
Sales engagement:
- Outreach or SalesLoft (for high-volume PQL outreach)
The key is connecting product usage data to sales workflow seamlessly.
Conclusion: Product Usage as Strongest Buying Signal
Product qualified leads represent a fundamental shift in how product-led companies identify and convert customers. Instead of guessing who might be interested based on demographics and content engagement, you know who's interested based on what they're actually doing with your product.
PQLs convert 3-5x better than MQLs because they're based on demonstrated value, not predicted interest. Users who are already experiencing value from your product are exponentially more likely to pay for more of it.
Build systematic PQL scoring across engagement, team growth, value realization, upgrade signals, and firmographic fit. Make it operational through product analytics, automated scoring, and CRM integration. Train sales to approach PQLs consultatively - helping users get more value, not convincing them to try something new.
Track and optimize PQL generation rates, conversion rates, and time-to-close. Iterate on your PQL criteria based on what actually predicts conversion in your specific product and market.
Product usage is the strongest buying signal you have. Measure it systematically, act on it strategically, and watch conversion rates transform.
Learn More
Ready to implement a PQL program? These related resources will help you build a comprehensive usage-based qualification system:
- Product-Led Growth Strategy: Self-Service Growth Engine
- Product-Led Sales: Combining Product and Sales Motions
- User Activation Framework: Getting Users to Value
- Usage-Based Sales Triggers: When to Engage Users
- Free Trial Optimization: Maximizing Trial Conversions
- Onboarding & Time-to-Value: Accelerating Product Adoption

Senior Operations & Growth Strategist
On this page
- What Are Product Qualified Leads?
- PQLs vs MQLs vs SQLs: Understanding the Differences
- MQL (Marketing Qualified Lead)
- SQL (Sales Qualified Lead)
- PQL (Product Qualified Lead)
- Why PQLs Convert 3-5x Better Than MQLs
- Complementary Frameworks (Not Replacement)
- The PQL Scoring Framework
- Dimension 1: Engagement Depth (Feature Usage, Frequency)
- Dimension 2: Team Expansion (Users Added, Invites Sent)
- Dimension 3: Value Realization (Completed Workflows, Outcomes)
- Dimension 4: Upgrade Signals (Hitting Limits, Exploring Paid Features)
- Dimension 5: Firmographic Fit (Company Size, Industry)
- Total PQL Score and Thresholds
- Defining PQL Criteria: Product-Specific Examples
- Collaboration Tool (like Slack)
- Project Management Tool (like Asana)
- Analytics Tool (like Amplitude)
- Design Tool (like Figma)
- PQL Identification Process: Making It Operational
- Product Analytics Setup Requirements
- Event Tracking and User Properties
- Scoring Model Implementation
- Real-Time Lead Generation
- CRM Integration and Handoff
- PQL Prioritization Tiers
- Hot PQLs: Ready to Buy Now (Immediate Outreach)
- Warm PQLs: High Engagement (Nurture + Light Touch)
- Cool PQLs: Showing Interest (Automated Nurture)
- Priority Matrix: Usage + Fit Combination
- Sales Process for PQLs: Different from Traditional Leads
- When to Reach Out (Trigger Timing)
- Outreach Messaging (Personalized to Usage)
- Sales Motion (Consultative, Not Pushy)
- Conversion Approach (Remove Friction)
- Follow-Up Strategy Based on Response
- PQL Metrics and Optimization
- PQL Generation Rate (% of Free Users)
- PQL-to-Opportunity Conversion
- PQL-to-Closed-Won Rate
- Time-to-Conversion from PQL Status
- Revenue per PQL
- Iterating on PQL Definition
- Building Your PQL System: Implementation Roadmap
- Tech Stack Recommendations
- Conclusion: Product Usage as Strongest Buying Signal
- Learn More