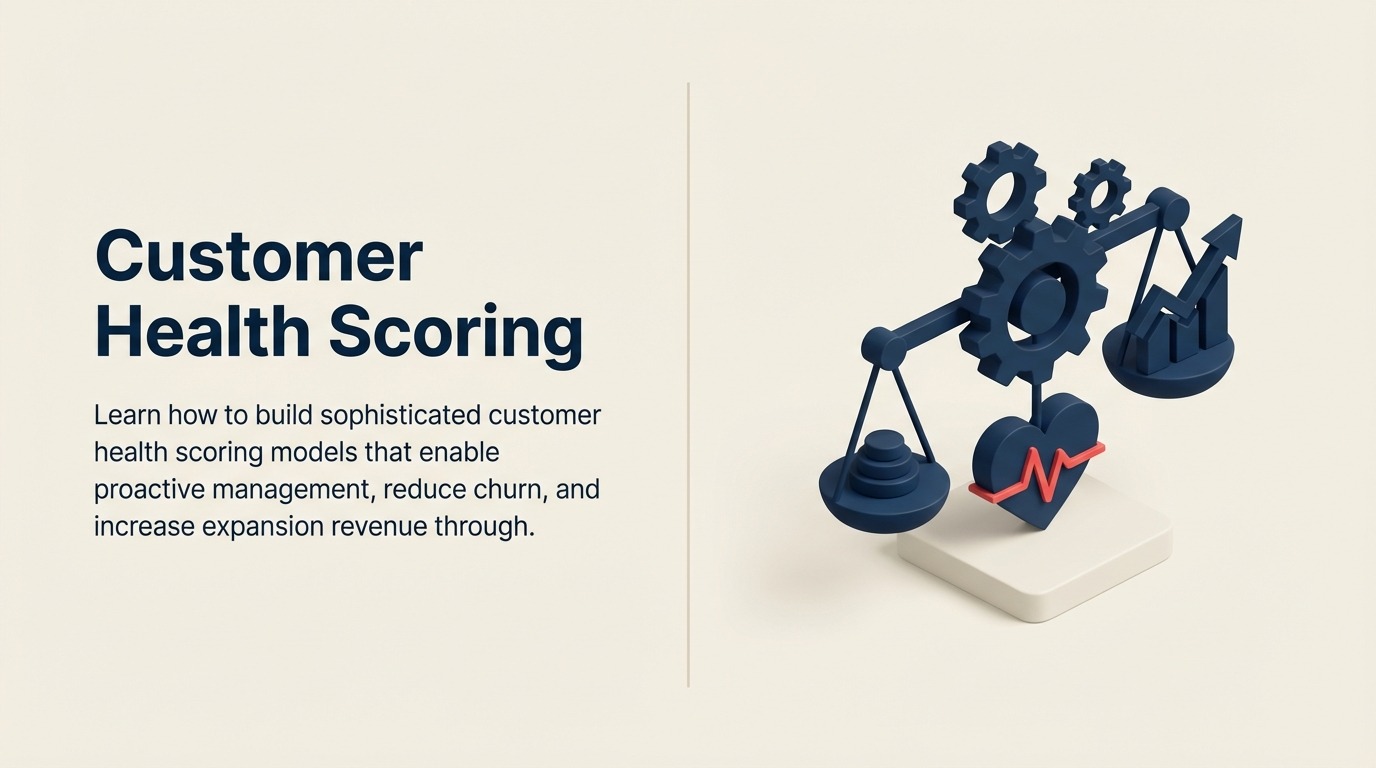
Customer Health Scoring: Predictive Framework for Retention and Expansion
Turn this article into takeaways for your work.
Each assistant summarizes the article only for you and suggests best practices for your work.
Companies with mature health scoring systems have 40-60% lower churn and 2x expansion rates compared to companies flying blind on customer health.
The reason is simple. Without systematic health scoring, customer success teams react to problems after they've escalated. Customers churn before anyone notices declining engagement. Expansion opportunities go unidentified until customers outgrow your product. Teams spend time equally across all accounts rather than focusing where impact is highest.
Health scoring transforms customer success from reactive support into proactive management. It surfaces which customers need urgent intervention, which are ready for expansion, and which are thriving independently. It enables data-driven resource allocation, early risk detection, and systematic expansion pipeline building.
But most health scoring implementations fail. They track vanity metrics that don't predict outcomes. They create complex models that nobody understands or trusts. They generate scores that don't drive action. Successful health scoring requires understanding what actually predicts customer outcomes, building models that balance accuracy with simplicity, and creating operational workflows that act on scores systematically.
Understanding Health Scoring Fundamentals
Health scores predict customer outcomes using leading indicators rather than describing current states.
Health score vs NPS vs sentiment distinguishes between different customer measurement approaches. NPS (Net Promoter Score) captures customer willingness to recommend you. Sentiment analysis measures emotional tone in customer communications. Health scoring predicts likelihood of retention and expansion.
NPS tells you how customers feel. Sentiment reveals customer mood. Health scoring predicts what customers will do. All three provide value, but health scoring drives the most actionable decisions.
Leading indicators vs lagging indicators separates predictive signals from historical outcomes. Lagging indicators (churn rate, expansion revenue) tell you what already happened. Leading indicators (usage trends, engagement patterns, support ticket volume) predict what will happen.
Health scores should primarily use leading indicators that enable intervention before negative outcomes occur.
Predictive scoring vs descriptive metrics differentiates between forecasting and reporting. Descriptive metrics summarize current or past states. Predictive scoring forecasts future outcomes based on current patterns.
A descriptive metric reports that a customer logged in 15 times last month. A predictive score uses login frequency trends, feature adoption patterns, and engagement signals to forecast that the customer has 85% likelihood of renewal and 30% probability of expansion. Effective product analytics setup is essential for capturing these behavioral signals.
The Three Dimensions of Health
Comprehensive health scoring evaluates customers across multiple dimensions that collectively predict outcomes.
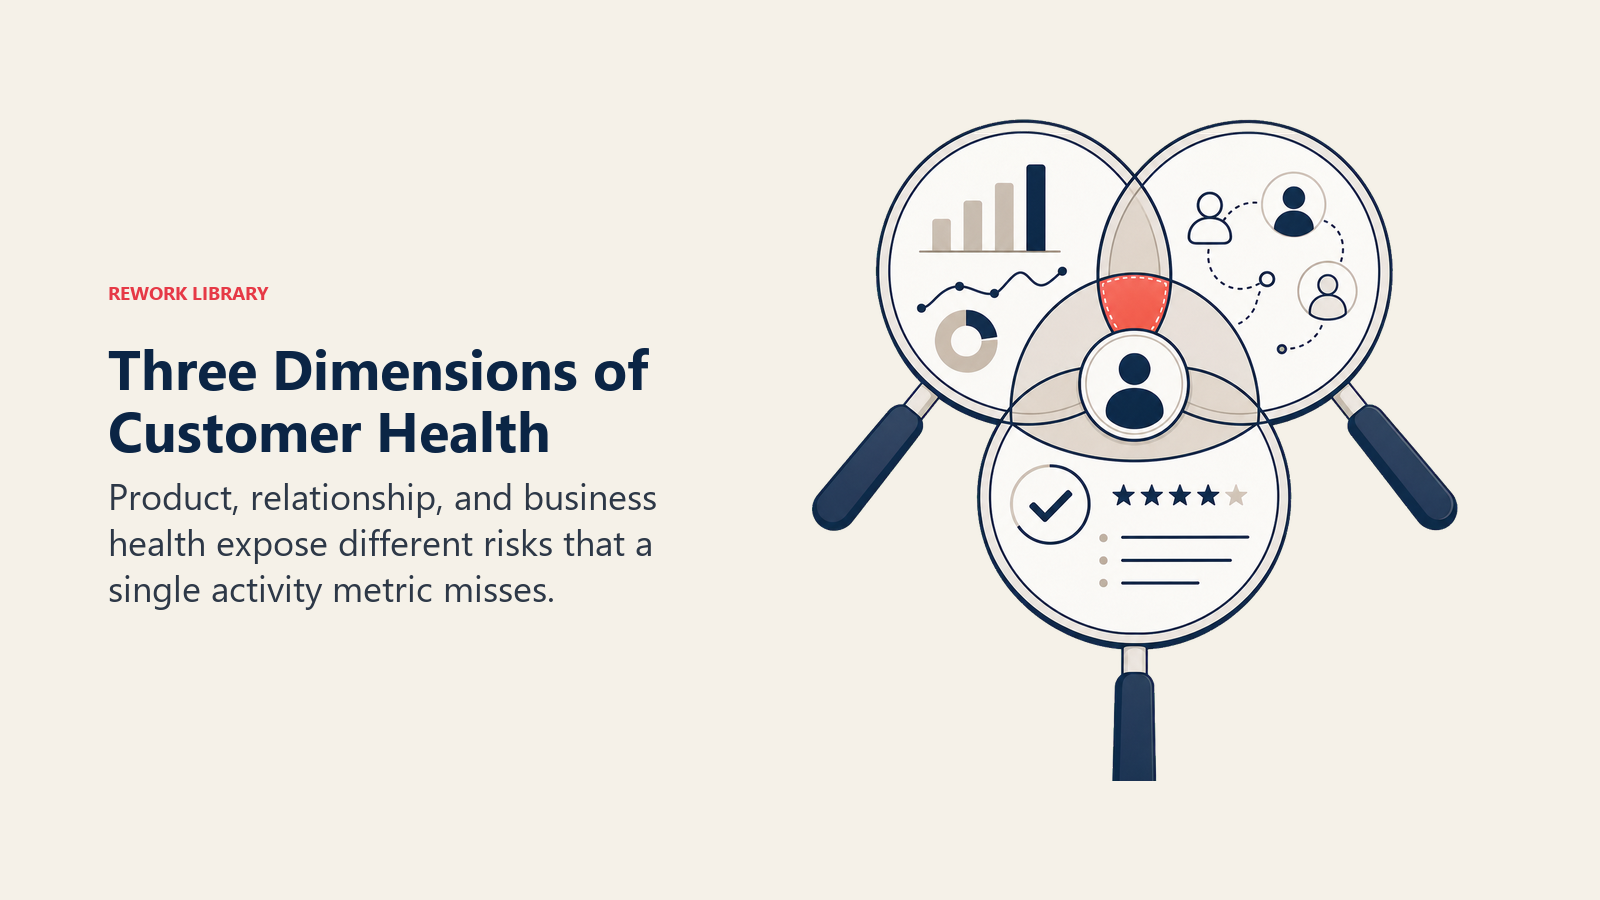
Product Health measures how well customers use your product. This dimension captures usage frequency, feature adoption, workflow integration, and value realization through product behavior.
Product health answers: Is the customer actually using what they purchased? Are they using it enough? Are they using advanced capabilities or just scratching the surface?
Relationship Health assesses the strength of your customer relationship. This dimension includes executive engagement, business review participation, communication responsiveness, and support interaction quality.
Relationship health answers: Do we have strong connections with key stakeholders? Are customers engaged in strategic conversations? Do they trust us as partners?
Business Health evaluates value delivery and business fit. This dimension tracks outcome achievement, ROI demonstration, budget ownership, contract commitment, and payment behavior.
Business health answers: Is the customer achieving their stated objectives? Does our product deliver measurable business value? Is the customer economically healthy?
Why all three matter: Customers can score high on one dimension while struggling on others. A customer might use your product heavily (high product health) but lack executive sponsorship (low relationship health). Another might love your team (high relationship health) but barely use the product (low product health).
Comprehensive scoring across all dimensions provides accurate outcome prediction. Single-dimension scoring creates blind spots.
Weighting strategies determine relative importance of each dimension. Typical weighting allocates 40% to product health, 30% to relationship health, and 30% to business health. This reflects the reality that product usage predicts retention most strongly, but relationship and business dimensions significantly influence outcomes.
Adjust weights based on your business model. High-touch enterprise sales motion companies might weight relationship health higher. Product-led growth strategy companies might emphasize product health more heavily.
Product Health Indicators
Product usage patterns reveal customer engagement and value realization.
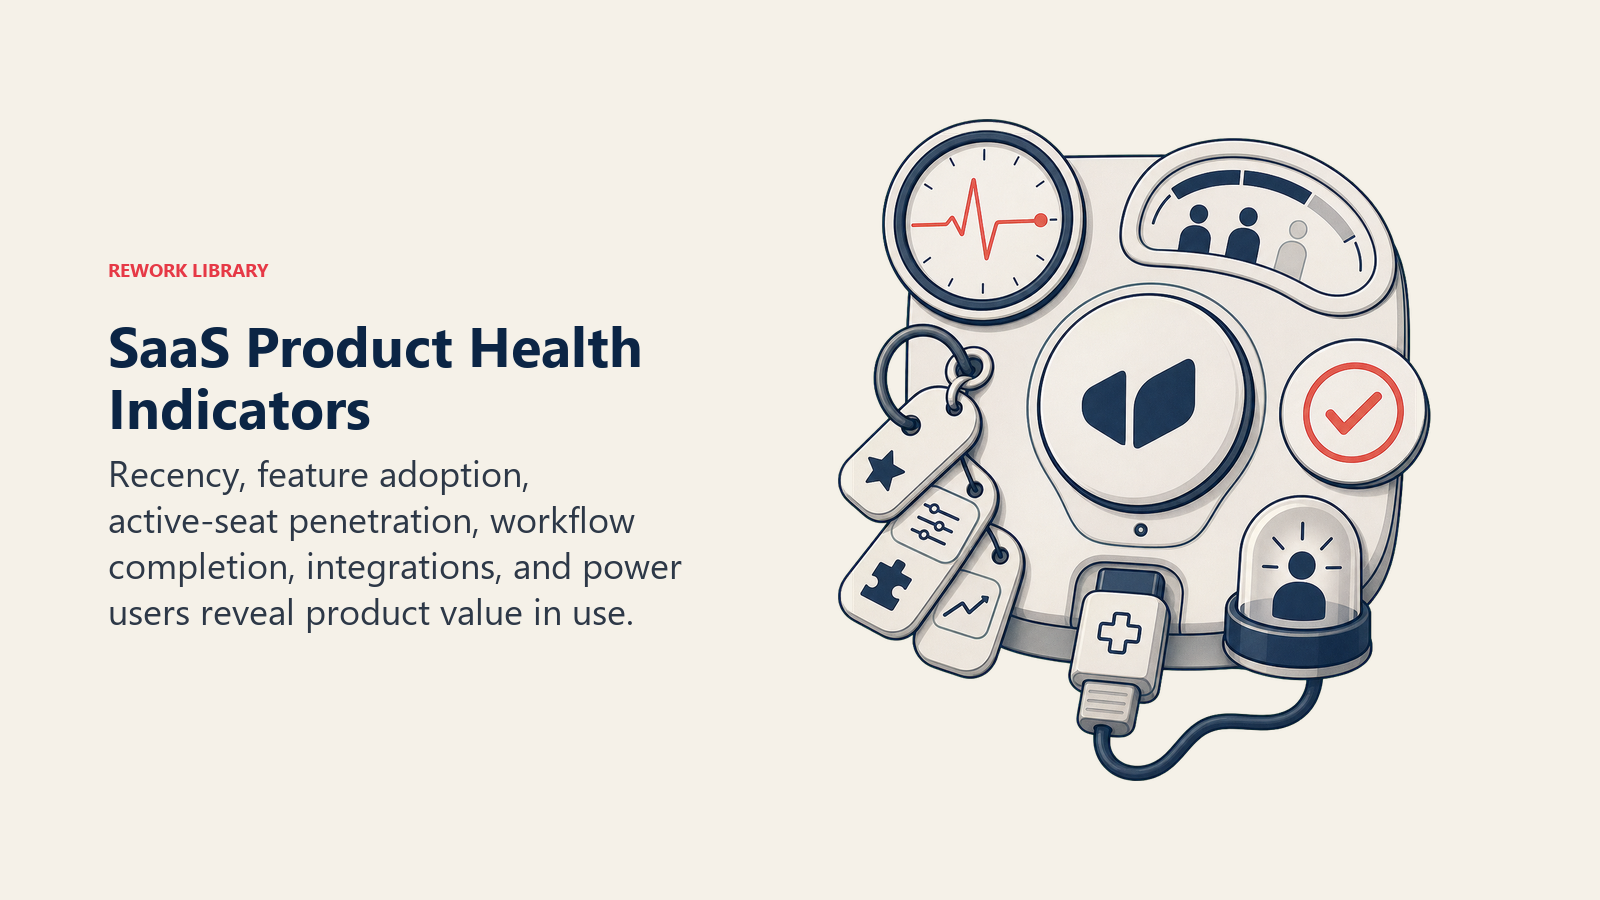
Login frequency and recency tracks how often and how recently customers access your product. Daily active users represent strong engagement. Weekly users show moderate engagement. Monthly-only users signal weak adoption.
Recency matters as much as frequency. A customer who logged in daily last month but hasn't accessed your product in 3 weeks shows declining health regardless of historical patterns.
Score login patterns on 0-100 scale: Daily logins (90-100), Weekly logins (70-89), Bi-weekly logins (50-69), Monthly logins (30-49), Inactive (0-29).
Feature adoption breadth and depth measures both how many features customers use and how deeply they use them. Breadth captures feature count. Depth captures sophisticated usage of individual features.
Customers using 3 of 20 available features have poor breadth. Customers using 15 features have strong breadth. Within features, basic usage (running default reports) represents shallow depth. Advanced usage (building custom reports with complex filters) represents strong depth.
Balanced breadth and depth (10+ features at moderate depth) typically predicts retention better than narrow but deep usage (2 features used expertly).
Active user penetration compares active users to total purchased seats. A customer paying for 20 seats with 18 active users shows 90% penetration (excellent). Another with 8 active users shows 40% penetration (poor).
High penetration indicates organizational adoption and seat expansion readiness. Low penetration suggests deployment challenges or overprovisioning.
Target thresholds: 80%+ penetration (90-100 score), 60-80% penetration (70-89), 40-60% penetration (50-69), Below 40% (0-49).
Workflow completion rates track whether customers successfully complete key processes. Project management tools measure projects completed. CRM systems track deals closed. Marketing platforms measure campaigns sent.
Incomplete workflows suggest adoption barriers or value realization challenges. Consistent workflow completion indicates customers achieve intended outcomes.
Integration usage reveals how deeply embedded your product is in customer operations. Customers using integrations to connect your product with their CRM, data warehouse, or communication tools demonstrate workflow integration.
Integration adoption strongly predicts retention. Integrated products become infrastructure that's difficult to replace.
Power user presence identifies whether customers have champions who maximize your product. Power users log in daily, use advanced features, complete workflows successfully, and often advocate for broader adoption.
Accounts with 3+ power users rarely churn. Accounts with zero power users struggle to achieve value and often cancel.
Relationship Health Indicators
Strong relationships create retention resilience and expansion opportunities.
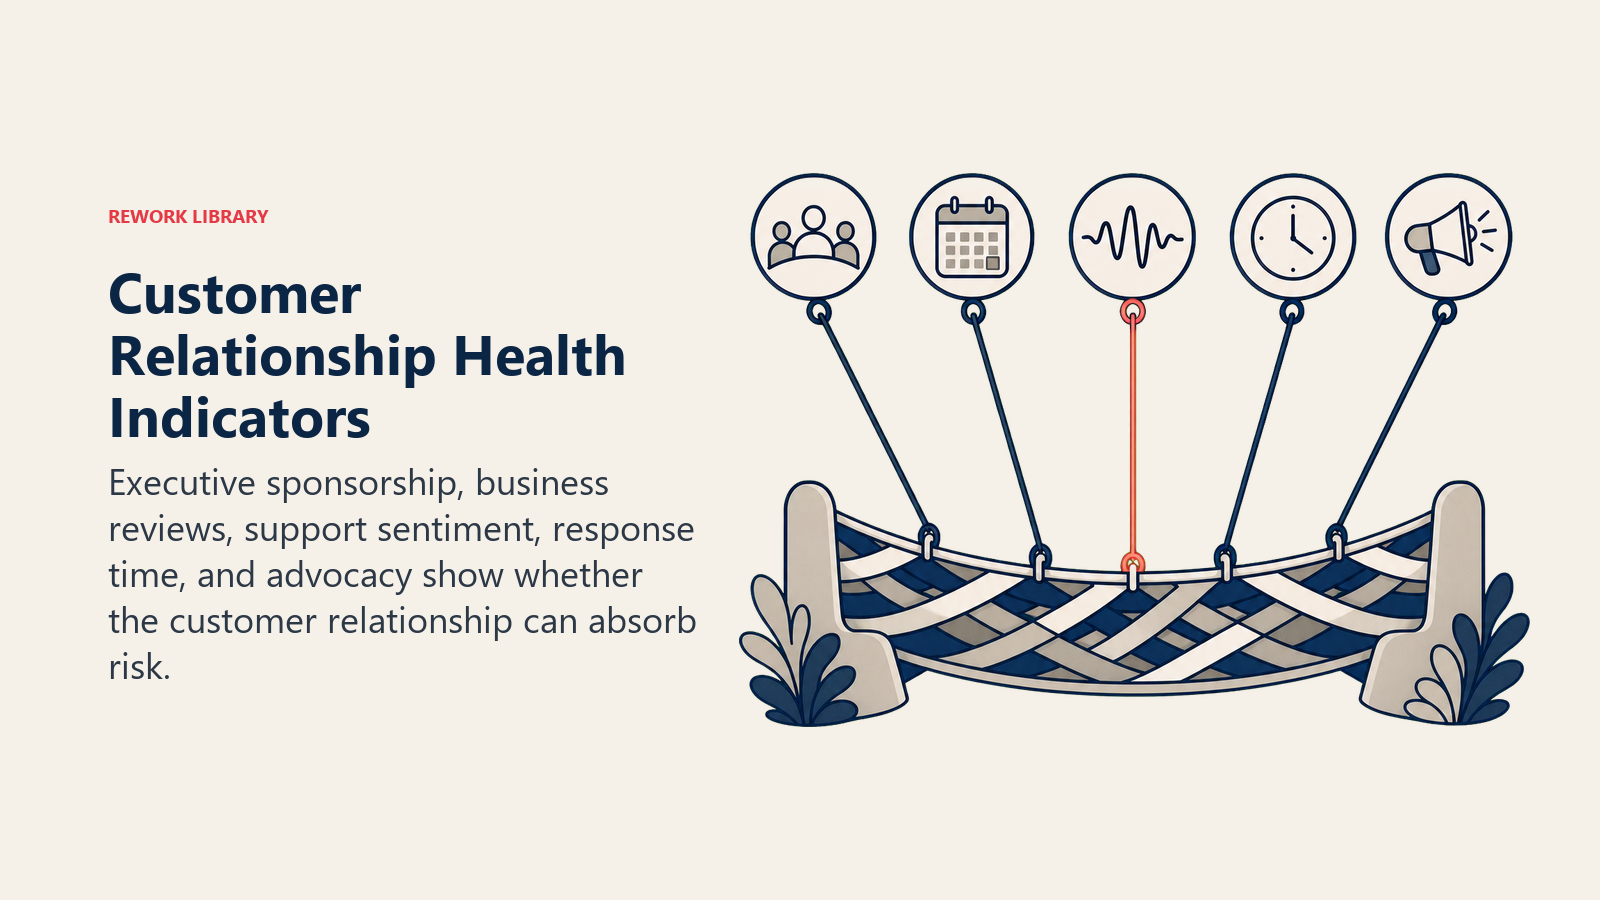
Executive sponsor engagement measures whether senior leadership at customer organizations actively supports your product. Executive sponsors attend business reviews, advocate during budget discussions, and connect you with other departments.
Accounts with active executive sponsors have 3x higher retention and 5x higher expansion rates than those without executive engagement.
Score executive engagement: Active sponsor participating quarterly (90-100), Engaged sponsor participating annually (70-89), Aware sponsor with minimal engagement (50-69), No identified sponsor (0-49).
Business review participation tracks customer attendance at scheduled strategic conversations. Quarterly business reviews (QBRs) provide opportunities to demonstrate value, align roadmaps, and identify expansion opportunities.
Customers who consistently attend QBRs show investment in the relationship. Those who cancel or no-show signal disengagement that often precedes churn.
Support ticket volume and sentiment reveals relationship quality through support interactions. Moderate ticket volume with positive sentiment indicates healthy engagement. Low volume might suggest under-utilization. High volume with negative sentiment signals frustration.
Analyze ticket sentiment using text analysis. Consistently negative language predicts churn risk even when issues get resolved.
NPS/CSAT scores provide direct customer satisfaction feedback. Net Promoter Scores of 9-10 (promoters) indicate strong satisfaction. Scores of 0-6 (detractors) signal dissatisfaction. Customer Satisfaction (CSAT) scores below 3/5 suggest relationship problems.
Response time to outreach measures customer engagement with your team. Customers who respond to emails within 24 hours demonstrate engagement. Those who take weeks or never respond signal disengagement.
Track response time trends. Customers who previously responded quickly but now ignore outreach show deteriorating relationship health.
Champion advocacy behaviors identifies customers who actively promote your product. Champions provide references, write case studies, speak at events, or recommend you to peers. This advocacy indicates exceptional relationship strength.
Business Health Indicators
Value delivery and business fit determine whether customers should and will continue purchasing.
Outcome achievement tracks whether customers accomplish their stated objectives. During onboarding & time-to-value, customers articulate goals: reduce costs by 20%, improve productivity by 15%, increase revenue by $500K. Track progress toward these specific outcomes.
Customers achieving stated outcomes renew at 95%+ rates. Those falling short churn at 40%+ rates. Outcome tracking is the single strongest predictor of retention.
ROI demonstration quantifies value delivered relative to cost through value-based pricing alignment. Calculate time saved, revenue generated, costs reduced, or efficiency gained. Compare to product cost to determine ROI multiple.
Products delivering 3x+ ROI rarely face budget challenges. Those delivering less than 1x ROI struggle at renewal regardless of product quality.
Budget ownership and growth reveals customer investment commitment. Customers with dedicated budget allocations show institutional commitment. Those fighting for budget each cycle face higher churn risk.
Growing budgets signal expansion readiness. Shrinking budgets predict downgrades or churn.
Expansion conversations indicate customer growth trajectory. Customers discussing additional users, higher tiers, or new products demonstrate expansion intent. Those avoiding expansion conversations may be stagnant or declining.
Track expansion conversation frequency and sentiment. Positive expansion discussions predict revenue expansion opportunities.
Contract term and commitment shows customer confidence. Customers signing multi-year contracts demonstrate long-term commitment. Those insisting on month-to-month maintain exit optionality.
Annual contracts reduce churn risk significantly compared to monthly contracts.
Payment behavior reveals financial health and prioritization. Customers paying invoices promptly show financial stability and vendor prioritization. Those with delayed payments might face budget constraints or deprioritize your product.
Composite Score Methodology
Combining individual indicators into actionable overall scores requires thoughtful methodology.
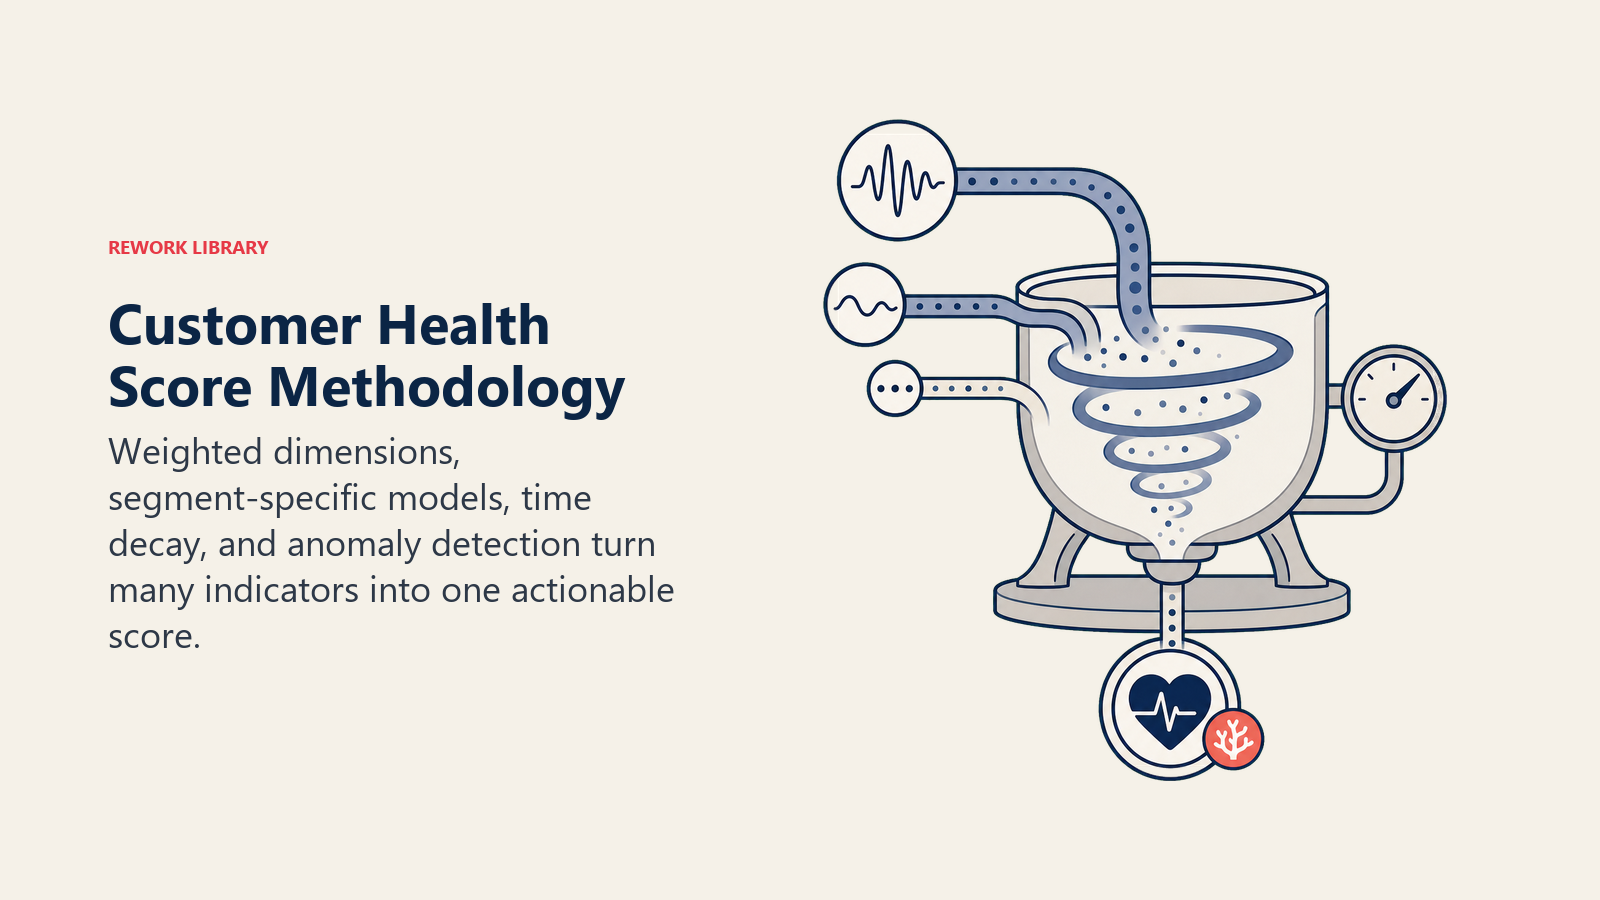
Weighting by dimension allocates importance across product (40%), relationship (30%), and business (30%) dimensions. Within each dimension, weight individual indicators based on predictive power.
High-predictive indicators (outcome achievement, active user penetration) receive more weight than lower-predictive ones (NPS scores, login frequency).
Segment-specific scoring models adjust weights for different customer types. Enterprise customers might weight relationship health higher due to complex stakeholder dynamics. SMB customers might weight product health higher since they have fewer relationship touchpoints.
Time-decay factors emphasize recent behavior over historical patterns. A customer who logged in daily for 6 months but hasn't accessed your product in 4 weeks shouldn't score high on product health. Recent inactivity matters more than historical engagement.
Apply exponential decay to historical data. Last 30 days weighs most heavily, previous 30 days weighs 50%, prior periods weigh progressively less.
Anomaly detection and alerts identify sudden health score changes that require investigation. A customer whose score drops 20 points in one month needs immediate attention even if their absolute score remains acceptable.
Rapid deterioration predicts churn better than low absolute scores. Customers declining from 85 to 65 are higher risk than customers stable at 60.
Operational Implementation
Health scoring only creates value when operationalized through systems and processes.
Data source integration combines product analytics, CRM data, billing information, and support tickets into unified health scores. Most companies need to integrate 4-6 data sources for comprehensive scoring through their SaaS tech stack.
Product analytics (Amplitude, Mixpanel) provide usage data. CRM systems (Salesforce, HubSpot) capture relationship information. Billing platforms (Stripe, Zuora) reveal payment behavior. Support systems (Zendesk, Intercom) supply ticket data.
Real-time vs batch calculation determines score freshness. Real-time scoring updates continuously as new data arrives. Batch scoring recalculates periodically (daily, weekly).
Real-time works for high-touch segments where immediate intervention matters. Batch works for larger customer bases where daily updates provide sufficient timeliness.
Score refresh frequency balances accuracy with stability. Refreshing scores too frequently creates noise. Refreshing too infrequently misses important changes.
Daily refreshes work well for most companies. Weekly refreshes suffice for enterprise-only portfolios with stable usage patterns.
Alert thresholds and escalation define when scores trigger action. Set thresholds for different urgency levels:
Critical (0-40): Immediate escalation to management At-risk (40-60): CSM intervention within 48 hours Warning (60-75): Proactive outreach within 1 week Healthy (75-100): Standard engagement cadence
Dashboard visualization makes scores accessible and actionable through SaaS metrics dashboards. Effective dashboards show:
Account lists sorted by health score Score trends over time Dimension breakdowns revealing score drivers Drill-down into individual indicators Action queues for at-risk accounts
Action Framework by Health Band
Scores only matter if they drive differentiated actions.
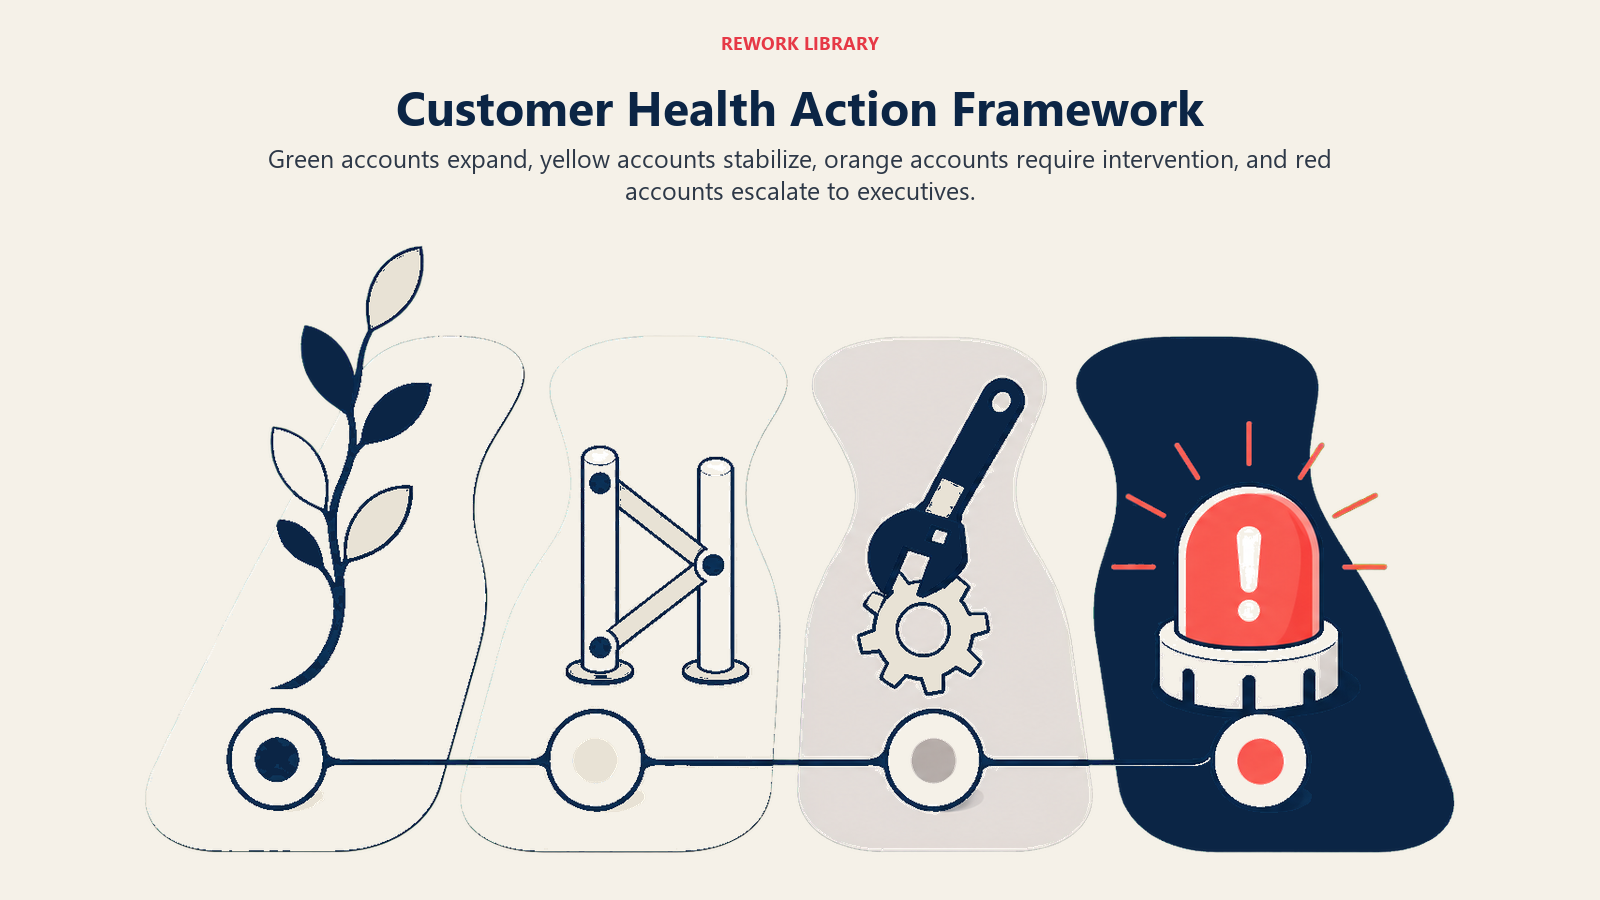
Green (80-100): Expansion focus concentrates on growth opportunities. These customers are thriving. Allocate resources to upsell and cross-sell motions, seat expansion, and reference development.
Playbook: Monthly check-ins, quarterly business reviews, expansion opportunity identification, case study development.
Yellow (60-79): Stabilization focus works to improve health before it deteriorates. These customers are functional but have improvement opportunities. Focus on adoption optimization, outcome reinforcement, and relationship strengthening.
Playbook: Bi-weekly check-ins, adoption optimization sessions, executive sponsor development, integration enablement.
Orange (40-59): Intervention required addresses significant health challenges. These customers face churn risk without active intervention. Execute churn risk detection and intervention playbooks.
Playbook: Weekly touchpoints, executive alignment, business value reviews, product optimization, pricing flexibility discussions.
Red (0-39): Executive escalation mobilizes senior resources for critical accounts. These customers will likely churn without extraordinary intervention. Engage executives, offer premium support, consider pricing adjustments.
Playbook: Immediate management escalation, executive sponsor engagement, comprehensive account assessment, win-back offers.
Continuous Improvement
Health scoring models improve through systematic validation and refinement.
Backtesting score accuracy validates whether scores actually predicted outcomes. For churned customers, review what their health scores were 30, 60, 90 days before cancellation. Strong models show declining scores before churn.
If customers with green health scores churn frequently, your model isn't working. Investigate which indicators failed to predict churn.
Model refinement based on outcomes adjusts weights and indicators using actual results. If integration usage strongly predicts retention but receives low weighting, increase its importance. If NPS scores don't correlate with churn, reduce their weight or remove them. This iterative approach aligns with net revenue retention optimization goals.
Indicator addition/removal evolves models as you discover new predictive signals. Add indicators that improve prediction accuracy. Remove indicators that don't correlate with outcomes or that teams find confusing.
Weighting optimization uses regression analysis to determine mathematically optimal weights. While intuitive weighting provides starting points, data-driven optimization improves accuracy.
False positive/negative reduction minimizes scoring errors that misdirect resources. False positives (high scores for customers who churn) waste expansion resources. False negatives (low scores for healthy customers) waste intervention resources.
Track false positive and false negative rates. Optimize models to minimize both while accepting that perfect prediction is impossible.
The companies excelling at customer health scoring treat it as foundational infrastructure for proactive customer success and churn reduction. They've moved beyond manual account reviews and reactive firefighting to systematic, data-driven customer management.
Build the scoring model. Operationalize the insights. Let data guide resource allocation. Transform customer success from reactive support into proactive management that prevents churn and drives expansion systematically.
Customer Health Scoring Questions
What is customer health scoring in B2B SaaS?
Customer health scoring is a predictive system that combines product usage, relationship strength, and business outcomes into a single score that forecasts a customer's likelihood of renewal, churn, or expansion. It lets B2B SaaS teams intervene before problems escalate instead of reacting after a customer cancels.
Why does health scoring matter for SaaS growth?
Companies with mature health scoring systems report 40-60% lower churn and roughly 2x expansion rates versus companies without one. Because retention and expansion drive most SaaS growth, a working health score directs success resources to the accounts where they move revenue most.
What are the three dimensions of customer health?
Product health (usage frequency, feature adoption, active user penetration), relationship health (executive engagement, business reviews, support sentiment), and business health (outcome achievement, ROI, contract commitment). A typical model weights product 40%, relationship 30%, and business 30%.
How often should health scores refresh?
Daily refreshes work for most B2B SaaS portfolios, with weekly refreshes sufficient for stable enterprise-only books. Apply time-decay so recent behavior outweighs historical patterns, since a sudden drop predicts churn better than a low but stable absolute score.
What is the most predictive health indicator?
Outcome achievement, whether the customer is hitting the goals they set during onboarding, is the single strongest retention predictor. Customers reaching their stated outcomes renew at 95%+, while those falling short churn at 40%+ regardless of how often they log in.
Related Resources
Deepen your customer success and retention expertise with these complementary frameworks:
- Usage Monitoring & Alerts - Build real-time monitoring systems that detect engagement changes before they impact health scores
- Trial-to-Paid Conversion - Apply health scoring principles early in the customer lifecycle to improve conversion rates
- SaaS RevOps Framework - Integrate health scoring into broader revenue operations for cross-functional alignment
- Cancellation Flow Optimization - Use health score insights to design targeted retention offers during cancellation attempts

Senior Operations & Growth Strategist