Weighted Lead Distribution: Performance-Based Lead Allocation
Turn this article into takeaways for your work.
Each assistant summarizes the article only for you and suggests best practices for your work.
A sales team distributes leads equally: everyone gets 50 leads per month. Rep A converts at 40% (20 opportunities). Rep B converts at 10% (5 opportunities). The team generates 25 total opportunities from 100 combined leads.
Now imagine redirecting Rep B's leads to Rep A. Rep A receives 100 leads and converts at 40% (40 opportunities). The team generates 40 opportunities from the same 100 leads, a 60% increase with zero additional marketing spend.
This is the power of weighted distribution: allocating opportunities proportional to conversion probability maximizes total revenue.
Equal distribution feels fair, but it's not always the best choice. Weighted distribution accepts inequality to drive results. Understanding lead distribution strategy fundamentals helps you choose the right approach for your team.
Key Facts: Performance Distribution and Lead Allocation
- In a typical sales team, roughly 20% of salespeople generate approximately 80% of revenue, the classic Pareto distribution that makes equal lead allocation mathematically suboptimal (Pareto Principle, widely documented in sales research; see also Inc./Nick Hedges analysis).
- Companies that implement lead scoring, the data layer that drives weighted allocation, see up to 20% more conversions, according to McKinsey research cited by multiple sales analytics sources.
- A well-implemented lead scoring system helping direct leads to appropriate reps increases sales productivity by up to 20% by eliminating time spent on unqualified prospects (Forrester Research).
- Implementing detailed lead scoring in one documented case boosted conversion rates from 7.2% to 12.8% in 90 days and led to a 43% increase in sales-accepted leads (Landbase, 2025 lead scoring statistics).
- Businesses adopting CRM systems, the foundation for enforcing weighted distribution rules, report up to a 29% increase in sales and a 34% boost in sales productivity (CRM adoption research, EmailAnalytics compilation).
What is Weighted Distribution?
Weighted lead distribution assigns leads to reps based on predefined ratios rather than strict equality. High-performing reps receive more leads than average or underperforming reps.
The concept: Instead of round-robin assignment's 1:1:1:1 ratio, weighted distribution uses ratios like 3:2:2:1, where the first rep receives 3x the leads of the last.
Mathematical representation:
Round-robin: Each rep gets 1/(number of reps) of total volume
Weighted: Each rep gets weight/(sum of all weights) of total volume

Example with 100 leads and 4 reps:
Round-robin: 25 leads each (100/4)
Weighted [3,2,2,1]:
  Rep A: 37.5 leads (3/8 × 100)
  Rep B: 25 leads (2/8 × 100)
  Rep C: 25 leads (2/8 × 100)
  Rep D: 12.5 leads (1/8 × 100)
Key distinction: Weighted distribution maintains systematic assignment (no cherry-picking) while optimizing for business outcomes rather than equality.
When to Use Weighted Distribution
Weighted distribution is useful when equal assignment would ignore differences in rep capacity, skill, or strategic priority.
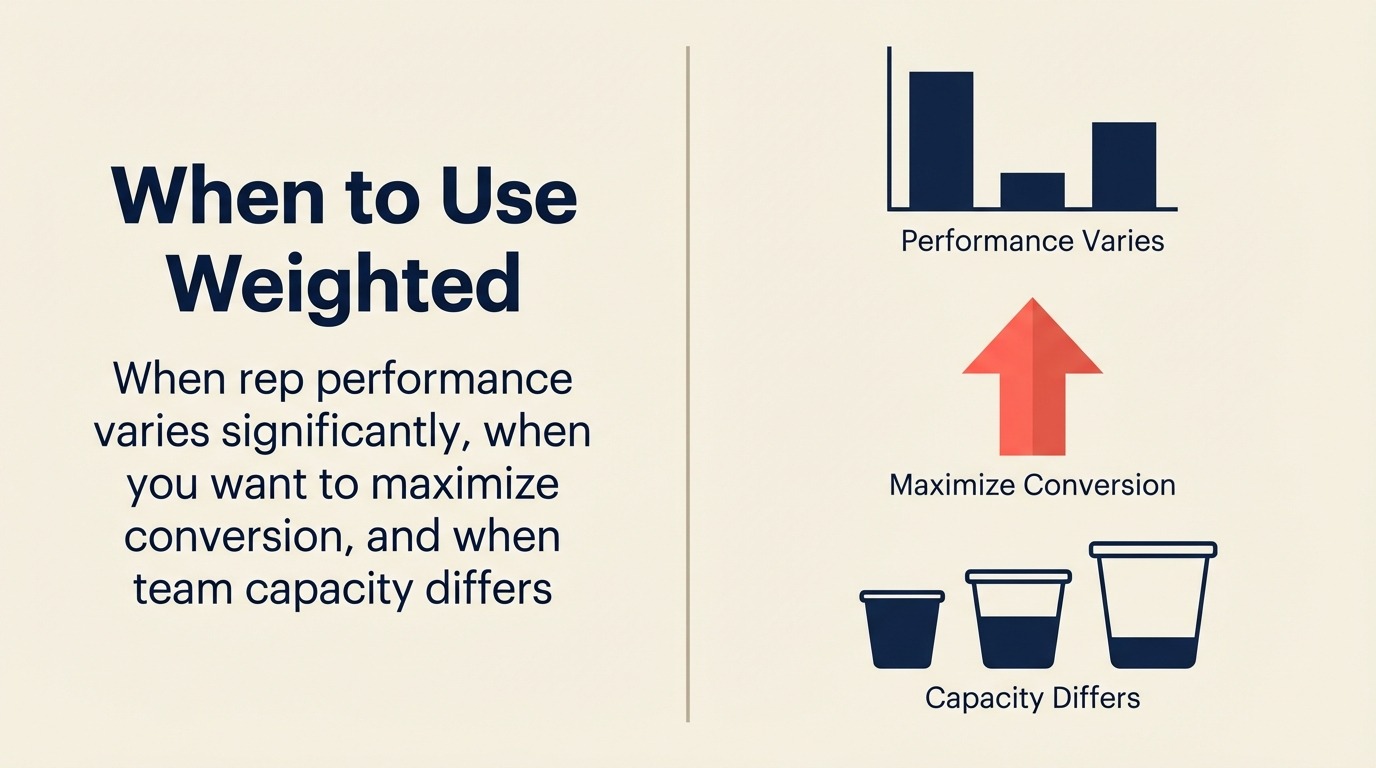
Weighted distribution makes sense in specific contexts:
Clear Performance Differentiation Exists
When: Rep conversion rates vary significantly (2x or more between top and bottom performers)
Why: Performance gaps justify unequal allocation
Example: Top rep converts at 35%, bottom rep at 12%. Directing more volume to top rep increases overall lead-to-opportunity conversion and pipeline.
Alternative: If conversion rates are similar (±5%), stick with round-robin, weighting adds complexity without benefit.
Optimizing for Revenue over Equality
When: Company prioritizes maximizing total pipeline/revenue over individual fairness
Why: Weighted distribution produces more opportunities from same lead volume
Example: Growth-stage startup prioritizing ARR targets over team morale
Alternative: If culture values equality and team cohesion, round-robin may better serve long-term retention.
Performance Measurement is Reliable
When: Accurate conversion rate analysis exists and performance differences reflect skill, not luck
Why: Weighting based on unreliable data creates perceived unfairness without actual optimization
Example: CRM tracks full lead lifecycle stages; conversion rates measured over 100+ leads per rep
Alternative: If tracking is incomplete or sample sizes small, wait until data is reliable before implementing weighting.
Capacity Differences are Real
When: Reps have different availability (full-time vs part-time, quota vs non-quota, variable territories)
Why: Capacity-based weighting prevents overload and matches allocation to bandwidth
Example: Full-time rep (40 hrs/week) receives 2x the leads of part-time rep (20 hrs/week)
Alternative: If everyone works full-time with similar capacity, capacity-based weighting isn't needed.
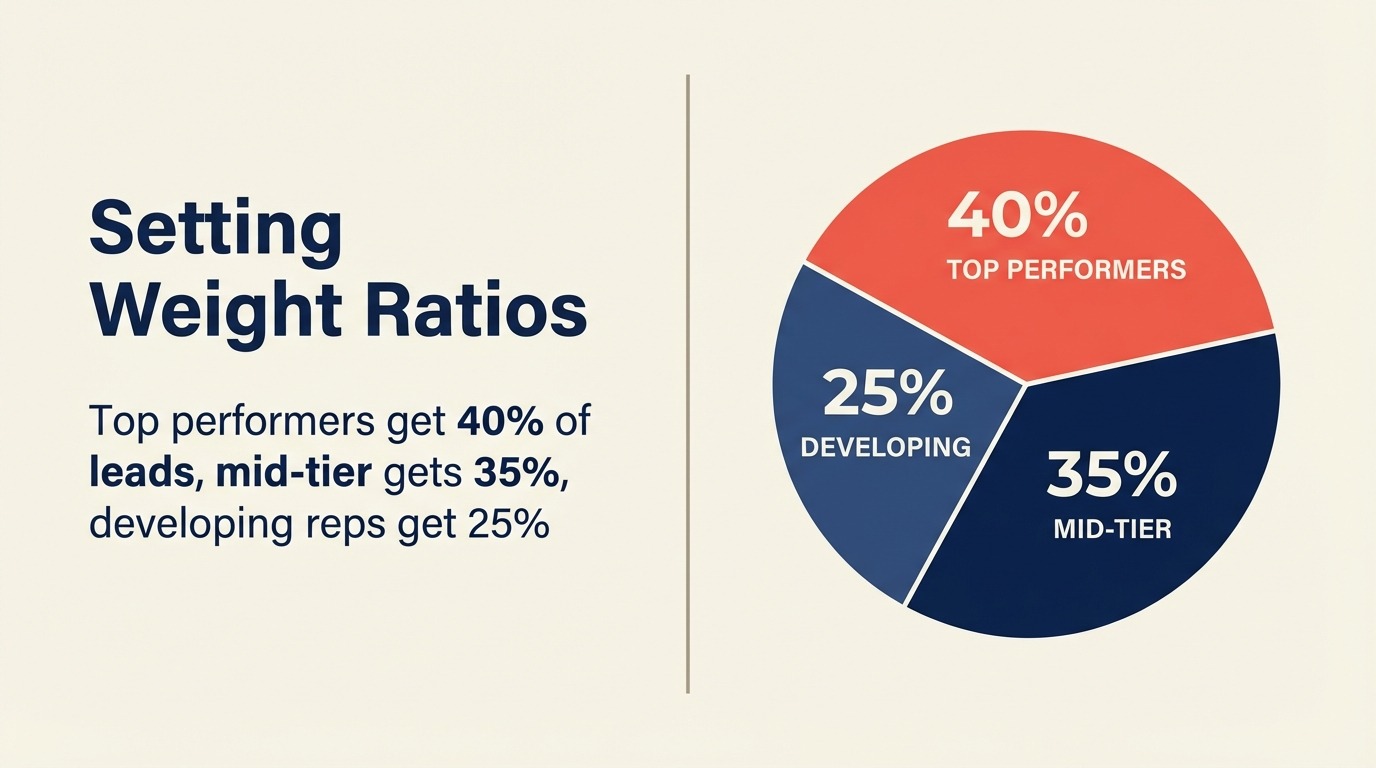
How to Set Weighting Ratios
Weighting ratios should be based on capacity, performance, territory need, and the quality mix of available leads.
Four approaches to determining rep weights:
1. Simple Ratio Weighting
Method: Assign predetermined ratios based on tier or level.
Example tiers:
- Tier 1 (Senior/Top Performers): Weight = 3
- Tier 2 (Standard/Mid Performers): Weight = 2
- Tier 3 (Junior/New Hires): Weight = 1
Example distribution (100 leads):
- 2 Tier 1 reps: 3 weight each = 6 total
- 3 Tier 2 reps: 2 weight each = 6 total
- 2 Tier 3 reps: 1 weight each = 2 total
- Total weight: 14
- Tier 1 reps get: (3/14) × 100 = 21.4 leads each
- Tier 2 reps get: (2/14) × 100 = 14.3 leads each
- Tier 3 reps get: (1/14) × 100 = 7.1 leads each
Pros: Simple, easy to explain, and stable over time
Cons: Doesn't reflect actual performance differences, and tiers can feel arbitrary
2. Performance Metric Weighting
Method: Weight based on actual conversion rates or quota attainment.
Formula:
Weight = Rep's conversion rate / Average conversion rate

Example:
- Rep A converts at 40%, team average is 25%
  Weight = 40/25 = 1.6
- Rep B converts at 25%, team average is 25%
  Weight = 25/25 = 1.0
- Rep C converts at 15%, team average is 25%
  Weight = 15/25 = 0.6
Pros: Directly tied to business outcomes, objective, and data-driven
Cons: Can be demotivating for underperformers and requires reliable tracking
Variation: Capped weights
Weight = MIN(Rep's conversion rate / Average, 2.0)
Prevents extreme ratios (no rep gets more than 2x average).
3. Capacity-Based Weighting
Method: Weight based on available hours, FTE percentage, or current pipeline load.
Example: FTE weighting
- Full-time rep (1.0 FTE): Weight = 2
- Part-time rep (0.5 FTE): Weight = 1
Example: Pipeline load weighting
- Rep with 20 active opportunities: Weight = 1.0
- Rep with 40 active opportunities: Weight = 0.5 (half capacity available)
- Rep with 10 active opportunities: Weight = 1.5 (extra capacity)
Pros: Prevents overload, respects availability, and adapts to real-time capacity
Cons: Requires integration with calendar and pipeline data, plus dynamic calculation can get complex
4. Composite Weighting
Method: Combine multiple factors into a single weight.
Formula:
Weight = (Performance Factor × 0.5) + (Capacity Factor × 0.3) + (Experience Factor × 0.2)

Example for Rep A:
- Performance: 40% conversion vs 25% avg = 1.6
- Capacity: 30 active opps vs 40 avg = 1.33
- Experience: 3 years vs 2 avg = 1.5
- Composite Weight = (1.6 × 0.5) + (1.33 × 0.3) + (1.5 × 0.2)
                   = 0.8 + 0.4 + 0.3 = 1.5
Pros: Holistic, considers multiple dimensions, and highly optimized
Cons: Complex to calculate and explain, and requires extensive data
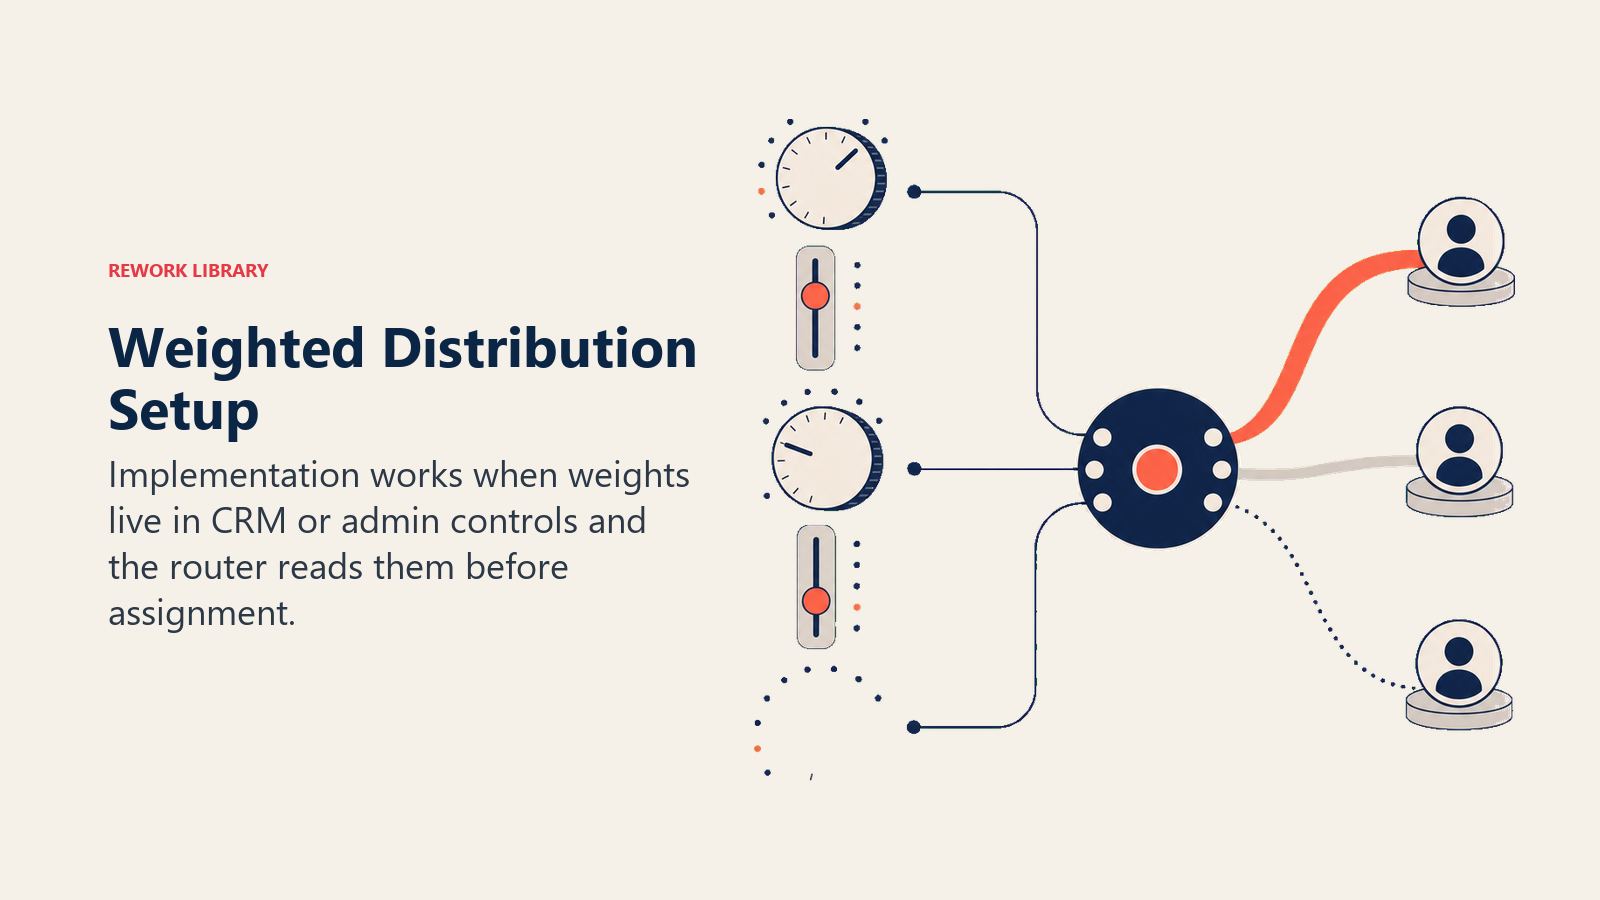
Implementation Mechanics
Setting Weight Values in Router Service
Configuration approach:
Option 1: Static configuration file
{
  "rotation": [
    {"rep": "alice@company.com", "weight": 3},
    {"rep": "bob@company.com", "weight": 2},
    {"rep": "carlos@company.com", "weight": 2},
    {"rep": "diana@company.com", "weight": 1}
  ]
}
Option 2: CRM custom field
- Create custom field on User object: "Lead Distribution Weight" (number)
- Router queries field value at runtime
- Sales ops updates field values without code deployment
Option 3: Admin UI
- Router Service provides admin interface
- Sales ops sets weights per rep via web form
- Changes effective immediately
Best practice: CRM custom field or admin UI (enables non-technical updates). Pair with lead routing automation for seamless execution.
Dynamic Weight Adjustment
Automated recalculation: Update weights periodically based on performance.
Example logic:
Every month:
1. Query CRM for each rep's lead-to-opportunity conversion rate
2. Calculate team average conversion rate
3. Set weight = Rep rate / Team average
4. Cap weights between 0.5 and 2.0
5. Update CRM custom field
6. Router uses new weights starting next month
Cadence options:
- Monthly: Standard for most teams
- Quarterly: For smaller teams or less frequent data
- Real-time: Advanced; recalculates after every N leads
Bulk Import for Team Weights
Scenario: Sales ops manages 50 reps, needs to update all weights.
Process:
- Export rep list from CRM (name, email, current weight)
- Update weights in spreadsheet
- Import back into CRM (bulk update custom field)
- Router picks up new weights immediately
Weight Calculation Formulas
Linear scaling:
Weight = (Rep Metric / Team Average)
Simple but can create extreme ratios.
Square root scaling (dampened):
Weight = SQRT(Rep Metric / Team Average)
Reduces extremes: 4x performance → 2x weight.
Percentile-based:
Weight = Percentile rank / 50
Top 10% → Weight = 2.0, Median → Weight = 1.0, Bottom 10% → Weight = 0.2.
Bounded scaling:
Weight = MIN(MAX(Rep Metric / Team Average, 0.5), 2.0)
Prevents weights below 0.5x or above 2.0x (no more than 4x spread).
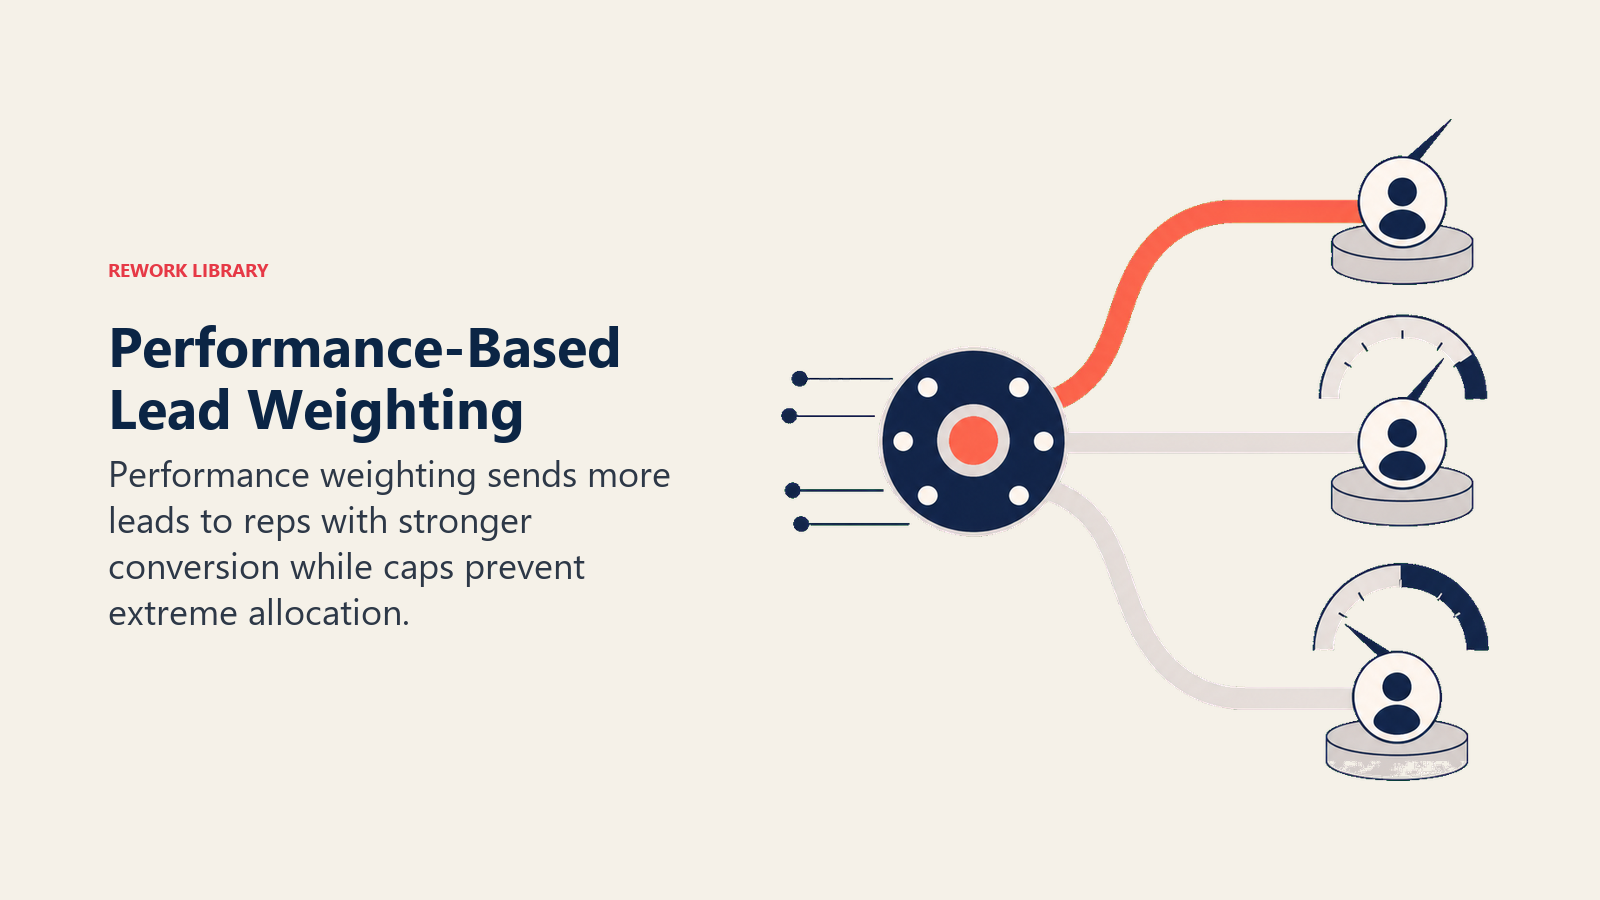
Performance-Based Weighting Explained
Most common weighting approach: allocate based on conversion ability.
Metrics to Use
Lead-to-opportunity conversion rate:
- Most direct: measures opportunity qualification effectiveness
- Example: Rep converts 30% of leads to qualified opps
Opportunity-to-close win rate:
- Measures closing effectiveness
- Example: Rep closes 40% of opps
Blended: Lead-to-close rate:
- End-to-end effectiveness
- Example: Rep closes 12% of leads (30% × 40%)
Quota attainment:
- Business outcome focus
- Example: Rep at 120% of quota
Recommendation: Use lead-to-opportunity rate if optimizing for pipeline generation strategy. Use quota attainment if optimizing for revenue.
Weighting Algorithms and Formulas
Proportional weighting:
Weight = Rep's conversion rate / Lowest conversion rate

Example:
- Top rep: 40% conversion → 40/10 = 4.0
- Mid rep: 25% conversion → 25/10 = 2.5
- Bottom rep: 10% conversion → 10/10 = 1.0
Result: Top rep gets 4x the leads of bottom rep.
Normalized weighting:
Weight = Rep's conversion rate / Average conversion rate

Example (team average 25%):
- Top rep: 40% → 40/25 = 1.6
- Mid rep: 25% → 25/25 = 1.0
- Bottom rep: 10% → 10/25 = 0.4
Result: Top rep gets 1.6x average, bottom gets 0.4x average.
Tiered weighting (simplified):
If conversion rate > 30%: Weight = 3
If conversion rate 20-30%: Weight = 2
If conversion rate < 20%: Weight = 1
Result: Simple tiers avoid fractional weights.
Adjustment Frequency
Monthly recalculation:
- Pros: Responsive to recent performance trends
- Cons: Can be volatile, reps may game system
Quarterly recalculation:
- Pros: More stable, reduces gaming
- Cons: Slower to reflect performance changes
Rolling window (90 days):
- Pros: Smooths short-term variance, stays current
- Cons: Requires more complex calculation
Best practice: Quarterly with rolling 90-day window for calculation (stable yet responsive).
Capacity-Based Weighting Explained
Allocate based on available bandwidth, not just skill.
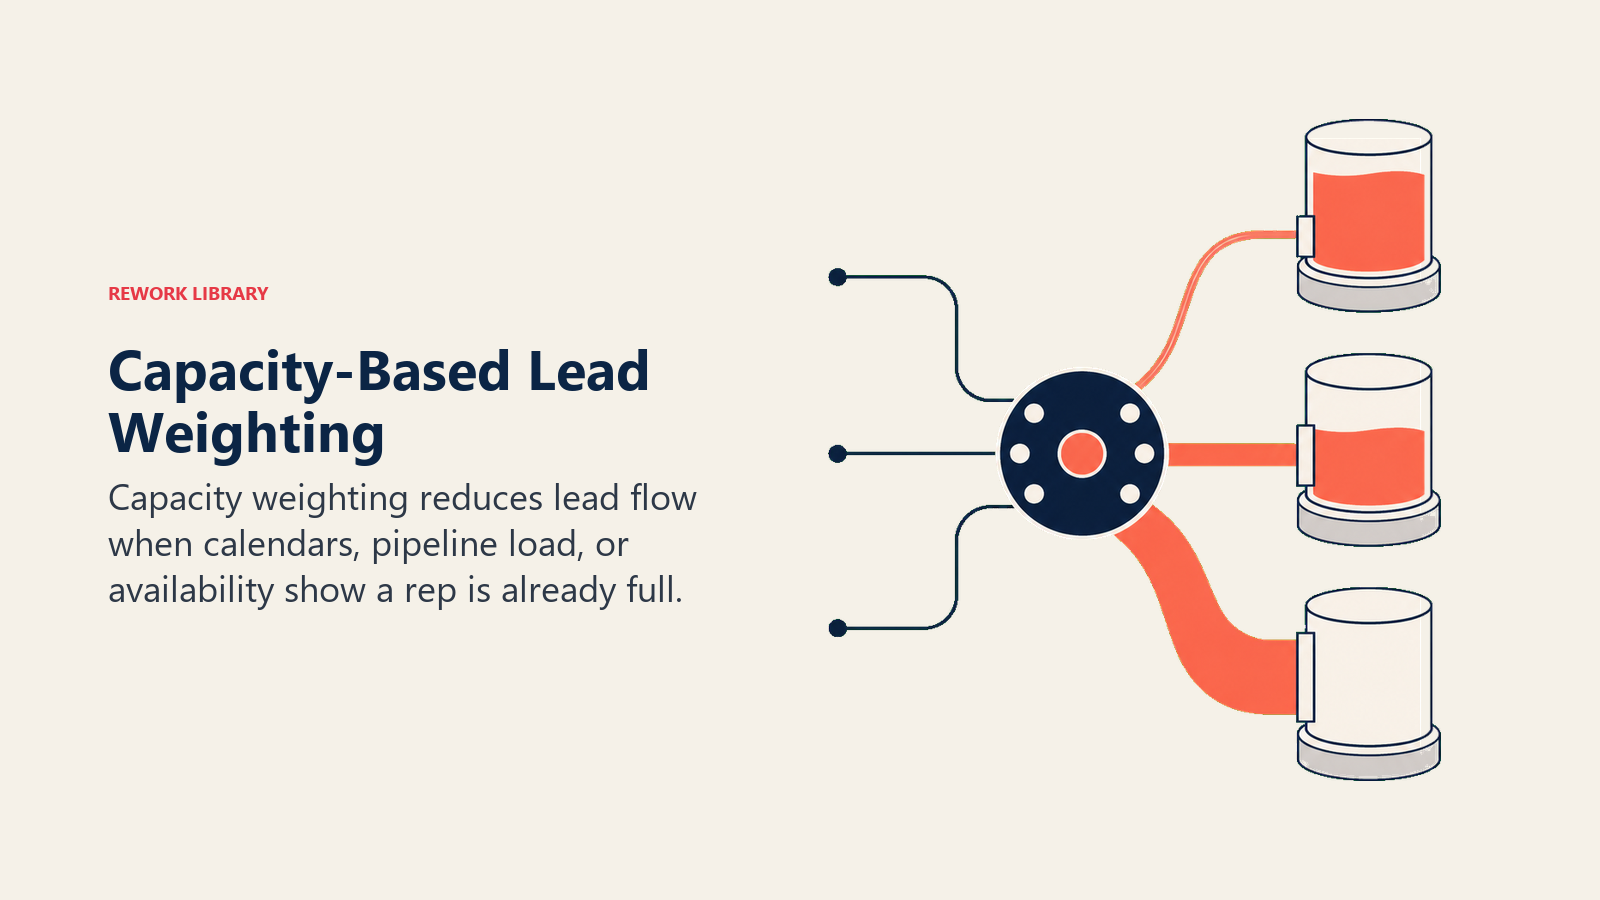
Current Pipeline Load Consideration
Logic: Reps with fuller pipelines get fewer new leads. This integrates with pipeline coverage analysis to balance workload.
Formula:
Weight = 1 - (Rep's active opps / Capacity threshold)

Example (capacity = 50 opps):
- Rep with 20 opps: Weight = 1 - (20/50) = 0.6 (60% capacity)
- Rep with 50 opps: Weight = 1 - (50/50) = 0 (at capacity, no new leads)
- Rep with 10 opps: Weight = 1 - (10/50) = 0.8 (80% capacity available)
Pros: Prevents overload and naturally balances workload
Cons: Penalizes reps for having a healthy pipeline and can create perverse incentives to close deals slowly
Mitigation: Set floor weight (e.g. min 0.3) so top performers still get some flow.
Available Hours / FTE Weighting
Logic: Part-time reps get proportionally fewer leads.
Example:
- Full-time (40 hrs/week): Weight = 1.0
- Part-time (20 hrs/week): Weight = 0.5
- Overloaded with admin (30 hrs selling/week): Weight = 0.75
Vacation and Availability Handling
Dynamic weighting:
- Rep on PTO: Weight = 0 (receives no leads during PTO)
- Rep back from PTO: Weight temporarily increased to catch up
Implementation:
- Integrate with calendar (Google Calendar, Outlook)
- Check rep availability at assignment time
- If unavailable, set weight = 0 for that assignment cycle
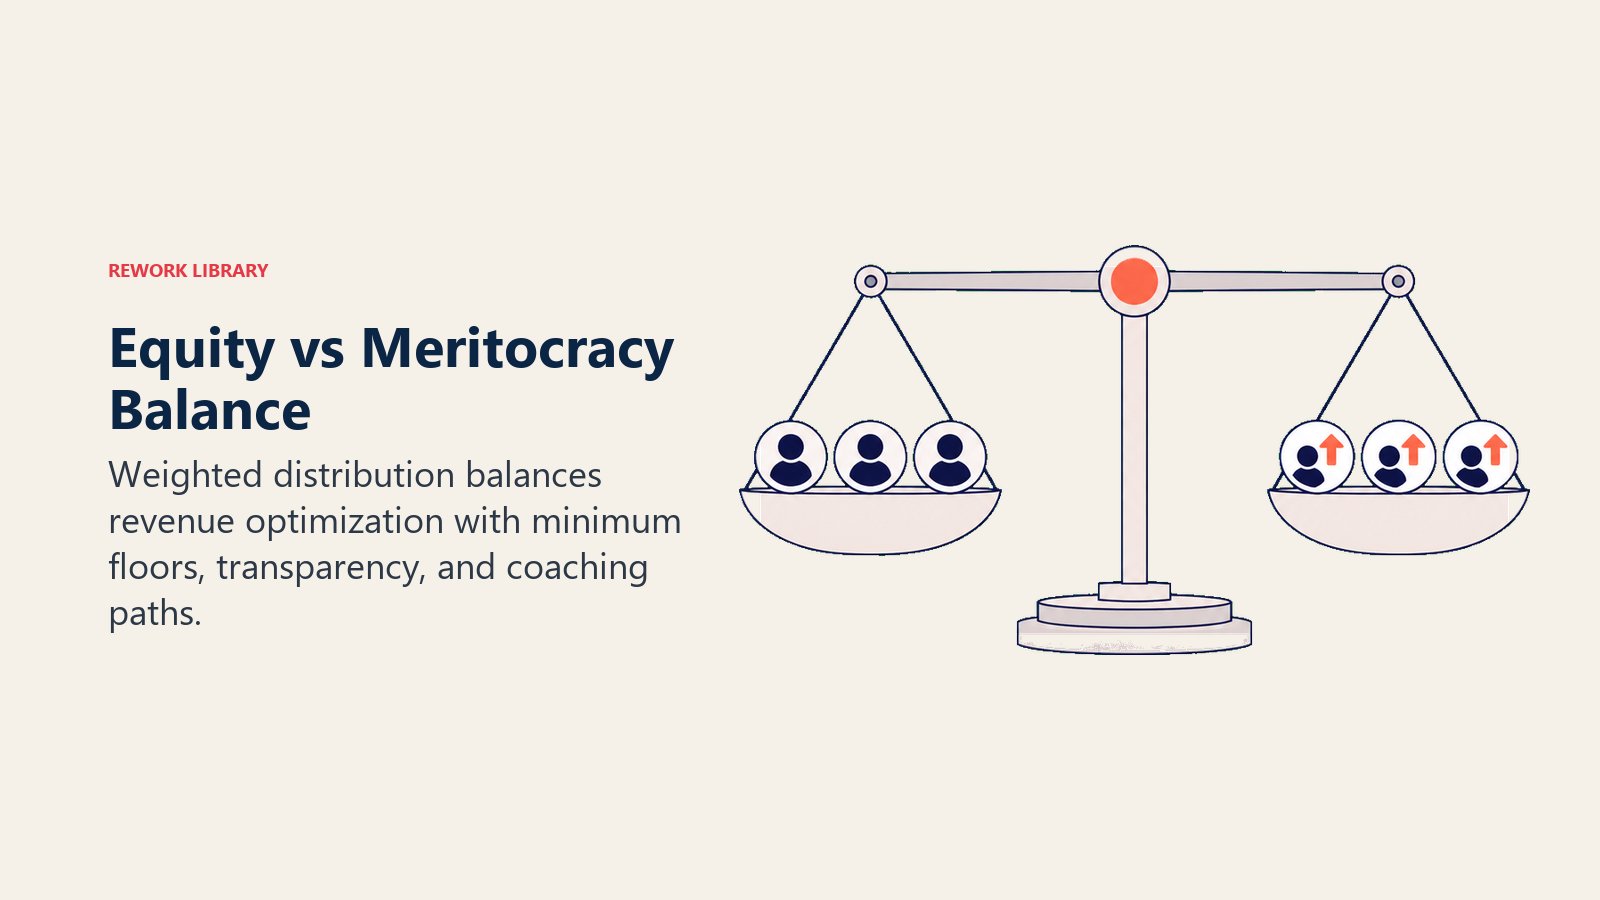
The Equity vs Meritocracy Balance
Weighted distribution creates tension between fairness and performance optimization.
When Equal Distribution Makes Sense
New team: Everyone is learning; no proven track record yet. Start with round-robin assignment to build baseline performance data.
Similar performance: Conversion rates within 10% of each other. Weighting adds complexity without benefit.
High rep turnover: Frequent changes make weight management burdensome.
Culture of equality: Team values fairness over optimization; weighting creates resentment.
Avoiding Demotivation of Lower Performers
Risks of heavy weighting:
- Underperformers receive so few leads they can't improve
- Creates self-fulfilling prophecy (fewer leads → worse performance → even fewer leads)
- Resentment and disengagement
Mitigation strategies:
- Set minimum weights: No rep below 0.5x (ensures everyone gets meaningful volume)
- Transparent communication: Explain weighting methodology and improvement path
- Growth plans: Pair reduced allocation with lead follow-up best practices training and coaching
- Probationary floors: New reps get standard allocation for first 90 days (build skills before weighting applied)
Growth Paths and Weight Progression
Career ladder approach:
| Level | Typical Conversion | Weight | Leads/Month (if 1000 total) |
|---|---|---|---|
| Senior AE | 35-45% | 2.5 | 250 |
| Standard AE | 25-35% | 2.0 | 200 |
| Mid-Level AE | 20-30% | 1.5 | 150 |
| Junior AE | 15-25% | 1.0 | 100 |
| New Hire AE | Ramp period | 0.5 | 50 |
Progression message: "As you improve conversion, your allocation increases. Top performers earn more opportunities."
Monitoring and Adjustment
KPIs to Track
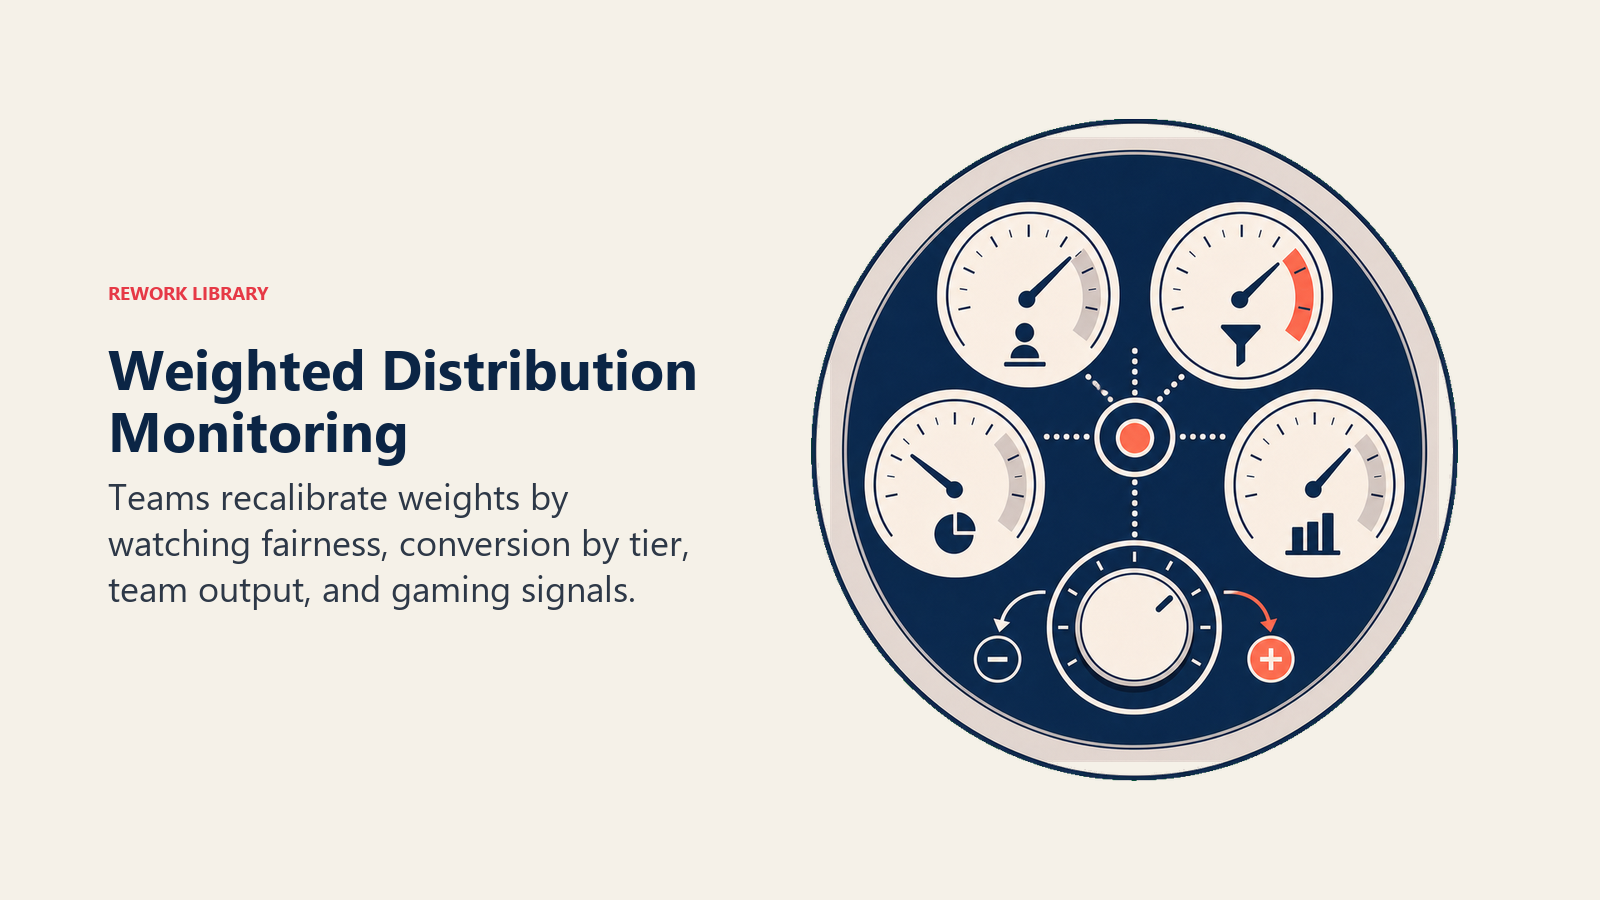
Distribution fairness (within weight tiers):
- Are reps with same weight getting similar volume?
- Standard deviation within tier
Conversion by weight tier:
- Does higher weight correlate with higher conversion?
- If not, weighting methodology may be flawed
Overall team conversion:
- Is total pipeline increasing with weighted distribution?
- Compare to baseline round-robin period
- Track pipeline velocity improvements
Rep satisfaction:
- Do reps understand weighting?
- Do reps perceive it as fair?
Red Flags: Gaming the System
Sandbagging:
- Rep intentionally delays closing deals to maintain high pipeline (reducing weight and future lead flow)
- Detection: Deal aging management reveals slowing velocity
- Mitigation: Weight based on conversion rate, not pipeline load
Cherry-picking within assignments:
- Rep works high-value assigned leads aggressively, ignores low-value
- Detection: Activity concentration on subset of leads
- Mitigation: Track contact rate on all assigned leads via lead status management
Disqualifying leads too aggressively:
- Rep disqualifies leads quickly to maintain high conversion rate
- Detection: Disqualification rate spike, manager reviews dispo reasons
- Mitigation: Include disqualification rate in weight formula using lead qualification frameworks (penalize excessive disqualification)
Recalibration Triggers
When to adjust weights:
- Quarterly review: Standard recalibration cycle
- Performance change >20%: Rep's conversion rate jumps or drops significantly
- Team change: New hire, resignation, promotion
- Lead quality shift: Source mix changes tracked through lead sources overview, average lead quality changes
Example recalibration:
Quarter 1: Rep A weight = 2.0 (40% conversion)
Quarter 2: Rep A converts at 25% (slump, coaching implemented)
Quarter 3: Adjust weight to 1.5 (reduce allocation while coaching)
Quarter 4: Rep A back to 35% conversion
Quarter 5: Restore weight to 2.0
Weighted Distribution Example
Scenario: 5 AEs, 200 leads/month, weighted by conversion rate
| Rep | Conversion Rate | Weight Calculation | Weight | Leads/Month |
|---|---|---|---|---|
| Alice | 40% | 40/25 = 1.6 | 1.6 | 62 |
| Bob | 30% | 30/25 = 1.2 | 1.2 | 46 |
| Carlos | 25% | 25/25 = 1.0 | 1.0 | 38 |
| Diana | 20% | 20/25 = 0.8 | 0.8 | 31 |
| Eric | 10% | 10/25 = 0.4 | 0.4 (floor 0.5) | 23 |
Total weight: 1.6 + 1.2 + 1.0 + 0.8 + 0.5 = 5.1
Lead allocation:
- Alice: (1.6/5.1) × 200 = 62.7 ≈ 62 leads
- Bob: (1.2/5.1) × 200 = 47.1 ≈ 46 leads
- Carlos: (1.0/5.1) × 200 = 39.2 ≈ 38 leads
- Diana: (0.8/5.1) × 200 = 31.4 ≈ 31 leads
- Eric: (0.5/5.1) × 200 = 19.6 ≈ 23 leads (rounded to give everyone full allocation)
Expected opportunities:
- Alice: 62 × 40% = 24.8 opps
- Bob: 46 × 30% = 13.8 opps
- Carlos: 38 × 25% = 9.5 opps
- Diana: 31 × 20% = 6.2 opps
- Eric: 23 × 10% = 2.3 opps
- Total: 56.6 opportunities
Compare to round-robin (40 leads each):
- Alice: 40 × 40% = 16 opps
- Bob: 40 × 30% = 12 opps
- Carlos: 40 × 25% = 10 opps
- Diana: 40 × 20% = 8 opps
- Eric: 40 × 10% = 4 opps
- Total: 50 opportunities
Result: Weighted distribution produces 13% more opportunities (56.6 vs 50) from same 200 leads.
The Bottom Line
Weighted distribution accepts inequality to drive results. You allocate more opportunities to proven converters and generate more pipeline from the same marketing investment.
The trade-offs are real. Lower performers receive fewer opportunities, team dynamics shift, and perceived fairness decreases. But when you implement it with transparency, minimum allocation floors, and clear growth paths, weighted distribution drives measurable revenue improvement.
Combine weighted distribution with lead response time optimization and lead assignment SLA enforcement to maximize conversion rates.
Equal distribution feels fair. Weighted distribution drives results. The choice depends on your organizational priorities.
Frequently Asked Questions about Weighted Lead Distribution
What is weighted lead distribution and how does it differ from round-robin?
Weighted lead distribution assigns leads to sales reps based on predefined ratios rather than strict sequential equality. Where round-robin gives every rep a 1:1:1 share, weighted distribution uses ratios like 3:2:1, so top performers receive proportionally more leads. The goal is to maximize total pipeline output from a fixed lead volume, if your top rep converts at 40% and your bottom rep at 10%, routing the same volume to both wastes a significant portion of your marketing investment.
How much revenue lift can weighted distribution actually produce?
The gain depends on the spread between your top and bottom performers. Using the example in this article, a 5-rep team with conversion rates ranging from 10% to 40%, shifting from equal distribution (50 opportunities) to weighted allocation produces 56.6 opportunities from the same 200 leads, a 13% increase. McKinsey research has found that companies using systematic lead scoring and allocation (the data backbone of weighted distribution) see up to 20% more conversions, representing significant pipeline growth without additional marketing spend.
How do you decide what weight to assign each sales rep?
The most defensible approach ties weights directly to measured conversion rates using the formula: Weight = Rep's conversion rate divided by team average. A rep converting at 40% against a 25% team average gets a weight of 1.6; a rep at 10% gets 0.4 (or a floor of 0.5). Most teams recalibrate quarterly using a rolling 90-day window to smooth short-term variance while staying responsive to real performance shifts. Avoid monthly recalculation for small teams, the volatility creates gaming incentives and perceived unfairness.
Will lower-performing reps disengage if they receive fewer leads?
This is the central tension in weighted distribution, and it's a real risk. The mitigation is threefold: set a minimum weight floor (typically 0.5x average so no rep receives fewer than half the average allocation), communicate the weighting methodology transparently so reps understand the criteria, and pair reduced allocation with active coaching and a clear progression path. Probationary floors, giving new reps standard allocation for their first 90 days before weighting applies, prevent the discouraging feedback loop of fewer leads producing worse performance, which would justify even fewer leads.
What metrics should you use to set weights, conversion rate, quota attainment, or something else?
Use lead-to-opportunity conversion rate if your primary goal is pipeline generation, because it measures the rep's ability to qualify and advance leads, the exact activity you're trying to optimize with weighted allocation. Use quota attainment if you're optimizing for closed revenue. Avoid using pipeline load (active opportunities) as the primary weighting metric, because it creates a perverse incentive to close deals slowly in order to maintain a full pipeline and reduce future lead allocation. If you want a holistic view, composite weighting, blending performance (50% weight), capacity (30%), and experience (20%), produces the most balanced results but requires more complex calculation and explanation.
How often should you recalibrate weights, and what should trigger an off-cycle adjustment?
Standard cadence is quarterly with a rolling 90-day performance window. Off-cycle adjustments are warranted when a rep's conversion rate changes by more than 20% in either direction (a meaningful slump or a sustained breakout), when a team member joins or leaves, or when your lead source mix changes significantly and the same rep-lead matching logic no longer applies. One warning sign to watch for: a rep whose disqualification rate spikes sharply after weighting is implemented may be aggressively disqualifying leads to inflate their conversion rate, monitor this alongside the primary metrics.
Learn More: Related Lead Management Resources
Ready to implement weighted distribution? Start with round-robin assignment as the foundation, then layer in performance-based weighting. Combine with territory-based routing for sophisticated, optimized allocation.
Distribution Strategy & Methods
- Lead Distribution Strategy - Master framework for choosing the right distribution approach
- Push Distribution Methods - Automatic assignment strategies including weighted models
- Account-Based Routing - Route leads based on existing account relationships
- Competitive Lead Assignment - Gamified distribution that rewards performance
Performance Optimization
- Lead Response Time - Speed optimization for higher conversion rates
- Lead Assignment SLA - Service level agreements for lead handling
- Lead Scoring Systems - Prioritize leads based on conversion probability
- Lead Nurturing Programs - Systematic engagement for lower-priority leads
Pipeline & Conversion Analysis
- Lead-to-Opportunity Conversion - Optimize the critical conversion step
- Conversion Rate Analysis - Measure and improve rep performance
- Pipeline Velocity - Accelerate deals through your pipeline
- Win Rate Improvement - Strategies to increase close rates

Senior Operations & Growth Strategist
On this page
- What is Weighted Distribution?
- When to Use Weighted Distribution
- Clear Performance Differentiation Exists
- Optimizing for Revenue over Equality
- Performance Measurement is Reliable
- Capacity Differences are Real
- How to Set Weighting Ratios
- 1. Simple Ratio Weighting
- 2. Performance Metric Weighting
- 3. Capacity-Based Weighting
- 4. Composite Weighting
- Implementation Mechanics
- Setting Weight Values in Router Service
- Dynamic Weight Adjustment
- Bulk Import for Team Weights
- Weight Calculation Formulas
- Performance-Based Weighting Explained
- Metrics to Use
- Weighting Algorithms and Formulas
- Adjustment Frequency
- Capacity-Based Weighting Explained
- Current Pipeline Load Consideration
- Available Hours / FTE Weighting
- Vacation and Availability Handling
- The Equity vs Meritocracy Balance
- When Equal Distribution Makes Sense
- Avoiding Demotivation of Lower Performers
- Growth Paths and Weight Progression
- Monitoring and Adjustment
- KPIs to Track
- Red Flags: Gaming the System
- Recalibration Triggers
- Weighted Distribution Example
- The Bottom Line
- Learn More: Related Lead Management Resources
- Distribution Strategy & Methods
- Performance Optimization
- Pipeline & Conversion Analysis