ビジネスプロセスマッピング:種類、シンボル、ステップ
Turn this article into takeaways for your work.
Each assistant summarizes the article only for you and suggests best practices for your work.
ビジネスプロセスマッピングは「うちではこうやっている」を、チームの誰もが読んで、理解して、改善できる視覚的な図に変換します。組織が暗黙知と口頭での引き継ぎに依存しているなら、プロセスマップはそれを変える最速の方法です。
ビジネスプロセスマッピングとは
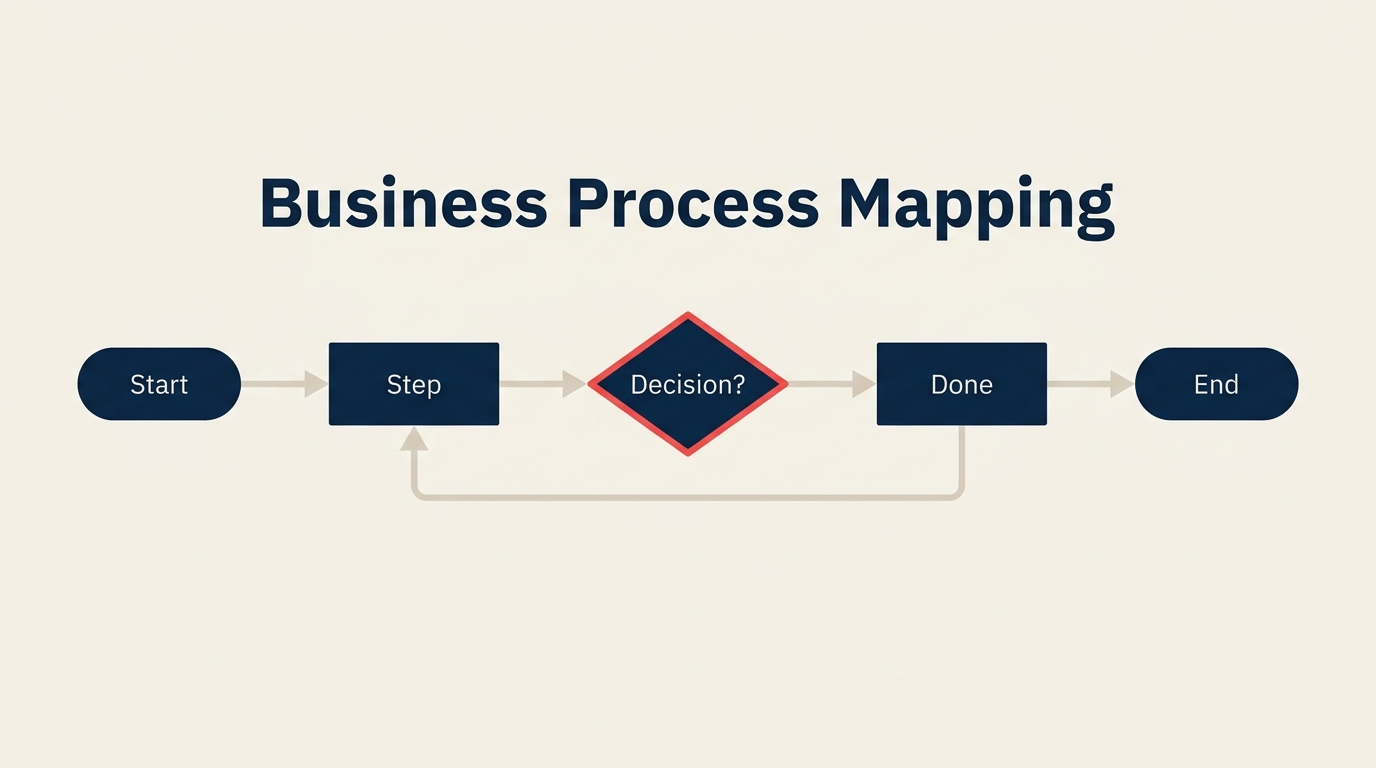
ビジネスプロセスマッピングは、最初から最後までビジネスプロセスを完成させるためのステップ、意思決定、役割、インプットを視覚的に表現する実践です。マップは何が起こり、誰がそれを行い、どの順序で、何が次のアクションを引き起こすかを正確に示します。
テキストベースの手順書とは異なり、プロセスマップは標準化された形状と矢印を使ってワークフローのロジックをひと目でわかるようにします。長方形はタスクが実行されることを示します。菱形は意思決定を示します。楕円はプロセスの始まりまたは終わりを示します。これらの規則は公開された標準に基づいているため、チームメンバー、外部委託先、または監査人がガイドなしにマップを読めます。
プロセスマップはビジネスプロセス管理の中核にあります。まず説明しなければ改善できないからです。組織はマップを使って新入社員の研修、コンプライアンス監査、ムダの発見、自動化の準備、そしてリーダーシップが想定している通りではなく実際にどのように業務が行われているかを文書化します。
主要事実
- プロセスを体系的にマッピングしている企業は、その役割への新入社員のオンボーディングが40%速いと報告しています(BPM Institute、2023年)。
- 標準的なプロセスマッピングシンボルは**ANSIのX3.5標準(1970年)**とISO 5807(1985年)に由来し、今日も使用されています(ISO、1985年)。
- **プロセス改善のイニシアチブの約80%**は、将来の状態(「あるべき姿」)を設計する前に現状マップ(「現状」)から始まります(APQC プロセス分類フレームワーク、2024年)。
ビジネスプロセスをマッピングする理由
ほとんどの組織における最大の隠れたコストは、給与でも費用でもありません。同じことを繰り返し行うことに費やす時間、引き継ぎミスの修正、すでに書かれているべきステップの再説明です。ベテラン社員が去ると、そのプロセスの知識も一緒に持ち出されてしまいます。新入社員が入ると、散在するメールや廊下での会話から暗黙知を組み立てるために何週間も費やします。
文書化されたプロセスマップはこれを解決します。マップは各ステージで何をすべきか、誰を巻き込むべきかを正確に示すため、新入社員は40%速く仕事を覚えられます。マネージャーは完全な監査を実施することなく、どこで業務がボトルネックになっているかを把握できます。そしてリーン方式を適用する準備やDMAICの改善サイクルを実施する際には、将来の「あるべき姿」を設計する前にベースラインとなる「現状」マップが必要です。
プロセスマップは責任の明確化にも役立ちます。誰もが各ステップのオーナーを確認できると、タスクが部門間の隙間に落ちることが難しくなります。その明確さだけで、部門横断プロセスのエラー率が下がる傾向があります。
ビジネスプロセスマップの6種類
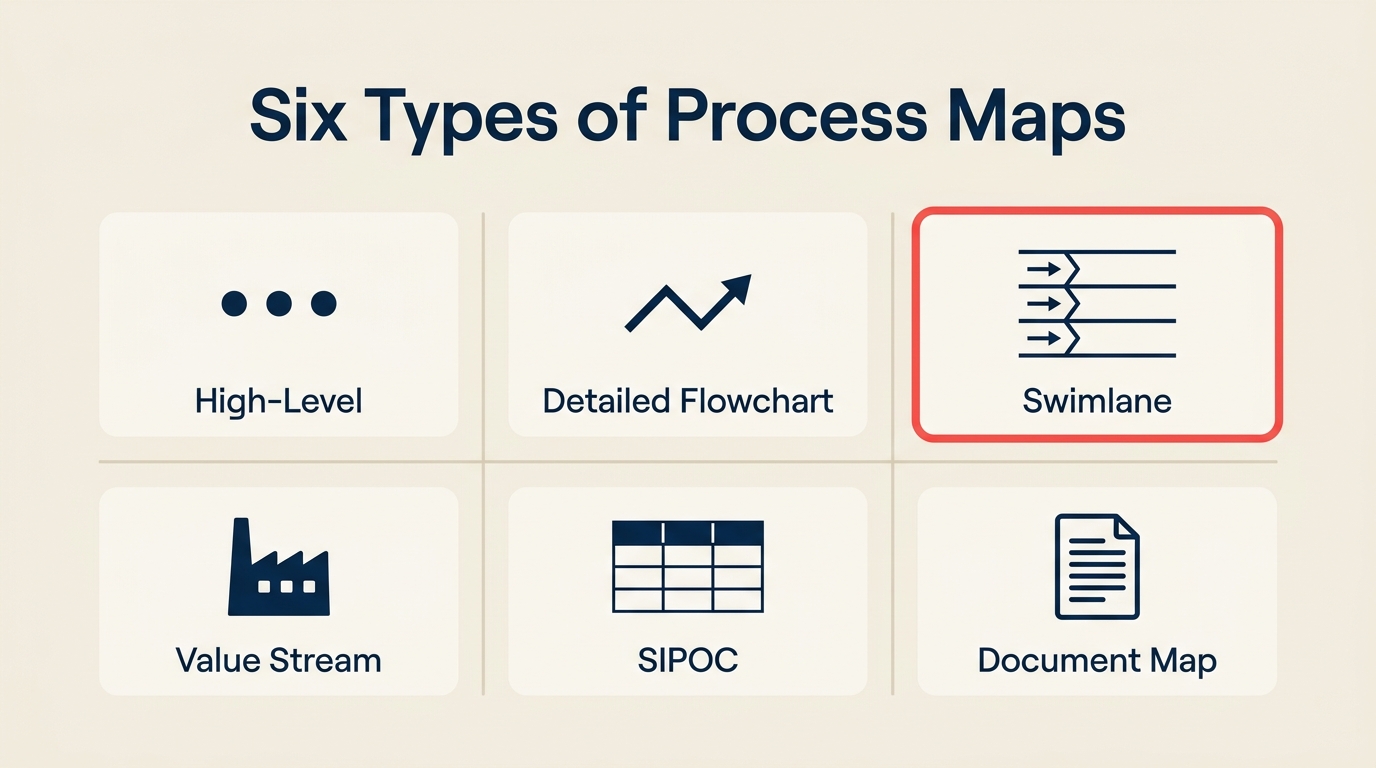
すべてのプロセスが同じ種類のマップを必要とするわけではありません。高レベルの概要は経営陣とのコミュニケーションに十分です。スイムレーン図は部門横断の引き継ぎに適しています。最初に適切な種類を選ぶと、ステークホルダーが詳細の多寡を求めてきたときにマップを作り直す手間が省けます。
| 種類 | 目的 | 使用場面 | 最適な対象 |
|---|---|---|---|
| 高レベル(トップダウン) | 主要フェーズのみを示す、5から10個のボックス | 最初のパス、経営幹部へのブリーフィング | C-suiteの合意形成 |
| 詳細フローチャート | すべてのステップ、意思決定、分岐 | 研修、コンプライアンス、自動化準備 | オペレーションチーム |
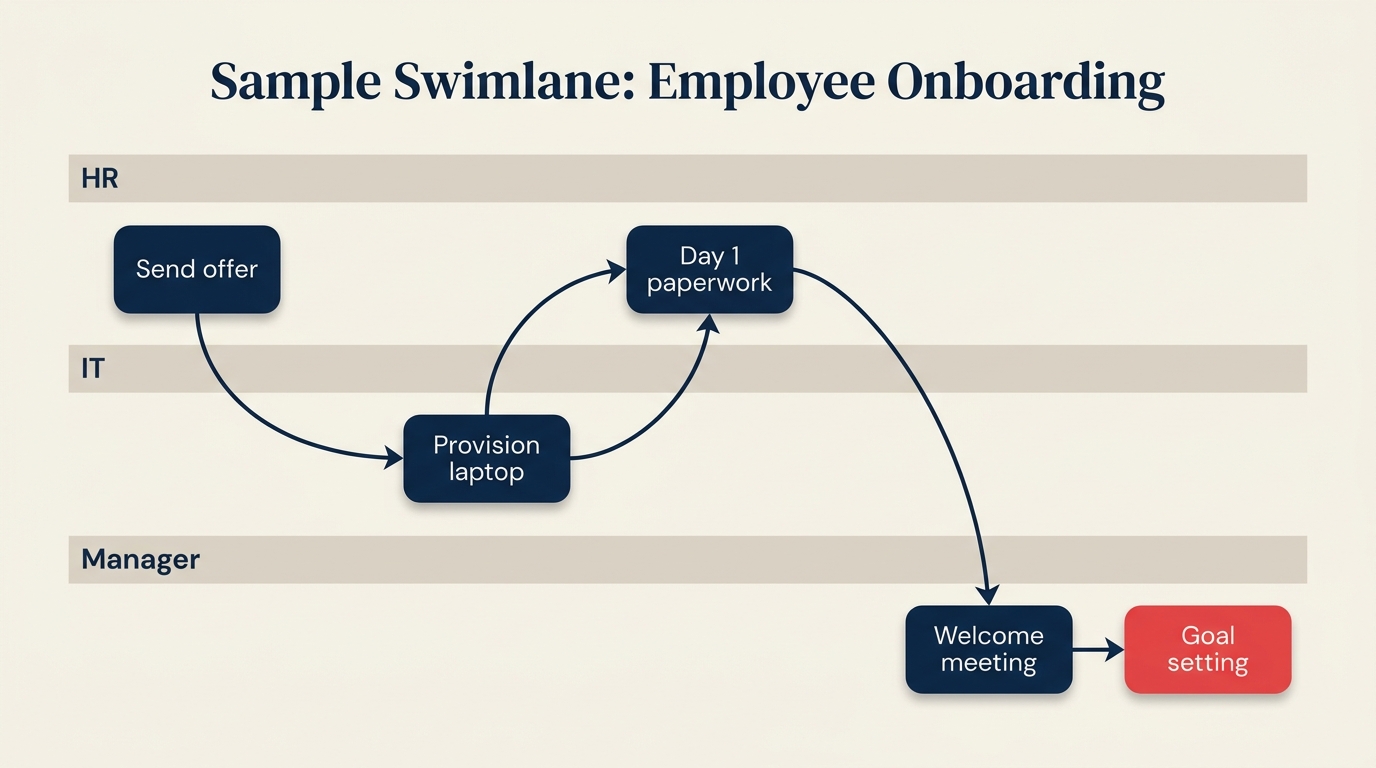
| スイムレーン | 役割や部門でグループ化されたステップ | 複数のオーナーを持つ部門横断ワークフロー | 引き継ぎが多いプロセス |
| バリューストリームマップ(VSM) | 時間データを含む材料と情報のフロー | 生産またはサービス提供におけるムダの特定 | Lean改善 |
| SIPOC | サプライヤー、インプット、プロセス、アウトプット、顧客を一覧で | Six Sigmaプロジェクト前のスコープ定義 | プロジェクトのキックオフ |
| ドキュメントマップ | 各ステップを通じてどの文書が移動するかを示す | コンプライアンス、監査証跡、ISO認証 | 規制産業 |
内在するムダや遅延のあるプロセスには、バリューストリームマップが他の種類では得られないデータを提供します。タイムスタンプと待ち時間を追加することで、どこで時間が失われているかを定量化できます。
標準的なプロセスマッピングシンボル
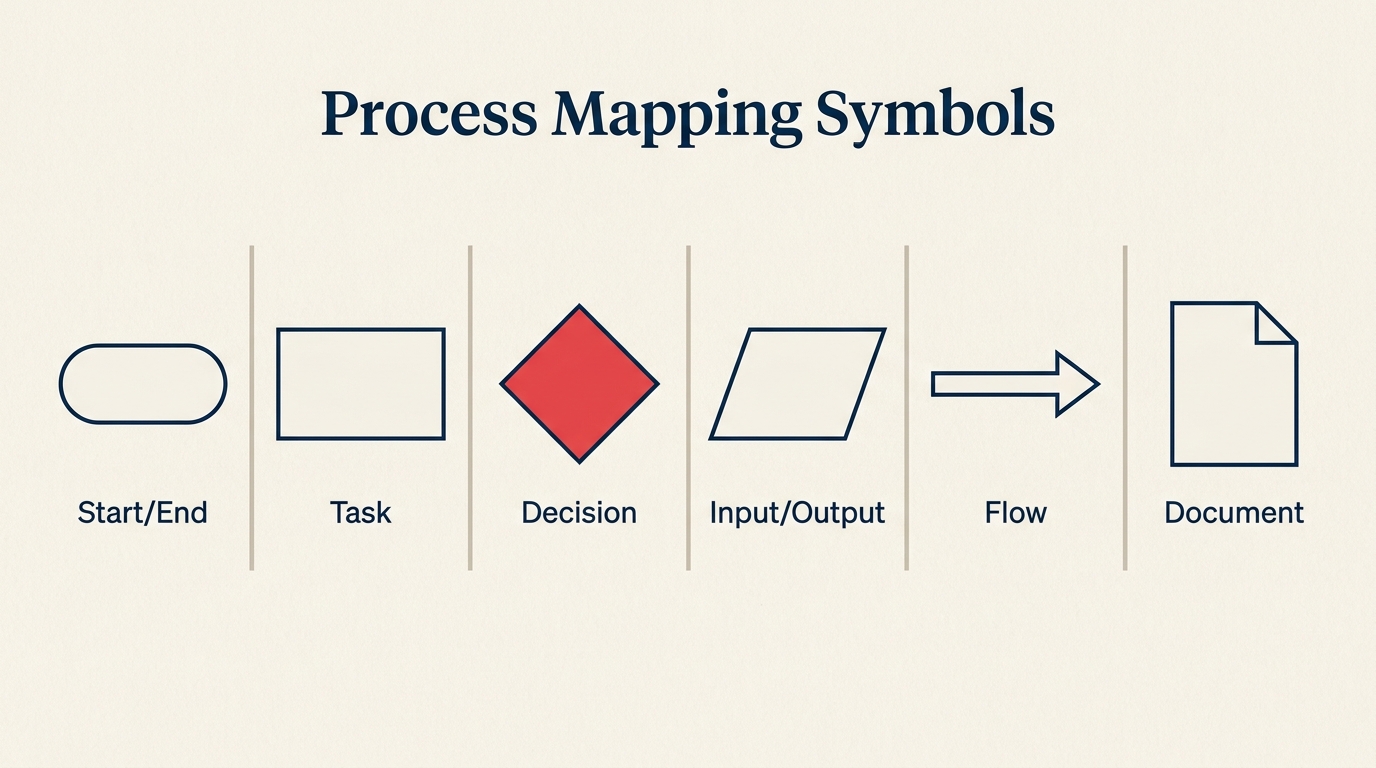
プロセスマップで使用されるシンボルはANSI X3.5標準とISO 5807に由来します。1970年代から使用されており、Visio、Lucidchart、Miro、draw.ioなどのツールに実装されています。一度覚えれば、どのプロセスマップも読めるようになります。
| シンボル | 意味 | 例 |
|---|---|---|
| 楕円(ターミネーター) | プロセスの開始または終了 | 「顧客がリクエストを送信」「請求書の支払い完了」 |
| 長方形(プロセス) | 実行されるタスクまたはアクション | 「申請を審査」「確認メールを送信」 |
| 菱形(意思決定) | はい/いいえまたはどちらかの分岐点 | 「承認されたか?」「注文は完了しているか?」 |
| 平行四辺形(I/O) | 入出力するデータ、情報、または材料 | 「顧客データ入力済み」「印刷済みの受領書」 |
| 矢印(フロー) | ステップ間の順序の方向 | すべての形状を順番に接続 |
| ドキュメント形状 | プロセス内の物理的またはデジタルな文書 | 「署名済みの契約書」「経費精算書」 |
| 円(コネクター) | ページをまたいで続くマップの2つの部分を結ぶ | 複数ページにわたる大規模なフローチャートで使用 |
詳細な図を最初から構築する必要がある場合は、フローチャートとは何かガイドが完全なシンボルセットをより詳しくカバーしています。
ビジネスプロセスのマッピング方法:ステップバイステップ
ほとんどのマッピングプロジェクトが失敗するのは同じ理由です。マップを描く担当者が実際に業務を行う人と話したことがないからです。以下の7つのステップがそれを防ぎます。
ステップ1:スコープを定義する
プロセスの名称を決め、境界を設定します。何がそれを引き起こすか?最終状態は何か?「顧客オンボーディング」は広すぎます。「契約書への署名から初回ログインまでの新規顧客アカウントの有効化」が適切なスコープです。
ステップ2:実際に業務を行う人と話す
プロセスを毎日実行する人へインタビューするか、同行します。方針が言うべき内容ではなく、実際に何をしているかを説明するよう依頼します。この2つのギャップが改善の機会が潜んでいる場所です。これは確実なプロセス文書の基礎でもあります。
ステップ3:開始点と終了点を特定する
最初のトリガーと最終成果物を特定します。それらをキャンバス上の楕円形として書きます。マップの他のすべてはこの2つのアンカーの間で起こります。
ステップ4:すべてのアクティビティを順番にリストアップする
発生する順序で、すべてのタスク、意思決定、引き継ぎをリストアップするために現場の専門家と協力します。エッジケースや例外パスを省略しないでください。「顧客が返答しない場合は?」という分岐は正常パスと同じくらい現実のものです。
ステップ5:マップを描く
正しいシンボルを使って順番にアクティビティを配置します。スイムレーンを構築する場合は役割ごとにステップをグループ化します。プロセスが分岐できる場所に意思決定の菱形を追加します。フローの方向を示す矢印ですべてを接続します。できる限りマップは1ページに収めます。スクロールが必要なマップはスコープが広すぎることが多いです。
ステップ6:ステークホルダーと検証する
業務を行う人とプロセスを所有する人にドラフトを共有します。「これは正確か?」という一つの質問をします。初稿では少なくとも2つの修正が見つかるのは正常です。チームが実態を反映していると確認するまで更新・共有を繰り返します。
ステップ7:公開・維持する
チームが見つけられる場所にマップを保存します。オンボーディング資料、社内wiki、標準作業手順書にリンクします。レビュー日を設定します。通常は6から12ヶ月ごと、または基となるプロセスが大きく変わるたびです。昨年のワークフローを反映したプロセスマップはリソースではありません。リスクです。
ビジネスプロセスマッピングの例
実例を見ることで理論が具体化されます。以下の4つの一般的なプロセスは、マップの種類の選択が得られる洞察にどのように影響するかを示しています。
| プロセス | マップの種類 | 得られる主な洞察 |
|---|---|---|
| 顧客オンボーディング | スイムレーン | Sales、IT、Customer Success間のどの引き継ぎが最も遅延を引き起こしているかを示す |
| 受注から入金まで | バリューストリームマップ | 受注から処理までの待ち時間を明らかにする(多くの場合、アイドルタイムが60から70%) |
| 採用・リクルーティング | 詳細フローチャート | 重複した審査ステップと不明確な承認権限を露出させる |
| 経費承認 | SIPOC | 誰が提出するか、どのインプットが必要か、財務がループをクローズするために実際に何が必要かを明確にする |
採用プロセスでは、詳細フローチャートにより3人の異なる人が引き継ぎメモなしに異なるステージで同じ履歴書を審査していることが多く明らかになります。マッピングすることで重複が目に見えるようになり、一度のミーティングで修正できます。
これらのワークフローの1つを再設計するためにデザインプロセスを使用している場合、現状マップがベースラインになります。現状マップで時間、エラー率、引き継ぎを測定し、それらの指標を目標として「あるべき姿」マップを設計します。
プロセスマッピング対BPMN対フローチャート
これら3つの用語は同義で使われることがあります。しかし同じものではありません。
| 特徴 | プロセスマップ | BPMN | フローチャート |
|---|---|---|---|
| 標準 | ANSI / ISOシンボル、非公式 | OMG BPMN 2.0(正式表記) | ANSI X3.5(プロセスマップと同一) |
| 対象者 | ビジネスチーム、オペレーション | ビジネスアナリスト、ソフトウェアエンジニア | 誰でも |
| 詳細レベル | 中程度、人間が読めるレベル | 高い、機械実行可能 | 可変 |
| ツール | Visio、Lucidchart、Miro | Camunda、Bizagi、ARIS | あらゆる図作成ツール |
| 最適用途 | 研修、改善、コミュニケーション | ワークフロー自動化、BPMプラットフォーム | 素早い概要説明、文書化 |
プロセスマッピングとフローチャートは本質的に同じアクティビティで、同じシンボルを使います。BPMNは追加のシンボル(プール、レーン、イベント、ゲートウェイ)を持つ独立した正式標準で、ワークフローを表示するだけでなく実行できるツール向けに設計されています。
よくある間違い
避けること:
- マネージャーだけにインタビューする。彼らは多くの場合、実際のプロセスではなく理想的なプロセスを説明します。
- あまりに高いレベルでマッピングする。「審査して承認する」はフローチャートでは1つのボックスですが、実際には5つの明確なステップです。
- 孤立した状態でマップを作る。誰も検証しないプロセスマップは架空のものです。
- 例外パスを省略する。「ファイルが見つからない場合は?」というケースは思っているより頻繁に起こります。
- マップを陳腐化させる。古いマップは人々に誤った行動を教えます。
実践すること:
- 実際に業務を行う人の実務を同行観察する。
- 正常パスから始めて、例外分岐を追加する。
- マップ全体を通じて正しいシンボルセットを一貫して使用する。
- スコープを1つのプロセスに限定する。
- 標準作業手順書に直接マップをリンクして、常にクリック1つで参照できるようにする。
ベストプラクティス
- 1ページに収める。 収まらない場合は、スコープが広すぎます。サブプロセスに分割します。
- スイムレーンのラベルを一貫させる。 一つのレーンが「Sales」で別が「Account Executive」なら、読者はそれらが同じ役割かどうか混乱します。
- すべてのバージョンに日付を入れる。 プロセスが変わったら、日付スタンプを付けて古いマップをアーカイブします。監査人はこれを好みます。
- 色分けは控えめに。 意思決定ポイントや問題のある箇所に1つのアクセントカラーを使うのは有用です。5色では誰も読まない凡例になります。
- マップを指標と結びつける。 3日間の遅延がどこで起きているかを示すマップは、ステップを示すだけのマップよりはるかに説得力があります。主要なアクティビティの横に時間の見積もりを追加します。
- 検索可能にする。 個人のデスクトップではなく、共有wikiにマップを保存します。誰も見つけられないマップは、誰も使わないマップです。
- 定期的に見直す。 カレンダーリマインダーを設定します。変化の多いプロセスは四半期ごと、安定したプロセスは年1回です。
- 改善活動と結びつける。 プロセスマップはSix Sigmaプロジェクト、DMAICサイクル、Lean方式のイニシアチブの出発点です。その繋がりを明示的に構築します。
よくある質問
プロセスマッピングとプロセスモデリングの違いは何ですか?
プロセスマッピングは視覚的な図を使ってワークフローの現状を説明します。主にコミュニケーションと文書化のツールです。プロセスモデリングはより広義で、シミュレーション、数学的表現、自動化対応の仕様を含む場合があります。プロセスマップを今日の業務がどのように行われているかの写真だとすれば、プロセスモデルはシステムが実行または分析できる設計図のようなものです。BPMNはモデリング表記法です。フローチャートとスイムレーンはマッピングフォーマットです。
プロセスマッピングの標準シンボルはどれですか?
ANSI X3.5標準とISO 5807がコアセットを定義しています。楕円(開始/終了)、長方形(タスク)、菱形(意思決定)、平行四辺形(入出力)、矢印(フローの方向)、ドキュメント形状、コネクター円です。ほとんどのビジネスプロセスマッピングツールはデフォルトでこれらを搭載しています。BPMNは独自の拡張シンボルセットを追加しますが、日常のビジネス文書化にはANSI/ISO形状で十分であり、技術的でない対象者にもはるかに読みやすいです。
プロセスマッピングに最適な無料ツールは何ですか?
LucidchartとDraw.io(diagrams.netとも呼ばれる)が最も広く使われている無料オプションです。Draw.ioは完全に無料でオフラインでも使えます。Miroはワークショップでのリアルタイム共同マッピングに適しています。Microsoft Visioは従来のエンタープライズ標準ですが、有料ライセンスが必要です。文書に埋め込む素早いマップには、小規模チームならGoogle SlidesやPowerPointの図形ライブラリでも十分です。
プロセスマップはどのくらいの頻度で更新すべきですか?
変化の多いプロセスは四半期ごと、安定したプロセスは年1回見直します。しかし、より実用的なルールは、基となるプロセスが変わるたびに更新することです。新しいツールが手動ステップを置き換えたら、同じ週中にマップを変更すべきです。古いマップは「マップなし」より悪い状況で、新入社員や監査人を積極的に誤った方向に導きます。チームではなく個人名でプロセスオーナーを指定し、責任を明確にしてください。
組織内でプロセスマップのオーナーは誰が担うべきですか?
各マップには、プロセスが提供する成果に責任を持つマネージャーまたはチームリードがプロセスオーナーとして指名されているべきです。オペレーションまたはプロセスエクセレンスチームが文書化標準とツールを管理できますが、現場の専門家が正確性を検証します。部門横断プロセスについては、主要オーナーを指定し、各関連部門からのセカンダリレビュワーをリストアップします。明確なオーナーシップがなければ、それを構築した人が異動した瞬間にマップは孤立します。
より大きな文脈でのプロセスマッピングの位置づけ
プロセスマップはめったに最終目的地ではありません。それはスタートラインです。正確な現状マップができたら、それを測定し、ボトルネックとムダを特定し、より良い将来の状態を設計できます。それがプロセス管理の本質です。場当たり的な作業を、一貫して成果を上げ、時間とともに改善し、特定の誰かの記憶に依存しないシステムに変えることです。
チームが苦労している1つのプロセスから始めてください。図にして書き出してください。それを生きている人と検証してください。そうすれば、後に続く改善の会話は自然と導かれます。

Senior Operations & Growth Strategist
On this page
- ビジネスプロセスマッピングとは
- ビジネスプロセスをマッピングする理由
- ビジネスプロセスマップの6種類
- 標準的なプロセスマッピングシンボル
- ビジネスプロセスのマッピング方法:ステップバイステップ
- ステップ1:スコープを定義する
- ステップ2:実際に業務を行う人と話す
- ステップ3:開始点と終了点を特定する
- ステップ4:すべてのアクティビティを順番にリストアップする
- ステップ5:マップを描く
- ステップ6:ステークホルダーと検証する
- ステップ7:公開・維持する
- ビジネスプロセスマッピングの例
- プロセスマッピング対BPMN対フローチャート
- よくある間違い
- ベストプラクティス
- よくある質問
- より大きな文脈でのプロセスマッピングの位置づけ