Methode des kritischen Pfads (CPM): So finden Sie den kritischen Pfad
Turn this article into takeaways for your work.
Each assistant summarizes the article only for you and suggests best practices for your work.
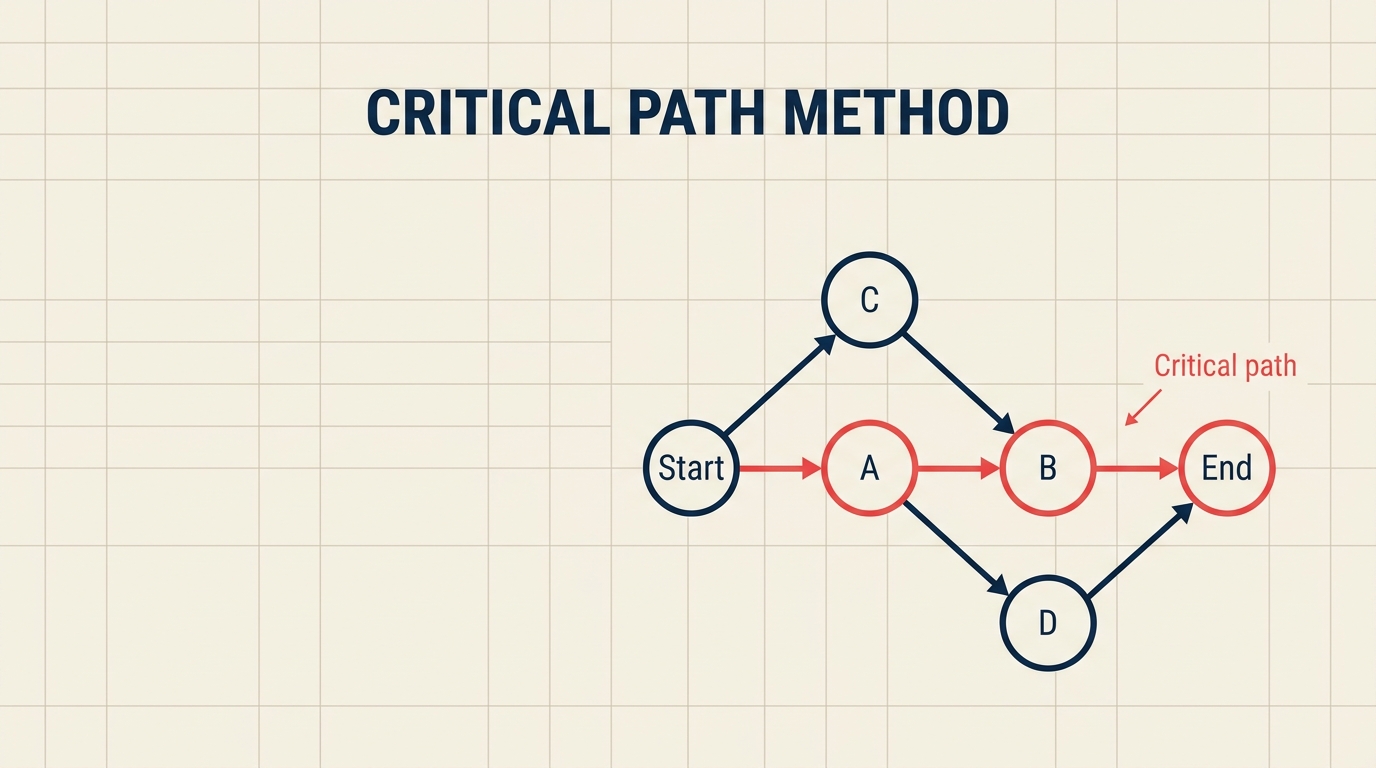
Die Methode des kritischen Pfads ist eine Planungstechnik, die die längste Sequenz abhängiger Aufgaben in einem Projekt identifiziert, und damit die minimale Zeit bestimmt, die das Projekt dauern kann. Verzögern Sie eine Aufgabe auf diesem Pfad, verschiebt sich das gesamte Enddatum; schützen Sie ihn, schützen Sie Ihren Termin.
Was ist die Methode des kritischen Pfads (CPM)?
CPM ist ein Planungsalgorithmus, der alle Aufgaben in einem Projekt abbildet, sie nach Abhängigkeiten verknüpft, früheste und späteste mögliche Zeiten für jede Aufgabe berechnet und die Kette von Aufgaben mit null Planungsflexibilität als kritischen Pfad kennzeichnet. Diese Kette bestimmt die Mindestdauer des Projekts.
Ursprung: Die Ingenieure Morgan Walker bei DuPont und James Kelley bei Remington Rand entwickelten CPM 1957, um komplexe Anlagenstillstände zu verwalten. Ihr Ziel war es, kostspielige Ausfallzeiten zu reduzieren, und CPM lieferte: Die Wartungszeit wurde so erheblich verkürzt, dass sich die Technik innerhalb eines Jahrzehnts branchenübergreifend verbreitete.
Kerngedanke: Nicht alle Aufgaben sind gleich wichtig. Einige Aufgaben haben Puffer (genannt Float oder Slack). Aufgaben auf dem kritischen Pfad haben keinen.
Wichtige Fakten
DuPont berichtete, dass CPM die chemischen Anlagenwartungsstillstände in den späten 1950er Jahren um geschätzte 25 % verkürzte (DuPont-interner Bericht, 1959).
Der PMI PMBOK Guide behandelt CPM als grundlegende Methode der Terminplanungsanalyse, enthalten in jeder Ausgabe von der ersten bis zur siebten (PMI, PMBOK Guide 7th Edition, 2021).
Gartner prognostiziert, dass der globale Markt für Projektmanagementsoftware bis 2027 9,8 Milliarden US-Dollar übersteigen wird, wobei Terminoptimierungsfunktionen wie CPM zu den wichtigsten Treibern gehören (Gartner, 2023).
Schlüsselbegriffe
Bevor Sie die Berechnungen durchführen, ist es hilfreich, diese Begriffe verinnerlicht zu haben.
| Begriff | Symbol | Bedeutung |
|---|---|---|
| Aktivität | -- | Ein diskreter Arbeitsabschnitt mit definiertem Start, Ende und Dauer |
| Dauer | d | Zeit zum Abschließen der Aktivität (Tage, Stunden usw.) |
| Vorgänger | -- | Eine Aktivität, die abgeschlossen sein muss, bevor die aktuelle starten kann |
| Nachfolger | -- | Eine Aktivität, die erst starten kann, wenn die aktuelle abgeschlossen ist |
| Frühester Start | ES | Der früheste Zeitpunkt, an dem eine Aktivität beginnen kann, angesichts ihrer Vorgänger |
| Frühestes Ende | EF | Der früheste Zeitpunkt, an dem eine Aktivität enden kann (ES + Dauer) |
| Spätester Start | LS | Der späteste Zeitpunkt, an dem eine Aktivität beginnen kann, ohne das Projekt zu verzögern |
| Spätestes Ende | LF | Der späteste Zeitpunkt, an dem eine Aktivität enden kann, ohne das Projekt zu verzögern |
| Float / Slack | F | Wie viel eine Aktivität verzögert werden kann, ohne das Enddatum zu verschieben (LS - ES) |
| Kritischer Pfad | -- | Die Sequenz von Aktivitäten mit null Float; bestimmt die Projektdauer |
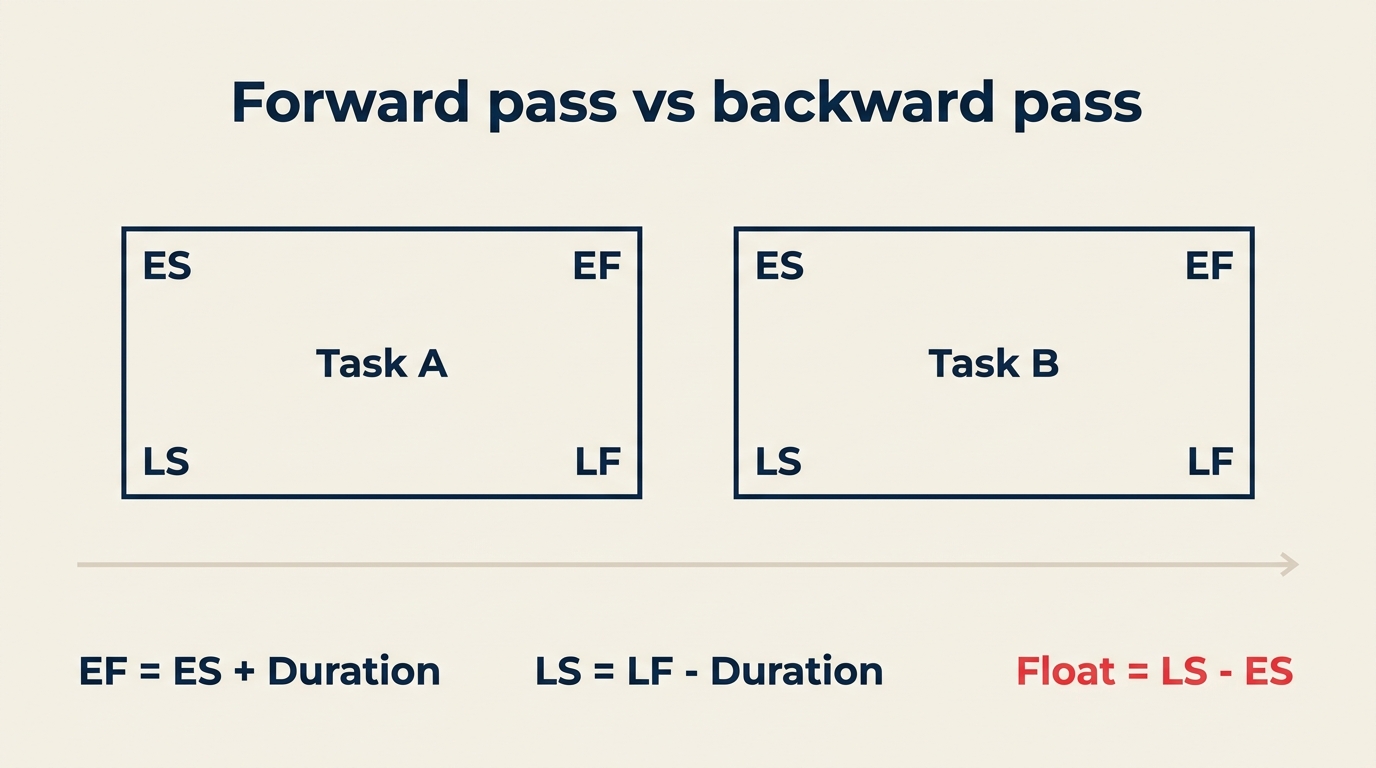
Vorwärtsrechnung vs. Rückwärtsrechnung
CPM verwendet zwei Durchläufe durch das Netzwerk, um den Zeitplan für jede Aktivität zu berechnen.
Vorwärtsrechnung (früheste Zeiten)
Beginnen Sie bei der ersten Aktivität und arbeiten Sie vorwärts zum Ende:
- ES = das Maximum der EF aller unmittelbaren Vorgänger (oder 0, wenn keine Vorgänger vorhanden sind)
- EF = ES + Dauer
Dies gibt Ihnen das frühestmögliche Enddatum für das gesamte Projekt.
Rückwärtsrechnung (späteste Zeiten)
Beginnen Sie bei der letzten Aktivität und arbeiten Sie zurück zum Anfang:
- LF = das Minimum der LS aller unmittelbaren Nachfolger (oder das Projektenddatum für die letzte Aktivität)
- LS = LF - Dauer
Float-Berechnung
Sobald Sie beide Durchläufe abgeschlossen haben:
- Float = LS - ES (gleichwertig: LF - EF)
Jede Aktivität, bei der Float gleich null ist, liegt auf dem kritischen Pfad.
So finden Sie den kritischen Pfad in 6 Schritten
Schritt 1: Aktivitäten und Dauern auflisten
Schreiben Sie alle Aufgaben auf, die zum Abschluss des Projekts erforderlich sind, und schätzen Sie, wie lange jede dauert.
- Teilen Sie die Arbeit in diskrete, messbare Aktivitäten auf
- Weisen Sie jeder eine realistische Dauer zu (nutzen Sie historische Daten oder Expertenschätzungen)
- Geben Sie jeder Aktivität eine eindeutige Kennung (A, B, C oder Aufgabe 1, Aufgabe 2 usw.)
Schritt 2: Abhängigkeiten identifizieren
Bestimmen Sie, welche Aktivitäten abgeschlossen sein müssen, bevor andere starten können.
- Fragen Sie bei jeder Aufgabe: „Was muss erledigt sein, bevor ich damit beginnen kann?"
- Erfassen Sie Vorgänger-Nachfolger-Beziehungen in einer Tabelle oder Abhängigkeitsmatrix
- Achten Sie auf Ende-zu-Start-, Start-zu-Start- und Ende-zu-Ende-Verknüpfungstypen (Ende-zu-Start ist der Standard in CPM)
Schritt 3: Den Netzplan zeichnen
Visualisieren Sie das Projekt als gerichteten Graphen, mit Aktivitäten als Knoten und Abhängigkeiten als Pfeile.
- Ordnen Sie Aktivitäten von links nach rechts anhand von Abhängigkeiten
- Stellen Sie sicher, dass jeder Pfad von Start bis Ende verbunden ist
- Verwenden Sie Flussdiagramme oder dedizierte Projektplanungs-Werkzeuge, um das Diagramm übersichtlich zu zeichnen
Schritt 4: Die Vorwärtsrechnung durchführen
Arbeiten Sie von links nach rechts und berechnen Sie ES und EF für jede Aktivität.
- Beginnen Sie mit ES = 0 für Aktivitäten ohne Vorgänger
- Wenden Sie ES = max(EF der Vorgänger) an jedem Zusammenführungspunkt an
- Erfassen Sie EF = ES + Dauer für jede Aktivität
Schritt 5: Die Rückwärtsrechnung durchführen
Arbeiten Sie von rechts nach links und berechnen Sie LF und LS für jede Aktivität.
- Beginnen Sie mit LF = Projektenddatum (dem EF der letzten Aktivität) für Aktivitäten ohne Nachfolger
- Wenden Sie LF = min(LS der Nachfolger) an jedem Verzweigungspunkt an
- Erfassen Sie LS = LF - Dauer für jede Aktivität
Schritt 6: Aktivitäten mit null Float identifizieren (der kritische Pfad)
Berechnen Sie Float für jede Aktivität und markieren Sie die Kette mit Float = 0.
- Float = LS - ES für jede Aktivität
- Aktivitäten, bei denen Float = 0 ist, bilden den kritischen Pfad
- Wenn zwei Ketten beide null Float haben, hat das Projekt mehrere kritische Pfade (siehe FAQ unten)
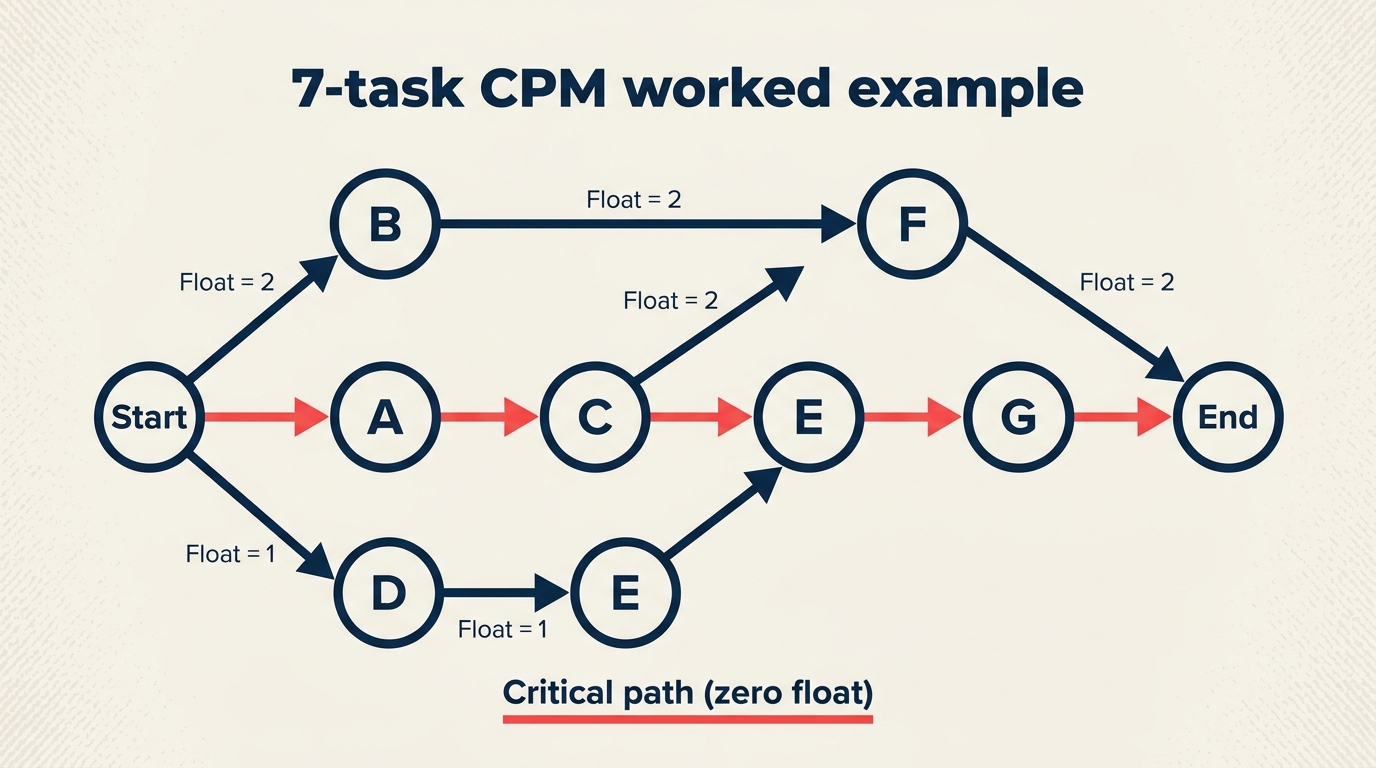
Durchgerechnetes Beispiel: 7-Aufgaben-Projekt
Betrachten Sie ein Software-Release-Projekt mit sieben Aktivitäten:
| Aktivität | Vorgänger | Dauer (Tage) | ES | EF | LS | LF | Float |
|---|---|---|---|---|---|---|---|
| A: Anforderungen | -- | 3 | 0 | 3 | 0 | 3 | 0 |
| B: UI-Design | A | 4 | 3 | 7 | 5 | 9 | 2 |
| C: Datenbankschema | A | 6 | 3 | 9 | 3 | 9 | 0 |
| D: Frontend-Build | B | 5 | 7 | 12 | 9 | 14 | 2 |
| E: Backend-Build | C | 5 | 9 | 14 | 9 | 14 | 0 |
| F: Integration | D, E | 3 | 14 | 17 | 14 | 17 | 0 |
| G: Test und Launch | F | 2 | 17 | 19 | 17 | 19 | 0 |
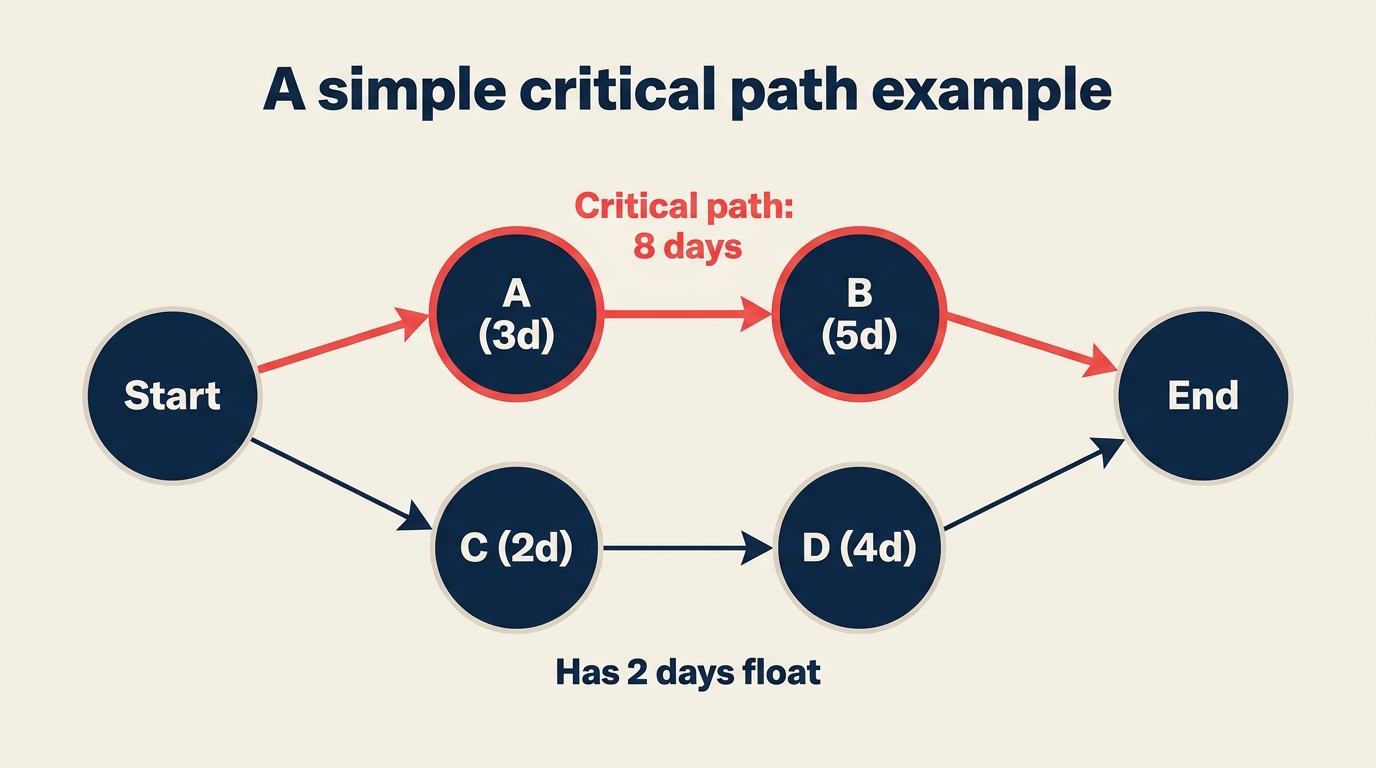
Kritischer Pfad: A - C - E - F - G (Gesamtdauer: 19 Tage, durchgehend null Float).
Aktivität B und D haben jeweils 2 Tage Float, was bedeutet, dass Sie das UI-Design um bis zu 2 Tage verzögern könnten, ohne das Launch-Datum zu verschieben. Aber wenn der Backend-Build (E) auch nur einen Tag ins Stocken gerät, verschiebt sich jede nachgelagerte Aktivität ebenfalls. Dort gehört Ihre Aufmerksamkeit hin.
CPM vs. PERT vs. Gantt-Chart
Diese drei Werkzeuge werden oft verwechselt, aber sie dienen unterschiedlichen Zwecken.
| Methode | Beste Eignung | Zeitbehandlung | Ausgabe |
|---|---|---|---|
| CPM | Projekte mit bekannten Aufgabendauern | Einzelne deterministische Schätzung | Kritischer Pfad, Float-Werte, Terminkompressionsmöglichkeiten |
| PERT | F&E oder neuartige Projekte mit ungewissen Dauern | Drei-Punkte-Schätzung (optimistisch, wahrscheinlichst, pessimistisch) | Probabilistische Fertigstellungstermine, Erwartungsdauer |
| Gantt-Chart | Visuelle Kommunikation eines Terminplans | Kalenderbasiertes Balkendiagramm | Zeitplanansicht, Ressourcenzuweisungen, Meilensteinmarkierungen |
CPM und PERT ergänzen sich gut: Führen Sie PERT zuerst durch, wenn Dauern ungewiss sind, und übergeben Sie die resultierenden Schätzungen dann an CPM, um den kritischen Pfad zu finden. Ein Gantt-Chart ist oft die abschließende Kommunikationsschicht auf beiden.
Wenn Sie einem strukturierten Auslieferungsansatz folgen, hilft es, CPM mit Ihrer Waterfall-Methodik oder Ihrem Kanban-Board zu verknüpfen, um den Terminplan mit der laufenden Arbeit verbunden zu halten.
Verkürzung durch Ressourceneinsatz und Fast-Tracking: So komprimieren Sie den kritischen Pfad
Wenn der kritische Pfad zu lang ist, haben Sie zwei Hauptoptionen.
Verkürzung durch Ressourceneinsatz
Verkürzung durch Ressourceneinsatz bedeutet, Ressourcen zu kritischen Pfadaktivitäten hinzuzufügen, um deren Dauer zu kürzen, zum Beispiel mehr Entwickler für einen Build oder eine zusätzliche Schicht in einer Fertigung. Das erhöht fast immer die Kosten, daher ist der Standardansatz, die Aktivität zu verkürzen, die am meisten Zeit pro ausgegebenen Euro einspart, und dann den kritischen Pfad neu zu prüfen (er kann sich nach der Verkürzung verschieben).
Risiko: Kostenüberschreitungen. Eine Aktivität lässt sich nur so weit komprimieren, bis das Gesetz des abnehmenden Grenznutzens greift.
Fast-Tracking
Fast-Tracking bedeutet, Aktivitäten parallel durchzuführen, die ursprünglich in Sequenz geplant waren, zum Beispiel den Backend-Build zu starten, bevor das Datenbankschema vollständig freigegeben ist. Das kann erheblich Zeit sparen, ohne zusätzliches Budget.
Risiko: Nacharbeit. Wenn sich die Vorgängeraktivität ändert, nachdem ihr Nachfolger bereits begonnen hat, muss möglicherweise Arbeit wiederholt werden. Fast-Tracking funktioniert am besten, wenn die Überschneidung gering und die Abhängigkeit lose ist.
Beide Techniken erfordern, dass Sie die Vorwärts- und Rückwärtsrechnung nach den Änderungen neu durchführen, da sich der kritische Pfad verschieben wird.
Vorteile und Einschränkungen von CPM
Vorteile
- Zeigt die tatsächliche Mindestdauer des Projekts auf, bevor die Arbeit beginnt
- Identifiziert, wo Management-Aufmerksamkeit konzentriert werden soll (Aktivitäten mit null Float)
- Schafft eine Grundlage für Abwägungsentscheidungen: Kosten vs. Zeit, Risiko vs. Geschwindigkeit
- Integriert sich natürlich in die Ressourcennivellierung und Geschäftsprozessmanagement-Frameworks
- Wird in den meisten Projektmanagement-Kompetenz-Frameworks einschließlich PMBOK und PRINCE2 unterstützt
Einschränkungen
- Setzt voraus, dass Aufgabendauern bekannt und fest sind, eine unsichere Annahme bei neuartigen Projekten
- Netzpläne werden bei großen Projekten (Hunderte oder Tausende von Aktivitäten) unübersichtlich
- Ignoriert standardmäßig Ressourcenbeschränkungen; ein separater Ressourcennivellierungsschritt ist erforderlich
- Float-Berechnungen können falsches Vertrauen erzeugen, wenn Schätzungen ungenau sind
- Bildet Unsicherheit schlecht ab: Verwenden Sie PERT zusammen mit CPM, wenn Dauern Schätzwerte sind
Häufig gestellte Fragen
Was ist der Unterschied zwischen CPM und PERT?
CPM verwendet eine einzelne feste Dauerschätzung für jede Aktivität und liefert einen deterministischen kritischen Pfad. PERT verwendet drei Schätzungen (optimistisch, wahrscheinlichst und pessimistisch) und liefert eine wahrscheinlichkeitsgewichtete Erwartungsdauer. CPM ist besser, wenn Sie ähnliche Arbeit zuvor gemacht haben; PERT ist besser, wenn Dauern tatsächlich ungewiss sind.
Kann ein Projekt mehr als einen kritischen Pfad haben?
Ja. Wenn zwei oder mehr Aktivitätsketten jeweils null Float haben und denselben Projektenddatum erreichen, sind sie alle kritische Pfade. Mehrere kritische Pfade erhöhen das Terminrisiko, weil jede Verzögerung in einer dieser Ketten den Abschluss verzögert. In diesem Fall priorisieren Manager Ressourcen oft, um zu verhindern, dass alle Ketten gleichzeitig ins Stocken geraten.
Ändert sich der kritische Pfad während eines Projekts?
Das kann passieren, und das geschieht oft. Wenn eine unkritische Aktivität so weit in Verzug gerät, dass sie ihren Float aufbraucht, wird sie kritisch. Wenn eine kritische Aktivität früher als geplant abgeschlossen wird, kann eine andere Kette zur neuen Engstelle werden. Best Practice ist es, den kritischen Pfad bei jedem Statusaktualisierungszyklus neu zu berechnen, besonders nach Umfangsänderungen oder Ressourcenstörungen.
Was ist Float und wie berechnet man ihn?
Float (auch Slack genannt) ist die Zeit, um die eine Aktivität verzögert werden kann, ohne das Enddatum des Projekts zu verschieben. Die Formel lautet: Float = LS - ES (gleichwertig: LF - EF). Ein Float von null bedeutet, die Aktivität liegt auf dem kritischen Pfad und hat keine Planungsflexibilität. Ein Float von 3 Tagen bedeutet, Sie könnten die Aktivität um bis zu 3 Tage später starten und das Projekt trotzdem pünktlich abschließen.
Welche Software berechnet den kritischen Pfad?
Die meisten Projektplanungs-Plattformen berechnen CPM automatisch, sobald Sie Aufgaben, Dauern und Abhängigkeiten eingeben. Gängige Optionen sind Microsoft Project, Primavera P6 (für große Engineering-Projekte), Smartsheet, TeamGantt und Rework. Open-Source-Tools wie ProjectLibre berechnen ebenfalls Float und markieren den kritischen Pfad. Tabellenkalkulationsbasiertes CPM ist möglich, aber aufwändig zu pflegen, wenn das Projekt wächst.
Den kritischen Pfad zu verstehen ist der erste Schritt; der nächste ist, ein System aufzubauen, um ihn kontinuierlich zu überwachen. Wenn die RACI-Matrix definiert, wer jede kritische Pfadaktivität verantwortet, und Ihr Tracking-Tool Float in Echtzeit neu berechnet, wechseln Sie von reaktiver Feuerwehr zu proaktivem Terminmanagement, und genau das führt dazu, dass Projekte pünktlich geliefert werden.

Senior Operations & Growth Strategist
On this page
- Was ist die Methode des kritischen Pfads (CPM)?
- Wichtige Fakten
- Schlüsselbegriffe
- Vorwärtsrechnung vs. Rückwärtsrechnung
- Vorwärtsrechnung (früheste Zeiten)
- Rückwärtsrechnung (späteste Zeiten)
- Float-Berechnung
- So finden Sie den kritischen Pfad in 6 Schritten
- Schritt 1: Aktivitäten und Dauern auflisten
- Schritt 2: Abhängigkeiten identifizieren
- Schritt 3: Den Netzplan zeichnen
- Schritt 4: Die Vorwärtsrechnung durchführen
- Schritt 5: Die Rückwärtsrechnung durchführen
- Schritt 6: Aktivitäten mit null Float identifizieren (der kritische Pfad)
- Durchgerechnetes Beispiel: 7-Aufgaben-Projekt
- CPM vs. PERT vs. Gantt-Chart
- Verkürzung durch Ressourceneinsatz und Fast-Tracking: So komprimieren Sie den kritischen Pfad
- Verkürzung durch Ressourceneinsatz
- Fast-Tracking
- Vorteile und Einschränkungen von CPM
- Vorteile
- Einschränkungen
- Häufig gestellte Fragen