Netzplan: So bilden Sie Projektaktivitäten ab
Turn this article into takeaways for your work.
Each assistant summarizes the article only for you and suggests best practices for your work.
Ein Netzplan gibt jeder Projektaktivität einen Platz in der Abfolge und zeigt genau, welche Aufgaben abgeschlossen sein müssen, bevor die nächsten beginnen können. Ohne ihn planen Sie anhand einer flachen Liste, ohne Einblick in die Kettenreaktionen, die Verzögerungen verursachen.
Projektmanager nutzen Netzpläne, um den kritischen Pfad zu finden, Zeitpläne zu verkürzen und den Umfang gegenüber Stakeholdern zu kommunizieren, die mehr als eine Tabellenkalkulation brauchen. Der Netzplan ersetzt kein Gantt-Diagramm, sondern ergänzt es: Beide zeigen eine unterschiedliche Ansicht desselben Plans.
Was ist ein Netzplan?
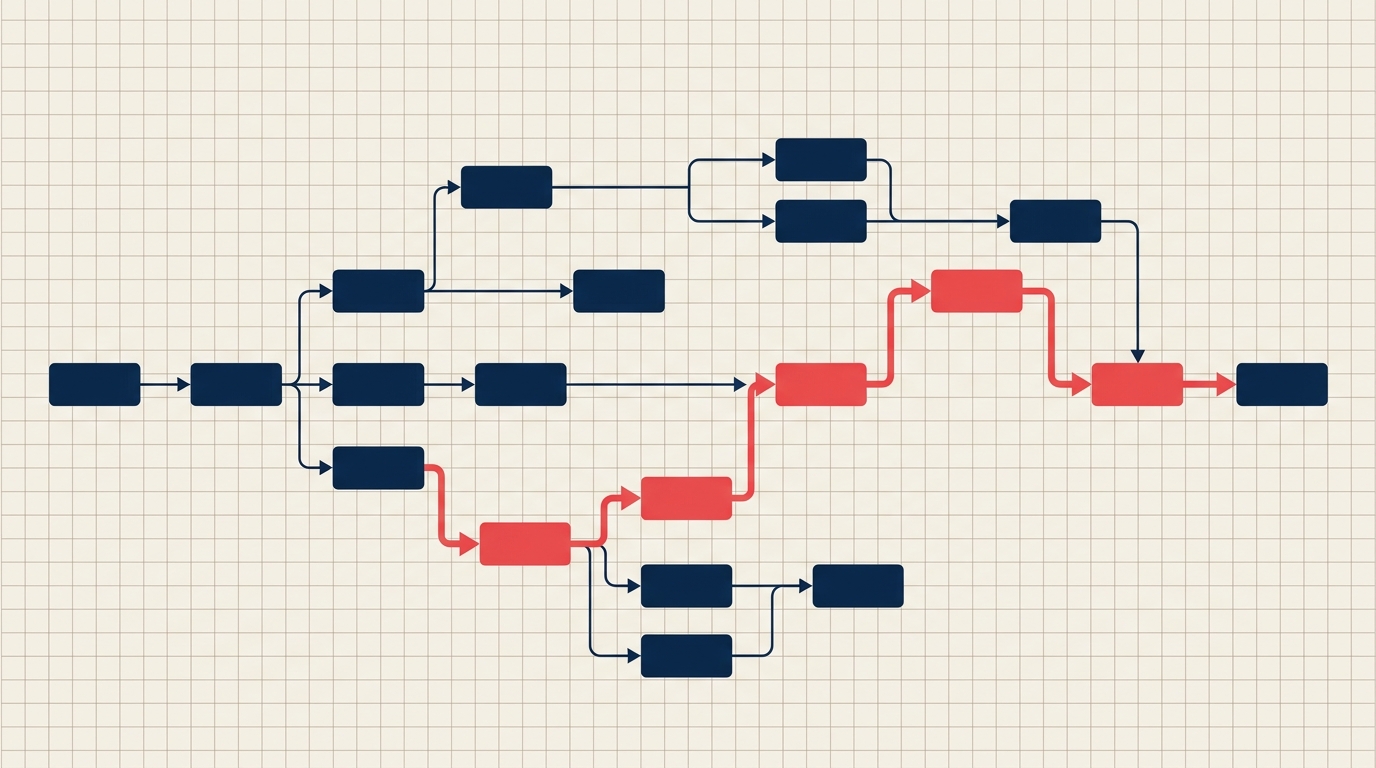
Ein Projektnetzplan ist eine visuelle Darstellung aller Projektaktivitäten und der Abhängigkeitsbeziehungen zwischen ihnen. Knoten stellen Aktivitäten (oder Meilensteine) dar, Pfeile stellen die Reihenfolge dar, in der diese Aktivitäten ablaufen müssen. Das Ergebnis ist ein gerichteter Graph vom Projektstart bis zum Projektabschluss.
Netzpläne bilden das Rückgrat zweier wichtiger Terminplanungsmethoden: der Methode des kritischen Pfads (CPM) und der Program Evaluation and Review Technique (PERT). Beide setzen voraus, dass ein korrekt sequenziertes Netzwerk vorliegt, bevor Dauerschätzungen oder Wahrscheinlichkeitsspannen angewendet werden können.
Key Facts
- Laut McKinsey werden nur 47 % der Projekte termingerecht abgeschlossen, was die Terminsteuerung zu einer der hartnäckigsten Herausforderungen im Projektmanagement macht.
- Bei jedem sechsten IT-Projekt kommt es zu einer Terminüberschreitung von 70 % oder mehr, oft weil die Abhängigkeitsketten nie vollständig abgebildet wurden.
- Projekte, die aktiv eine definierte Terminplanungsmethode wie CPM mit einem Netzplan einsetzen, schneiden durchgängig besser ab als solche, die sich allein auf listenbasierte Verfolgung verlassen. (PMI, Pulse of the Profession)
AON vs. AOA: Zwei Arten von Netzplänen
Es gibt zwei Formate zum Zeichnen von Projektnetzplänen. Zu wissen, welches Format Sie vor sich haben und welches Ihr Tool erzeugt, ist wichtig, weil sie sich unterschiedlich lesen.
Activity-on-Node (AON) platziert jede Aktivität innerhalb eines Knotens (Kasten). Pfeile zwischen Knoten zeigen ausschließlich Abhängigkeiten; der Pfeil selbst trägt keine weitere Bedeutung als "dies muss vor jenem kommen." AON ist das Format, das moderne Projektmanagement-Software verwendet und das die meisten Praktiker heute bei der Methode des kritischen Pfads anwenden.
Activity-on-Arrow (AOA) platziert Aktivitäten auf den Pfeilen, nicht in den Kästen. Die Knoten (Kreise) stellen Ereignisse dar, den Start oder Abschluss einer Aktivität. AOA ist das ältere Format, eng verbunden mit PERT-Diagrammen, und wird gelegentlich noch im Bauingenieurwesen verwendet.
| Merkmal | Activity-on-Node (AON) | Activity-on-Arrow (AOA) |
|---|---|---|
| Ort der Aktivität | Innerhalb des Knotens (Kasten) | Auf dem Pfeil |
| Bedeutung des Knotens | Eine Aktivität oder Aufgabe | Ein Ereignis (Start-/Endpunkt) |
| Scheinaktivitäten nötig? | Nein | Manchmal (um Abhängigkeiten ohne reale Aktivitäten darzustellen) |
| Übliche Anwendung | CPM, moderne PM-Software | PERT, Bau-/Tiefbauingenieurwesen |
| Lesbarkeit | Für die meisten Teams einfacher | Auf einen Blick schwerer zu lesen |
| Standard in Software-Tools | Ja | Selten |
Für die meisten Projekte ist AON heute die richtige Wahl. Es ist einfacher zu lesen, benötigt keine Scheinaktivitäten und wird von Tools wie MS Project, Asana und Smartsheet automatisch erzeugt.
Wenn Sie ein PERT-Diagramm für ein forschungslastiges Projekt mit unsicheren Dauern erstellen, stoßen Sie in älteren Referenzen möglicherweise auf AOA-Notation, doch AON funktioniert weiterhin.
Symbole und Begriffe im Netzplan
Bevor Sie einen Netzplan erstellen, machen Sie sich mit den grundlegenden Symbolen und Terminplanungsbegriffen vertraut. Diese tauchen in jeder Vorwärts- und Rückwärtsrechnung auf.
| Symbol/Begriff | Bedeutung |
|---|---|
| Knoten (Rechteck) | Eine einzelne Aktivität oder Aufgabe |
| Pfeil | Abhängigkeit: Die Aktivität am Anfang des Pfeils muss der Aktivität an der Spitze vorausgehen |
| Startknoten | Die erste Aktivität des Projekts (oder ein einzelner "Start"-Meilenstein) |
| Endknoten | Die letzte Aktivität des Projekts (oder ein einzelner "Ende"-Meilenstein) |
| FS (Ende-Anfang) | Aufgabe B kann erst beginnen, wenn Aufgabe A abgeschlossen ist. Häufigster Abhängigkeitstyp. |
| SS (Anfang-Anfang) | Aufgabe B kann erst beginnen, wenn Aufgabe A begonnen hat |
| FF (Ende-Ende) | Aufgabe B kann erst abgeschlossen werden, wenn Aufgabe A abgeschlossen ist |
| SF (Anfang-Ende) | Aufgabe B kann erst abgeschlossen werden, wenn Aufgabe A begonnen hat. Selten. |
| ES (Frühester Anfang) | Frühestmögliches Datum, an dem eine Aktivität beginnen kann |
| EF (Frühestes Ende) | Frühestmögliches Datum, an dem eine Aktivität enden kann (ES + Dauer) |
| LS (Spätester Anfang) | Spätestes Datum, an dem eine Aktivität beginnen kann, ohne das Projekt zu verzögern |
| LF (Spätestes Ende) | Spätestes Datum, an dem eine Aktivität enden kann, ohne das Projekt zu verzögern |
| Float/Slack | Zeitspanne, um die sich eine Aktivität verschieben kann, ohne das Enddatum zu beeinflussen (LF minus EF oder LS minus ES) |
| Kritischer Pfad | Der längste Pfad durch das Netzwerk; null Float bei jeder darin enthaltenen Aktivität |
Float ist die Kennzahl, die Ihnen sagt, wie viel Spielraum Sie haben. Aktivitäten mit null Float liegen auf dem kritischen Pfad. Jede Verzögerung dort wird zu einer Projektverzögerung.
So erstellen Sie einen Netzplan
Die Erstellung eines Netzplans ist ein fünfstufiger Prozess. Die Qualität des Plans hängt vollständig von der Qualität der Eingaben ab, die Sie sammeln, bevor Sie überhaupt zu zeichnen beginnen.
Schritt 1: Alle Aktivitäten auflisten
Beginnen Sie mit Ihrem Projektstrukturplan (PSP). Jedes Arbeitspaket, das einen Liefergegenstand erzeugt, wird zu einer Aktivität im Netzwerk. Weisen Sie jeder Aktivität eine kurze Bezeichnung zu (A, B, C oder einen Code wie PSP 1.1.1). Überspringen Sie keine Aktivitäten, nur weil sie offensichtlich erscheinen: Fehlende Knoten erzeugen falsche Abhängigkeitsketten.
Schritt 2: Abhängigkeiten definieren
Stellen Sie sich für jede Aktivität drei Fragen:
- Was muss abgeschlossen sein, bevor diese Aktivität beginnen kann?
- Was kann gleichzeitig beginnen?
- Was kann erst beginnen, wenn diese Aktivität abgeschlossen ist?
Dokumentieren Sie den Abhängigkeitstyp (FS, SS, FF, SF) für jede Beziehung. Die meisten realen Projekte sind zu 80 bis 90 % Ende-Anfang-Abhängigkeiten, aber komplexe Ingenieurs- oder Softwarearbeit hat oft parallele Anfang-Anfang-Ketten.
Schritt 3: Die Aktivitäten sequenzieren
Ordnen Sie die Aktivitäten basierend auf ihren Abhängigkeiten von links nach rechts an. Aktivitäten ohne Vorgänger stehen links (Projektstart). Aktivitäten ohne Nachfolger stehen rechts (Projektabschluss). Zeichnen Sie Pfeile, um sie zu verbinden. Jede Aktivität sollte mindestens einen eingehenden und einen ausgehenden Pfeil haben, außer dem Start- und Endknoten.
Prüfen Sie, dass keine zirkulären Abhängigkeiten bestehen: Wenn Aktivität A von Aktivität C abhängt und C von A, haben Sie eine Schleife, die eine Terminplanung unmöglich macht.
Schritt 4: Dauerschätzungen hinzufügen
Notieren Sie die geschätzte Dauer jeder Aktivität innerhalb oder neben ihrem Knoten. Für unsichere Dauern verwenden Sie die Drei-Punkt-Schätzung von PERT: optimistisch (O), wahrscheinlichst (M) und pessimistisch (P). Die PERT-Formel liefert einen gewichteten Durchschnitt: (O + 4M + P) / 6.
Für unkomplizierte Projekte mit zuverlässigen Schätzungen genügt eine einzelne deterministische Dauer pro Aktivität.
Schritt 5: Den kritischen Pfad berechnen
Führen Sie die Vorwärtsrechnung durch, um den frühesten Anfang und das früheste Ende jeder Aktivität zu ermitteln. Führen Sie dann die Rückwärtsrechnung durch, um den spätesten Anfang und das späteste Ende zu ermitteln. Berechnen Sie den Float für jede Aktivität. Der Pfad, auf dem jeder Float-Wert null ist, ist der kritische Pfad, und seine Gesamtdauer ist die minimale Fertigstellungszeit des Projekts.
Wie Sie dieses Ergebnis mit Ihrem Basisplan verknüpfen, erfahren Sie unter Projektplanung.
Beispiel für einen Netzplan
Hier ist ein einfaches Software-Release-Projekt mit sechs Aktivitäten.
| Aktivität | Beschreibung | Dauer (Tage) | Vorgänger |
|---|---|---|---|
| A | Anforderungen definieren | 3 | Keine |
| B | Architektur entwerfen | 5 | A |
| C | Kernmodul entwickeln | 8 | B |
| D | UI entwickeln | 6 | B |
| E | Integrationstests | 4 | C, D |
| F | In Produktion bereitstellen | 2 | E |
Vorwärtsrechnung (frühester Anfang/frühestes Ende):
- A: ES=0, EF=3
- B: ES=3, EF=8
- C: ES=8, EF=16
- D: ES=8, EF=14
- E: ES=16 (bestimmt durch C), EF=20
- F: ES=20, EF=22
Projektdauer: 22 Tage.
Rückwärtsrechnung (spätester Anfang/spätestes Ende, ausgehend vom EF von F=22):
- F: LF=22, LS=20
- E: LF=20, LS=16
- C: LF=16, LS=8
- D: LF=20, LS=14 (D hat 6 Tage Float: LS 14 minus ES 8 = 6)
- B: LF=8, LS=3
- A: LF=3, LS=0
Float-Berechnung:
| Aktivität | ES | EF | LS | LF | Float | Auf kritischem Pfad? |
|---|---|---|---|---|---|---|
| A | 0 | 3 | 0 | 3 | 0 | Ja |
| B | 3 | 8 | 3 | 8 | 0 | Ja |
| C | 8 | 16 | 8 | 16 | 0 | Ja |
| D | 8 | 14 | 14 | 20 | 6 | Nein |
| E | 16 | 20 | 16 | 20 | 0 | Ja |
| F | 20 | 22 | 20 | 22 | 0 | Ja |
Kritischer Pfad: A → B → C → E → F (22 Tage). Aktivität D hat 6 Tage Float, das heißt, die UI-Entwicklung kann bis zu 6 Tage später beginnen, ohne den Release zu verzögern.
Netzplan vs. Gantt-Diagramm
Diese beiden Tools lösen unterschiedliche Probleme und funktionieren am besten gemeinsam.
| Dimension | Netzplan | Gantt-Diagramm |
|---|---|---|
| Hauptzweck | Aktivitätsreihenfolge und Abhängigkeiten zeigen | Zeitleiste und Ressourcenzuweisung zeigen |
| Visuelles Format | Knoten-und-Pfeil-Flussdiagramm | Horizontales Balkendiagramm auf einem Kalender |
| Am besten geeignet für | Kritischen Pfad finden, Float analysieren | Zeitplan gegenüber Stakeholdern kommunizieren |
| Sichtbarkeit von Abhängigkeiten | Explizit: Kern des Diagramms | Optional (Abhängigkeitslinien, oft unübersichtlich) |
| Kalenderdaten | Nicht erforderlich | Zentral für die Ansicht |
| Funktioniert bei Projektgröße | Klein bis sehr groß (kann komplex werden) | Klein bis mittel (groß = visuelles Rauschen) |
| Wann erstellen | Vor der Finalisierung des Zeitplans | Nachdem das Netzwerk validiert wurde |
Erstellen Sie zuerst den Netzplan. Sobald Sie sicher sind, dass Reihenfolge und Dauern korrekt sind, übertragen Sie das Ergebnis in ein Gantt-Diagramm für die tägliche Verfolgung und die Berichterstattung an Stakeholder. Das Gantt-Diagramm zeigt das Wann; der Netzplan zeigt das Warum.
Häufige Fehler
Das Gespräch über Abhängigkeiten überspringen. Viele Teams zeichnen Netzpläne erst, nachdem der Zeitplan bereits feststeht, wodurch der Plan zur Dekoration statt zum Planungswerkzeug wird. Nutzen Sie ihn in der Phase der Abhängigkeitsdefinition, bevor die Dauern festgelegt sind.
Jeden Pfad als kritisch behandeln. Wenn Teams ein komplexes Netzwerk sehen, managen sie manchmal jede Aktivität mit derselben Dringlichkeit. Float existiert aus gutem Grund: Lassen Sie unkritische Aktivitäten kleinere Verzögerungen abfedern, während Sie Ihre Aufmerksamkeit auf den tatsächlichen kritischen Pfad richten.
Zusammenführungsaktivitäten übersehen. Eine Aktivität mit mehreren Vorgängern (wie Aktivität E im obigen Beispiel) ist ein Zusammenführungspunkt. Manager unterschätzen das Risiko an Zusammenführungspunkten oft, weil sie nur den kritischen Vorgänger beobachten und die anderen ignorieren. Eine Verzögerung bei jedem Vorgänger verzögert die Zusammenführung.
Den falschen Abhängigkeitstyp verwenden. Wenn Sie standardmäßig alles auf Ende-Anfang setzen, obwohl sich die Arbeit tatsächlich überschneidet, wird Ihr Zeitplan länger als nötig. Prüfen Sie SS- und FF-Abhängigkeiten aktiv; dort verbergen sich Möglichkeiten zur Zeitplanverkürzung.
Vergessen, den Plan zu aktualisieren. Ein Netzplan, der zu Projektbeginn erstellt und nie wieder angefasst wird, ist schlimmer als nutzlos: Er vermittelt trügerische Sicherheit. Aktualisieren Sie ihn, wenn sich der Umfang ändert, wenn Aktivitäten hinzukommen oder wenn sich eine Vorgänger-Beziehung als falsch herausstellt.
Häufig gestellte Fragen
Was ist der Unterschied zwischen einem Netzplan und einem PERT-Diagramm?
Ein PERT-Diagramm ist eine spezifische Art von Projektnetzplan, der Activity-on-Arrow-Notation (AOA) und Drei-Punkt-Dauerschätzungen (optimistisch, wahrscheinlichst, pessimistisch) verwendet, um mit Terminunsicherheit umzugehen. Ein Netzplan ist der übergeordnete Begriff: Er umfasst sowohl AON- als auch AOA-Formate und kann sowohl Einzelpunkt- als auch Drei-Punkt-Schätzungen verwenden. Jedes PERT-Diagramm ist ein Netzplan, aber nicht jeder Netzplan ist ein PERT-Diagramm.
Wie viele Aktivitäten sollte ein Projektnetzplan haben?
Es gibt keine feste Regel, aber Pläne mit mehr als 50 bis 60 Aktivitäten werden auf einer einzelnen Seite schwer lesbar. Teilen Sie bei großen Projekten das Gesamtnetzwerk nach Phase oder Arbeitspaket in Teilnetzwerke auf und verbinden Sie diese dann an wichtigen Meilensteinen. Der Projektstrukturplan ist der natürliche Weg, um Aktivitäten zu diesem Zweck zu gruppieren.
Kann ein Projekt mehr als einen kritischen Pfad haben?
Ja. Wenn zwei oder mehr Pfade durch das Netzwerk dieselbe Gesamtdauer haben (beide gleich der minimalen Fertigstellungszeit des Projekts), sind beide kritisch. Mehrere kritische Pfade bedeuten ein höheres Terminrisiko: Eine Verzögerung an beliebiger Stelle auf einem der Pfade verzögert das Projekt.
Welche Software erzeugt Netzpläne automatisch?
MS Project, Primavera P6, Smartsheet und ProjectLibre erzeugen alle Netzpläne aus Aufgabenlisten und Abhängigkeitsdaten. Lucidchart und Miro unterstützen das manuelle Zeichnen. Die meisten Projektmanagement-Plattformen (Asana, Monday.com, Wrike) zeigen Abhängigkeitsansichten, die einem vereinfachten AON-Netzwerk nahekommen.
Was passiert mit dem kritischen Pfad, wenn ein Änderungsauftrag hinzukommt?
Neue Aktivitäten verschieben Float-Werte im gesamten Netzwerk. Ein Änderungsauftrag, der Dauer zu einem zuvor unkritischen Pfad hinzufügt, kann diesen Pfad kritisch machen oder einen völlig neuen kritischen Pfad erzeugen. Berechnen Sie Vorwärts- und Rückwärtsrechnung nach jeder Umfangsänderung neu, die Aktivitäten hinzufügt oder entfernt oder Abhängigkeitsbeziehungen ändert.
Related reading
- Methode des kritischen Pfads: wie man CPM aus einem Netzplan berechnet
- Was ist ein PERT-Diagramm?: probabilistische Terminplanung mit Drei-Punkt-Schätzungen
- Was ist ein Gantt-Diagramm?: die Zeitleistenansicht, die auf Ihren Netzplan folgt
- Projektstrukturplan: Aufbau der Aktivitätsliste, von der Ihr Netzwerk abhängt
- Projektplanung: Verknüpfung des Netzwerks mit einem vollständigen Projektbasisplan
Ein Netzplan ist der Ort, an dem ein Projektzeitplan tatsächlich entsteht. Das Gantt-Diagramm und die Statusberichte folgen danach, aber die Abhängigkeitslogik, die diese Dokumente verlässlich macht, liegt hier: in der Knoten-und-Pfeil-Karte, die Sie zeichnen, bevor die erste Aufgabe beginnt.

Senior Operations & Growth Strategist
On this page
- Was ist ein Netzplan?
- AON vs. AOA: Zwei Arten von Netzplänen
- Symbole und Begriffe im Netzplan
- So erstellen Sie einen Netzplan
- Schritt 1: Alle Aktivitäten auflisten
- Schritt 2: Abhängigkeiten definieren
- Schritt 3: Die Aktivitäten sequenzieren
- Schritt 4: Dauerschätzungen hinzufügen
- Schritt 5: Den kritischen Pfad berechnen
- Beispiel für einen Netzplan
- Netzplan vs. Gantt-Diagramm
- Häufige Fehler
- Häufig gestellte Fragen
- Related reading