Três Horizontes de Crescimento: O Modelo da McKinsey Explicado

Turn this article into takeaways for your work.
Each assistant summarizes the article only for you and suggests best practices for your work.
Os três horizontes de crescimento é um framework estratégico que ajuda as organizações a gerir o negócio central no presente enquanto constroem, de forma deliberada, os negócios que o substituirão no futuro. Se sua equipe de liderança continua destinando cada real para as operações de curto prazo, este modelo oferece um argumento estruturado de por que isso é um caminho lento para perder relevância.
O que é o modelo dos três horizontes de crescimento?
O modelo dos três horizontes de crescimento é um framework de gestão de portfólio que divide as atividades de uma empresa em três horizontes temporais simultâneos, cada um exigindo uma mentalidade de gestão, uma lógica de investimento e uma métrica de sucesso distintas.
Os consultores Mehrdad Baghai, Stephen Coley e David White introduziram o modelo em seu livro de 1999, The Alchemy of Growth, publicado pela McKinsey. O insight central é simples, mas poderoso: empresas bem geridas não escolhem entre proteger a receita existente e construir novos negócios. Elas fazem os dois ao mesmo tempo, em três horizontes claramente definidos.
Dados Relevantes
- A regra 70/20/10, popularizada pelo Google, sugere alocar aproximadamente 70% dos recursos de inovação para o negócio central (H1), 20% para oportunidades adjacentes (H2) e 10% para apostas transformacionais (H3). O Google atribuiu seu crescimento sustentado a essa divisão. (Google, 2011; Harvard Business Review, 2012)
- Uma pesquisa da McKinsey de 2023 revelou que empresas que equilibram efetivamente os três horizontes geraram o dobro do retorno total para os acionistas ao longo de 10 anos em comparação com concorrentes focados principalmente em atividades do H1.
- A Pesquisa Global de Inovação da PwC (2023) constatou que 61% dos executivos dizem que a maior fraqueza de inovação de sua organização é não investir suficientemente em apostas de longo prazo (H3) porque a pressão de curto prazo vence consistentemente as batalhas orçamentárias.
Os três horizontes explicados
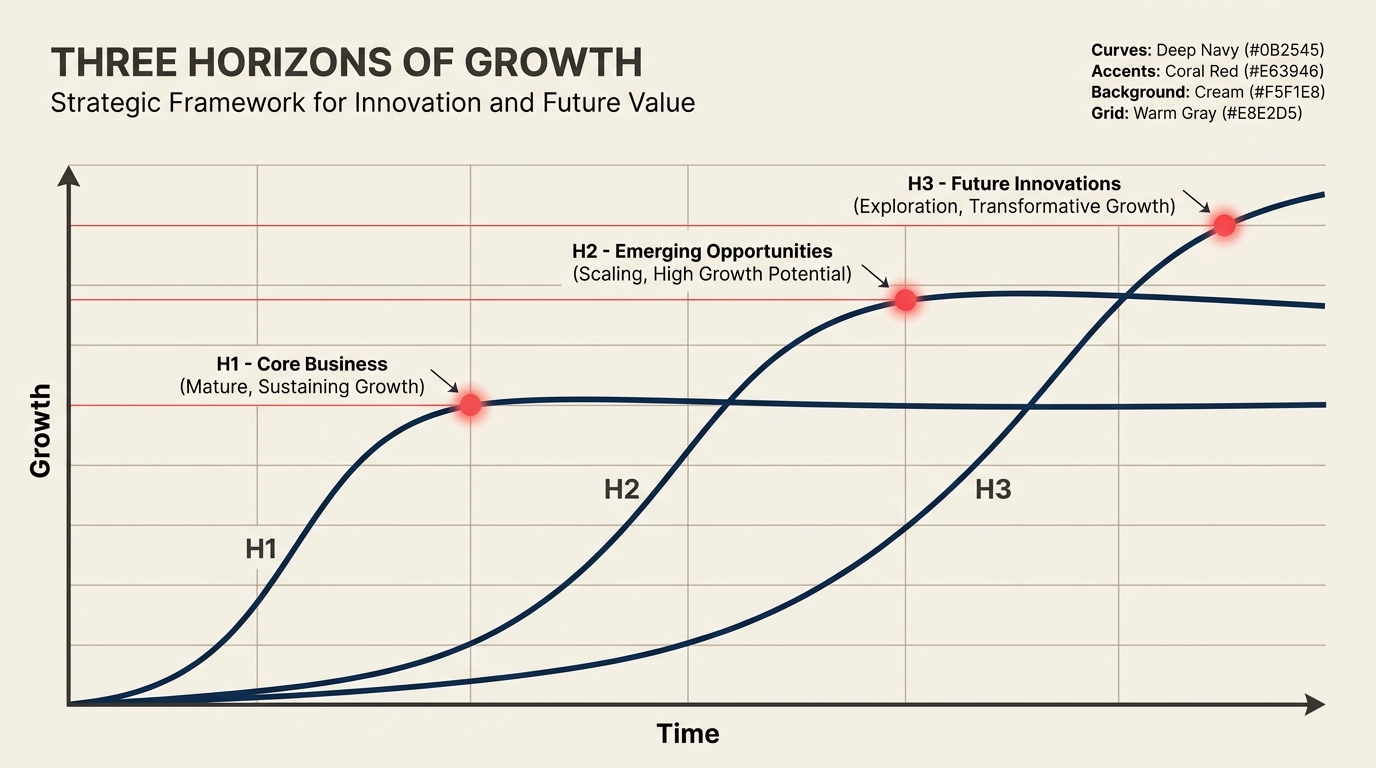
Pense nos três horizontes como três curvas de crescimento sobrepostas em paralelo, não como uma corrida de revezamento sequencial. Cada horizonte existe simultaneamente dentro da organização.
| Horizonte | Foco | Prazo típico | Exemplo | Métrica principal |
|---|---|---|---|---|
| H1: Defender e expandir o núcleo | Proteger e otimizar as unidades de negócio existentes e rentáveis | 0 a 1 ano | Uma empresa SaaS melhorando a retenção em seu produto principal | Receita, EBITDA, NPS |
| H2: Construir negócios emergentes | Escalar apostas que já demonstraram tração inicial | 2 a 3 anos | A mesma empresa SaaS expandindo para um novo vertical validado em pilotos | Taxa de aquisição de clientes, taxa de crescimento de receita |
| H3: Criar opções viáveis para o futuro | Explorar novas áreas de crescimento genuínas antes de serem necessárias | 3 a 7 anos | A mesma empresa incubando um produto nativo de IA com uma equipe pequena | Valor das opções, marcos de aprendizado, métricas de protótipo |
Horizonte 1: Defender e expandir o núcleo
O H1 é onde quase toda a receita de curto prazo reside. O trabalho aqui é proteger as margens, atender bem os clientes existentes e extrair eficiência dos processos comprovados. Mas "defender e expandir" não significa estagnar. As equipes do H1 ainda devem buscar melhorias incrementais: onboarding mais rápido, melhor suporte, atualizações modestas de funcionalidades. O risco no H1 é tratá-lo como o único horizonte que vale a pena financiar.
Horizonte 2: Construir negócios emergentes
O H2 é onde os experimentos anteriores do H3 que demonstraram sinal real recebem recursos adequados. São negócios que já têm alguma prova: clientes iniciais, um protótipo funcional ou uma premissa de mercado validada. O desafio aqui é aplicar estrutura suficiente para escalar sem sufocar a iniciativa com as normas de gestão do H1. As equipes do H2 precisam de KPIs diferentes, perfis de contratação diferentes e, muitas vezes, um P&L separado.
Horizonte 3: Criar opções viáveis para o futuro
O H3 não é um laboratório de fantasia isolado. É um portfólio deliberado de opções em estágio inicial que dão ao negócio o direito de jogar em mercados futuros. A maioria dos experimentos do H3 vai falhar. Isso é esperado. O objetivo é gerar tentativas suficientes para que dois ou três sobrevivam e se tornem H2 em três a cinco anos. Os orçamentos do H3 são pequenos, as equipes são enxutas e o sucesso significa aprender rápido, não escalar.
Como alocar recursos entre os horizontes
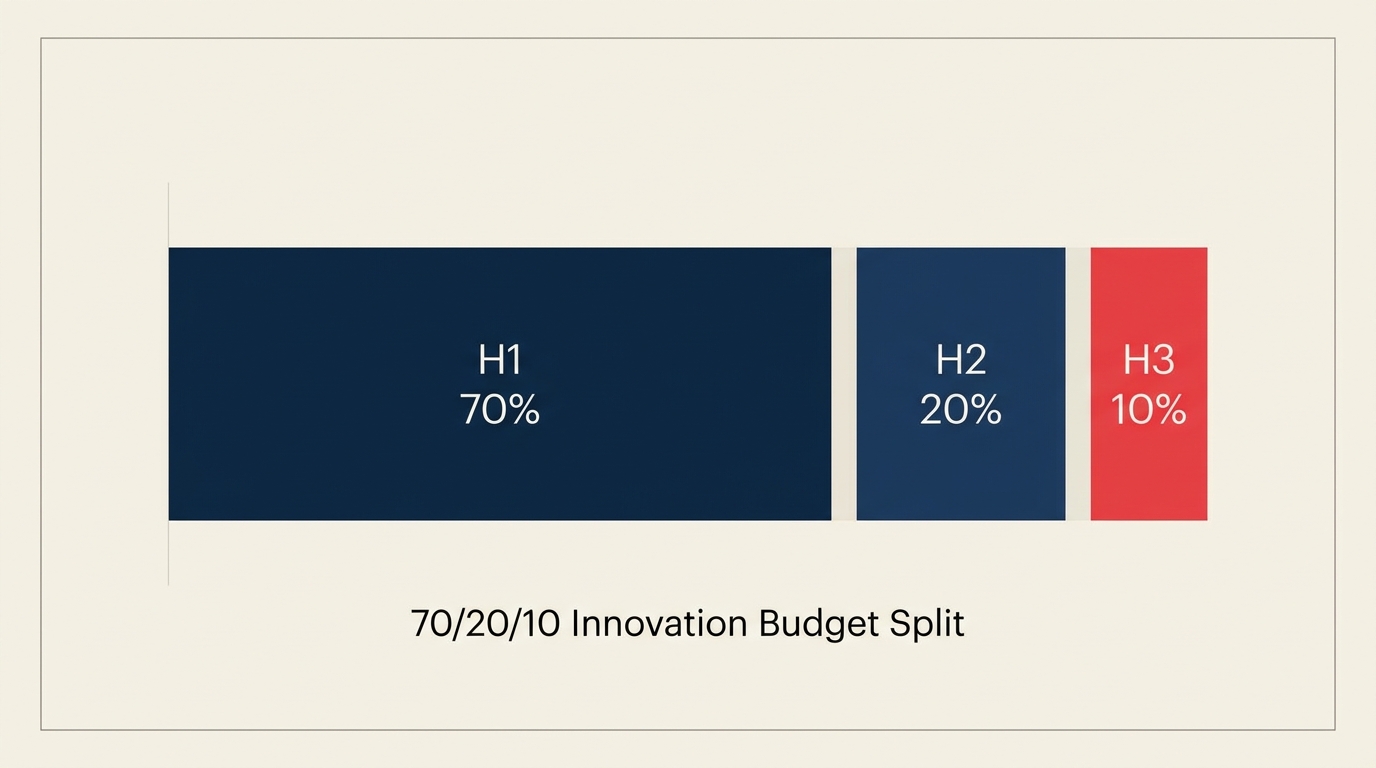
O benchmark de alocação mais comum é a divisão 70/20/10: 70% dos recursos de inovação para H1, 20% para H2 e 10% para H3. O Google tornou isso famoso, mas a proporção certa depende do ritmo de mudança do seu setor e da sua posição competitiva atual.
| Situação da empresa | Divisão H1/H2/H3 sugerida | Raciocínio |
|---|---|---|
| Mercado maduro, margens estáveis | 75/20/5 | O negócio central precisa de proteção; a transformação é menos urgente |
| Mercado em movimento rápido, forte fluxo de caixa | 60/25/15 | O risco de disrupção é alto; apostas mais pesadas em opções futuras são justificadas |
| Startup ou estágio de crescimento inicial | 40/40/20 | O núcleo ainda está sendo construído; opções futuras precisam ser semeadas cedo |
| Núcleo em declínio, pivô urgente necessário | 50/30/20 | Reequilibrar em direção ao H2/H3 é sobrevivência, não escolha |
A armadilha comum é deixar o H1 absorver recursos destinados ao H2 e H3 durante qualquer pressão financeira de curto prazo. Isso é racional no trimestre. Mas empresas que consistentemente cortam H2 e H3 em períodos de baixa se encontram com um núcleo saudável e sem pipeline de negócios futuros quando o mercado eventualmente muda. A BCG Matrix pode ajudá-lo a identificar quais partes do portfólio H1 são Cash Cows versus Dogs, liberando capital que você pode realocar para horizontes mais longos.
Um segundo erro comum é tratar H2 e H3 com ferramentas de gestão do H1. Aplicar metas de receita trimestrais a um experimento H3 o mata antes que possa aprender. Cada horizonte precisa de seus próprios critérios de sucesso.
Três horizontes versus outros frameworks de crescimento
| Framework | Questão central | Foco temporal | Melhor usado para |
|---|---|---|---|
| Três horizontes de crescimento | Como crescemos em todos os horizontes temporais simultaneamente? | Curto, médio e longo prazo em paralelo | Planejamento de portfólio, alocação de investimento em inovação |
| Matriz de Ansoff | Para onde devemos direcionar nossa próxima aposta de crescimento? | Único movimento de crescimento, tipicamente 1 a 3 anos | Escolher uma direção de crescimento (produto versus mercado) |
| BCG Matrix | Como devemos alocar capital entre os produtos existentes? | Snapshot do portfólio atual | Racionalizar um mix existente de produto ou unidade de negócio |
O modelo dos três horizontes é mais adequado quando você precisa de uma visão de portfólio de longo alcance entre os estágios de negócio. A Matriz de Ansoff é mais útil quando você está debatendo uma única escolha direcional: novo mercado, novo produto ou ambos. A BCG Matrix ajuda a otimizar o que você já tem, em vez de planejar o que construir a seguir. A maioria das equipes de liderança usa os três em sequência: Ansoff para definir a direção, BCG para triar o portfólio existente e os três horizontes para enquadrar a história completa de investimento para o conselho.
Para a execução, combine os três horizontes com seu framework de OKR. Os OKRs do H1 focam em desempenho; os OKRs do H2 focam em marcos de tração; os OKRs do H3 focam em resultados de aprendizado.
Benefícios e críticas
Benefícios
- Dá à liderança uma linguagem compartilhada para falar sobre operações de curto prazo e apostas de longo prazo sem recorrer ao argumento de que "não podemos nos dar ao luxo de inovar agora".
- Previne o modo de falha comum de tratar cada unidade de negócio com a mesma lógica de gestão e as mesmas métricas de sucesso.
- Força o conselho a financiar explicitamente o H2 e o H3, em vez de deixá-los sobreviver com o que o H1 não consome.
- Funciona no nível corporativo (alocação de capital entre unidades de negócio) e no nível da unidade de negócio (alocação de orçamento entre linhas de produto).
- Combina perfeitamente com o planejamento de cenários para testar as premissas do H3 em diferentes futuros.
Críticas
- Os horizontes temporais fixos podem enganar. O modelo original assume que o H3 se desenvolve ao longo de cinco a sete anos. Em mercados de software, a disrupção competitiva pode comprimir isso para 18 meses. Um framework construído para conglomerados industriais nem sempre se traduz para negócios digitais.
- O modelo descreve categorias de investimento, mas oferece orientação limitada sobre como escolher quais apostas específicas do H2 ou H3 financiar. Você ainda precisa de critérios para escolher experimentos.
- A divisão 70/20/10 é amplamente citada, mas raramente validada para qualquer setor específico. Aplicá-la mecanicamente sem calibrar ao seu ambiente competitivo é um erro.
- Alguns críticos argumentam que o modelo pode criar silos burocráticos: "equipes H3" muito protegidas do feedback do mercado porque são orientadas a não se preocupar com receita ainda.
- Ele não aborda as lacunas de capacidade organizacional que frequentemente bloqueiam o sucesso do H2 e do H3: diferentes perfis de talento, governança diferente, diferente apetite por risco. O framework McKinsey 7S é um complemento útil para diagnosticar essas barreiras estruturais.
Como aplicar o modelo dos três horizontes
Etapa 1: Audite seu portfólio atual
Mapeie cada iniciativa, produto e unidade de negócio significativa para um dos três horizontes. Seja honesto sobre de onde a receita realmente vem hoje. A maioria das empresas descobre que tem 90% ou mais de suas atividades no H1, um pequeno conjunto de iniciativas que provavelmente pertencem ao H2 e quase nada no H3.
Etapa 2: Defina metas de investimento explícitas para cada horizonte
Não deixe a alocação orçamentária acontecer por padrão. Use o ponto de partida 70/20/10, calibre-o para a velocidade do seu setor e, em seguida, tome uma decisão explícita no nível do conselho. Coloque por escrito. O ato de se comprometer com uma alocação H2/H3 é mais importante do que as porcentagens exatas.
Etapa 3: Aplique regras de gestão diferentes a cada horizonte
O H1 usa métricas operacionais padrão: receita, margem, churn, NPS. O H2 usa métricas de crescimento e tração: custo de aquisição de clientes, sinais de product-market fit, velocidade de crescimento de receita. O H3 usa métricas de aprendizado: experimentos realizados, premissas validadas, protótipos lançados. Aplicar métricas do H1 ao H3 é a forma mais rápida de matá-lo. O balanced scorecard é uma ferramenta útil para construir a camada de medição correta para cada horizonte.
Etapa 4: Crie governança distinta para H2 e H3
As equipes do H2 e do H3 frequentemente precisam de ciclos orçamentários separados, linhas de reporte diferentes e mais autonomia do negócio central. Sem proteção de governança explícita, o H1 absorverá seus recursos sempre que as metas trimestrais estiverem sob pressão. Considere um comitê de inovação dedicado que seja dono das decisões de H2/H3 e se reporte diretamente ao CEO ou ao conselho.
Etapa 5: Construa um pipeline de experimentos H3
O H3 não é uma única grande aposta. É um portfólio de apostas pequenas. Defina um número mínimo de experimentos H3 ativos a qualquer momento (cinco a dez é um intervalo inicial razoável para empresas de médio porte). Acompanhe-os com objetivos de aprendizado, não com metas de receita. Revise trimestralmente. Promova os que mostram sinal para H2 e encerre os demais de forma limpa. O value proposition canvas é uma boa ferramenta para testar hipóteses H3 antes de comprometer recursos significativos.
Exemplo dos três horizontes
Este exemplo prático mostra como uma empresa de software de workflow B2B pode mapear suas iniciativas atuais e planejadas nos três horizontes.
| Iniciativa | Horizonte | Investimento atual | Métrica de sucesso | Notas |
|---|---|---|---|---|
| Produto de workflow principal para PMEs | H1 | 65% do orçamento de engenharia | Receita recorrente mensal, taxa de churn | Lucrativo; principal motor de caixa |
| Expansão Enterprise (novo segmento) | H1 | 10% do orçamento de engenharia | ARR Enterprise, receita de expansão | Adjacente ao núcleo, usando produto existente |
| Automação de workflow para mercado médio | H2 | 15% do orçamento de engenharia | Taxa de aquisição de novos clientes, tempo para valor | 12 meses de pilotos concluídos; escalando agora |
| Produto de inteligência de processos nativo de IA | H2 | 5% do orçamento de engenharia | Retenção de primeiros usuários, profundidade de uso do produto | Pré-receita; primeiros 50 design partners assinados |
| Camada de conformidade incorporada (nova categoria) | H3 | 3% do orçamento de engenharia | Problema regulatório validado, 3 pilotos pagantes | Equipe pequena; explorando premissas de mercado |
| Construtor sem código para mercados verticais | H3 | 2% do orçamento de engenharia | Segmento de clientes distinto encontrado, 1 cliente de referência | Fase de ideia; testando posicionamento e demanda |
Neste exemplo, a empresa aloca aproximadamente 75% para H1, 20% para H2 e 5% para H3. A próxima revisão estratégica deve focar em se o H3 está subfinanciado, dado o quão rapidamente a IA está mudando o cenário competitivo.
Perguntas frequentes
O que é o modelo dos três horizontes de crescimento?
Os três horizontes de crescimento é um framework de gestão de portfólio desenvolvido pelos consultores da McKinsey Baghai, Coley e White em seu livro de 1999, The Alchemy of Growth. Ele divide o investimento organizacional em três horizontes temporais paralelos: H1 (defender e expandir o negócio central), H2 (construir negócios emergentes com tração inicial comprovada) e H3 (criar opções viáveis para o crescimento futuro). O argumento central do modelo é que as empresas devem gerenciar os três simultaneamente, em vez de tratá-los como fases sequenciais.
Qual é a regra 70/20/10 no modelo dos três horizontes?
A regra 70/20/10 é uma heurística de alocação de recursos que sugere direcionar 70% dos recursos de inovação para H1 (negócio central), 20% para H2 (negócios emergentes) e 10% para H3 (opções futuras). O Google popularizou a divisão em 2011 como parte de sua filosofia pública de inovação. As porcentagens são um ponto de partida, não uma prescrição fixa. Empresas em mercados de rápida evolução podem deslocar mais para H2 e H3; empresas com negócios centrais dominantes, mas ameaçados, podem precisar proteger o H1 de forma mais agressiva.
Como os três horizontes diferem da Matriz de Ansoff?
A Matriz de Ansoff ajuda você a escolher uma única direção de crescimento: mais fundo nos mercados existentes, em novos mercados, com novos produtos ou ambos (diversificação). O modelo dos três horizontes é uma ferramenta de portfólio que enquadra como você aloca recursos entre múltiplas apostas de crescimento acontecendo simultaneamente em diferentes estágios de maturidade. Use Ansoff para escolher uma direção; use os três horizontes para equilibrar o investimento entre todas as direções que você já está perseguindo.
O modelo dos três horizontes ainda é relevante em mercados de rápida evolução?
A lógica central do modelo, executar H1, H2 e H3 simultaneamente, permanece sólida. Mas os prazos fixos precisam de calibração. Em mercados de software e impulsionados por IA, o que parece um experimento H3 pode se tornar uma ameaça competitiva H1 em 18 meses, e não em sete anos. As equipes que trabalham em ambientes de alta velocidade devem encurtar as janelas de horizonte e executar mais experimentos H3 em paralelo para se manterem à frente da compressão. Combinar o modelo com o planejamento de cenários ajuda a testar quais apostas H3 priorizar.
Qual é o maior erro que as empresas cometem com este framework?
A falha mais consistente é deixar o H1 absorver os orçamentos do H2 e do H3 sob pressão financeira de curto prazo. Isso parece racional no momento, mas cria uma seca no pipeline três a cinco anos depois. O segundo erro mais comum é aplicar a lógica de gestão do H1 (metas de receita trimestrais, governança estabelecida) às iniciativas do H2 e H3 antes que estejam prontas para isso. Ambos os erros sufocam o crescimento futuro de maneiras que não aparecem na demonstração de resultados até que seja tarde demais para corrigir rapidamente.
O crescimento estratégico exige correr três corridas ao mesmo tempo, em três velocidades diferentes, com três regras diferentes. O modelo dos três horizontes não torna isso fácil. Mas dá às equipes de liderança um mapa compartilhado para que pelo menos possam concordar em que corrida cada iniciativa está e como é a vitória para cada uma. Combine-o com o framework VRIO para verificar se suas apostas H2 e H3 estão construídas sobre capacidades que os concorrentes não conseguem copiar facilmente.
Leitura relacionada
- Matriz de Ansoff: As 4 Estratégias de Crescimento Explicadas
- BCG Matrix: Como Usar a Matriz de Crescimento-Participação
- Framework de OKR: Definindo Metas que Geram Resultados
- Balanced Scorecard: Um Sistema de Medição Estratégica
- McKinsey 7S Framework: Alinhando Sua Organização
- Planejamento de Cenários: Preparando-se para Futuros Incertos
- Framework VRIO: Construindo Vantagem Competitiva Sustentável
- Value Proposition Canvas: Desenhando Produtos que os Clientes Querem

Senior Operations & Growth Strategist
On this page
- O que é o modelo dos três horizontes de crescimento?
- Os três horizontes explicados
- Horizonte 1: Defender e expandir o núcleo
- Horizonte 2: Construir negócios emergentes
- Horizonte 3: Criar opções viáveis para o futuro
- Como alocar recursos entre os horizontes
- Três horizontes versus outros frameworks de crescimento
- Benefícios e críticas
- Como aplicar o modelo dos três horizontes
- Etapa 1: Audite seu portfólio atual
- Etapa 2: Defina metas de investimento explícitas para cada horizonte
- Etapa 3: Aplique regras de gestão diferentes a cada horizonte
- Etapa 4: Crie governança distinta para H2 e H3
- Etapa 5: Construa um pipeline de experimentos H3
- Exemplo dos três horizontes
- Perguntas frequentes
- Leitura relacionada