Matriz de Ansoff: As 4 Estratégias de Crescimento Explicadas
Turn this article into takeaways for your work.
Each assistant summarizes the article only for you and suggests best practices for your work.
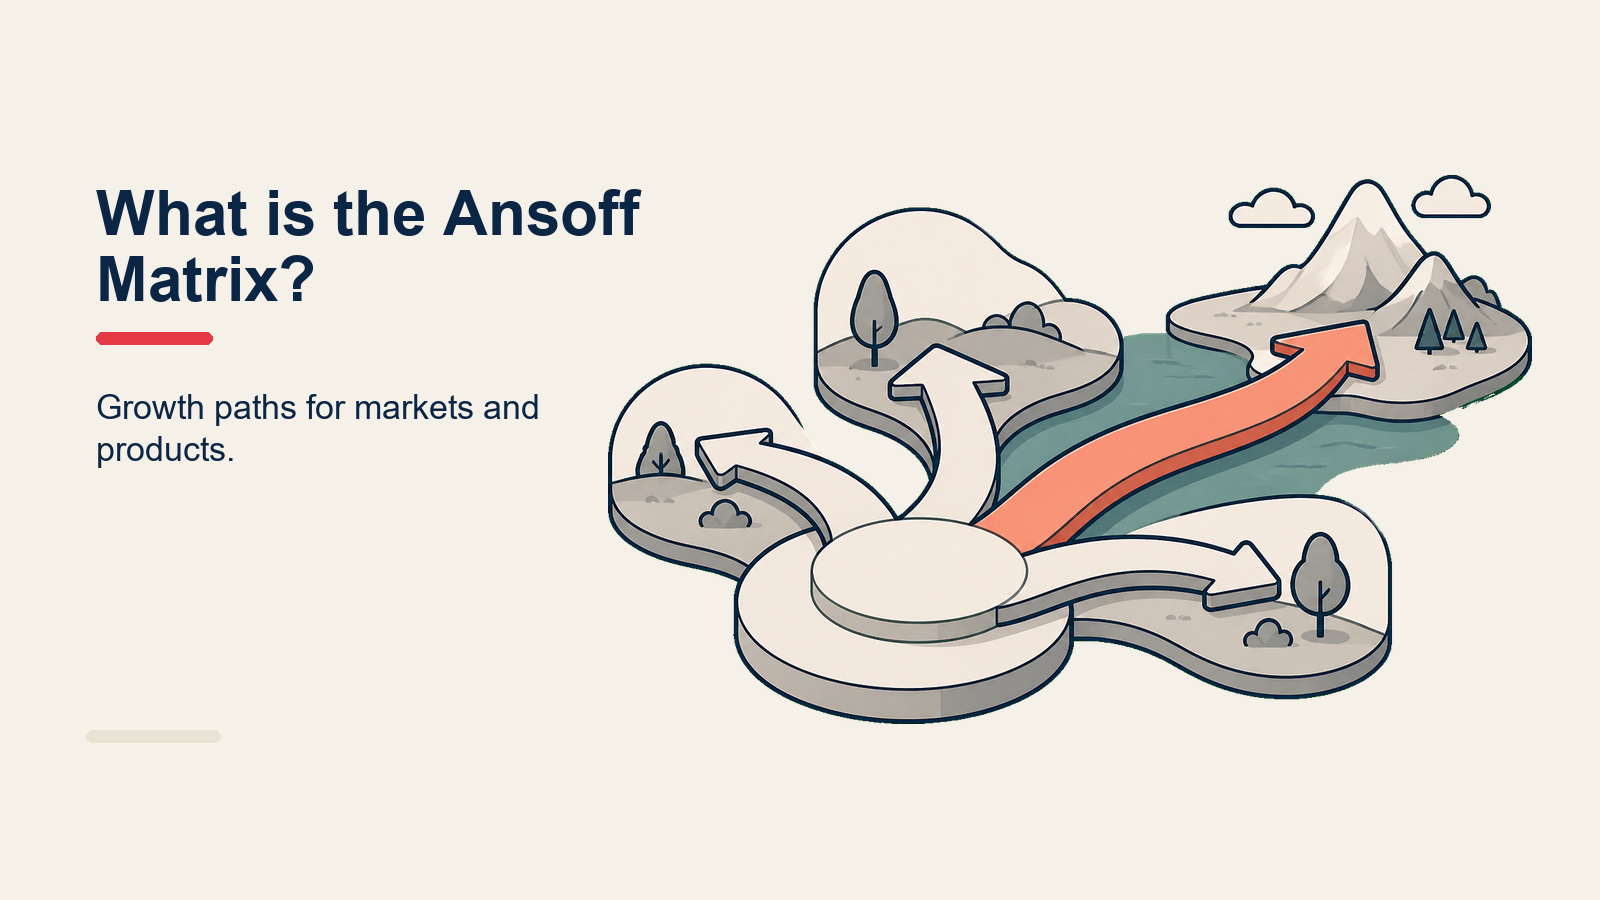
A Matriz de Ansoff é um framework estratégico dois por dois que ajuda líderes a decidir onde concentrar a próxima aposta de crescimento. Se a sua equipe está debatendo se vale a pena aprofundar o relacionamento com clientes existentes ou avançar para novos territórios, essa ferramenta transforma esse debate em uma escolha estruturada.
O que é a Matriz de Ansoff?
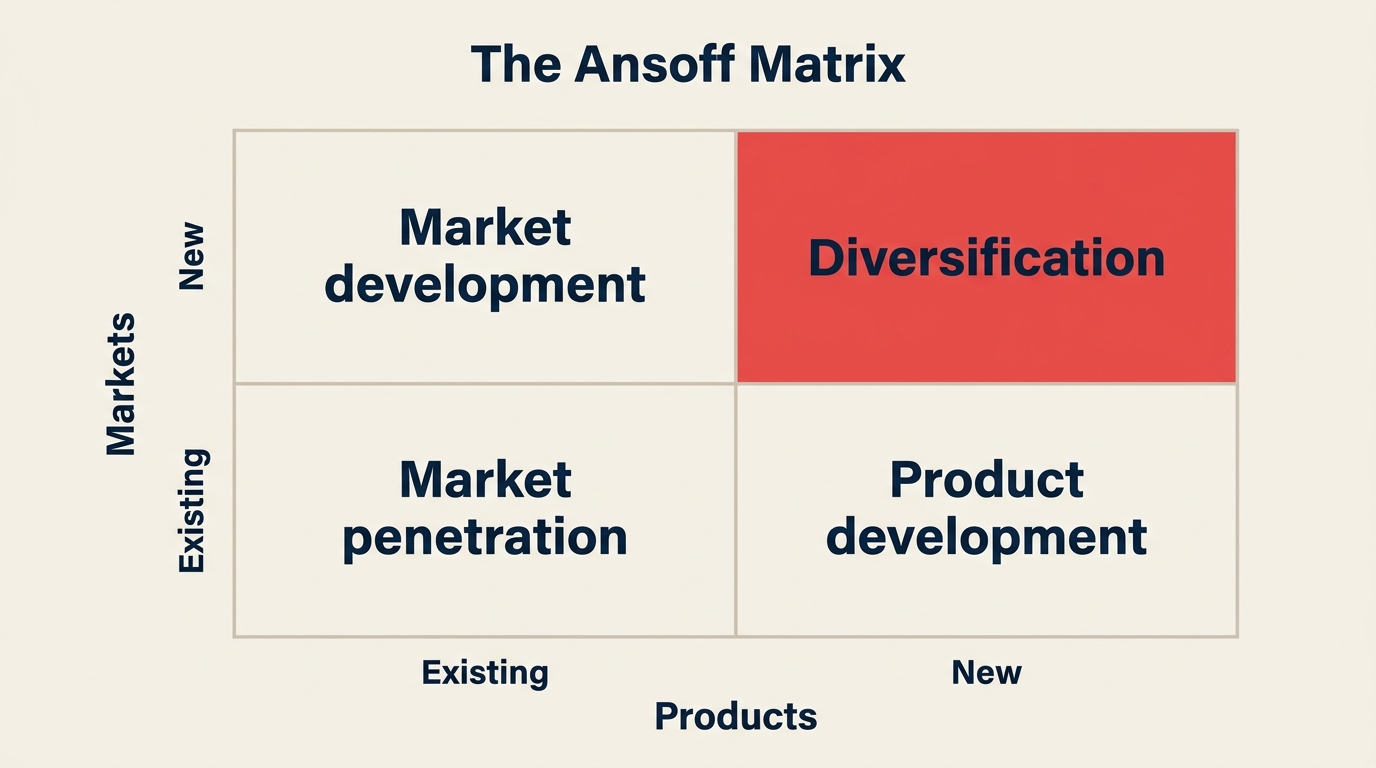
A Matriz de Ansoff é uma matriz de estratégia de crescimento 2x2 que cruza produtos existentes vs. novos em um eixo e mercados existentes vs. novos no outro. Os quatro quadrantes resultantes representam, cada um, um caminho de crescimento distinto com seu próprio perfil de risco.
Igor Ansoff apresentou o framework em seu artigo de 1957 na Harvard Business Review, "Strategies for Diversification". Ele permanece como uma das ferramentas de planejamento estratégico mais ensinadas porque força uma resposta concreta a uma pergunta deceptivamente simples: crescimento por meio de quê, e para quem?
Fatos-Chave
- O artigo de Igor Ansoff na HBR de 1957, "Strategies for Diversification", é a fonte publicada original da matriz e introduziu o conceito de "escopo produto-mercado" na estratégia corporativa.
- Uma pesquisa de crescimento da BCG de 2024 constatou que mais de 60% das empresas perseguem ao menos três das quatro estratégias de Ansoff simultaneamente, em vez de se comprometer com um único quadrante.
- PMI e Harvard Business Review continuam ensinando a Matriz de Ansoff como framework fundamental de crescimento em seus currículos de estratégia e gestão de projetos (HBR, 2023).
As 4 estratégias de crescimento
1. Penetração de mercado (produto existente, mercado existente)
Penetração de mercado significa vender mais do que você já vende para os clientes que você já possui. É o quadrante de menor risco porque você trabalha com produtos conhecidos e compradores conhecidos.
Táticas típicas:
- Reduzir preço para ganhar participação de mercado frente a concorrentes diretos
- Lançar programas de fidelidade para aumentar a frequência de compra
- Executar promoções direcionadas para reativar clientes inativos
- Impulsionar campanhas de Upsell e Cross-sell para ampliar a participação na carteira do cliente
Exemplo real: A Coca-Cola em mercados maduros. Em vez de reinventar sua receita, a Coca-Cola concentra o orçamento em promoções, inovações de embalagem (latinhas pequenas, garrafas de vidro) e acordos de distribuição que mantêm o espaço de prateleira à frente dos concorrentes.
2. Desenvolvimento de mercado (produto existente, mercado novo)
Desenvolvimento de mercado consiste em levar seu produto atual a novos clientes, seja em uma nova geografia, um segmento demográfico diferente ou um novo caso de uso.
Táticas típicas:
- Expandir para novos países ou regiões
- Reposicionar o produto para alcançar uma faixa etária ou setor diferente
- Abrir novos canais de distribuição (por exemplo, migrar do varejo para o direto ao consumidor)
- Prospectar verticais adjacentes onde o produto resolve um problema similar
Exemplo real: A Netflix lançando em mais de 190 países entre 2015 e 2016. O produto (streaming de vídeo) não mudou. O mercado, sim.
3. Desenvolvimento de produto (produto novo, mercado existente)
Desenvolvimento de produto mantém sua base de clientes atual e constrói algo novo para ela. O risco é moderado porque você conhece para quem está vendendo, mas está apostando na execução de P&D.
Táticas típicas:
- Lançar extensões de linha de produto (novos sabores, tamanhos, funcionalidades)
- Lançar uma versão premium ou de entrada
- Criar pacotes com serviços complementares para resolver problemas adjacentes
- Desenvolver uma segunda geração com funcionalidades solicitadas pelos clientes
Exemplo real: A Apple lançando o Apple Watch para sua base existente de usuários de iPhone. A Apple já tinha o relacionamento com o cliente; ela criou uma nova categoria de produto para aprofundar esse relacionamento.
4. Diversificação (produto novo, mercado novo)
Diversificação é o quadrante de maior risco porque você está entrando simultaneamente em território desconhecido de produto e de mercado. Mas também carrega o maior potencial de retorno quando funciona.
Táticas típicas:
- Adquirir uma empresa em um setor adjacente (diversificação relacionada)
- Construir uma nova unidade de negócios do zero para entrar em um setor diferente (diversificação não relacionada)
- Licenciar tecnologia e lançá-la sob uma nova marca em uma nova vertical
- Formar um joint venture com um parceiro que tenha o acesso ao mercado que você não tem
Exemplo real: A Amazon migrando do varejo online para a computação em nuvem com a AWS. Produto diferente, base de clientes diferente, ciclo de compra diferente. Hoje a AWS responde pela maior parte do lucro operacional da Amazon.
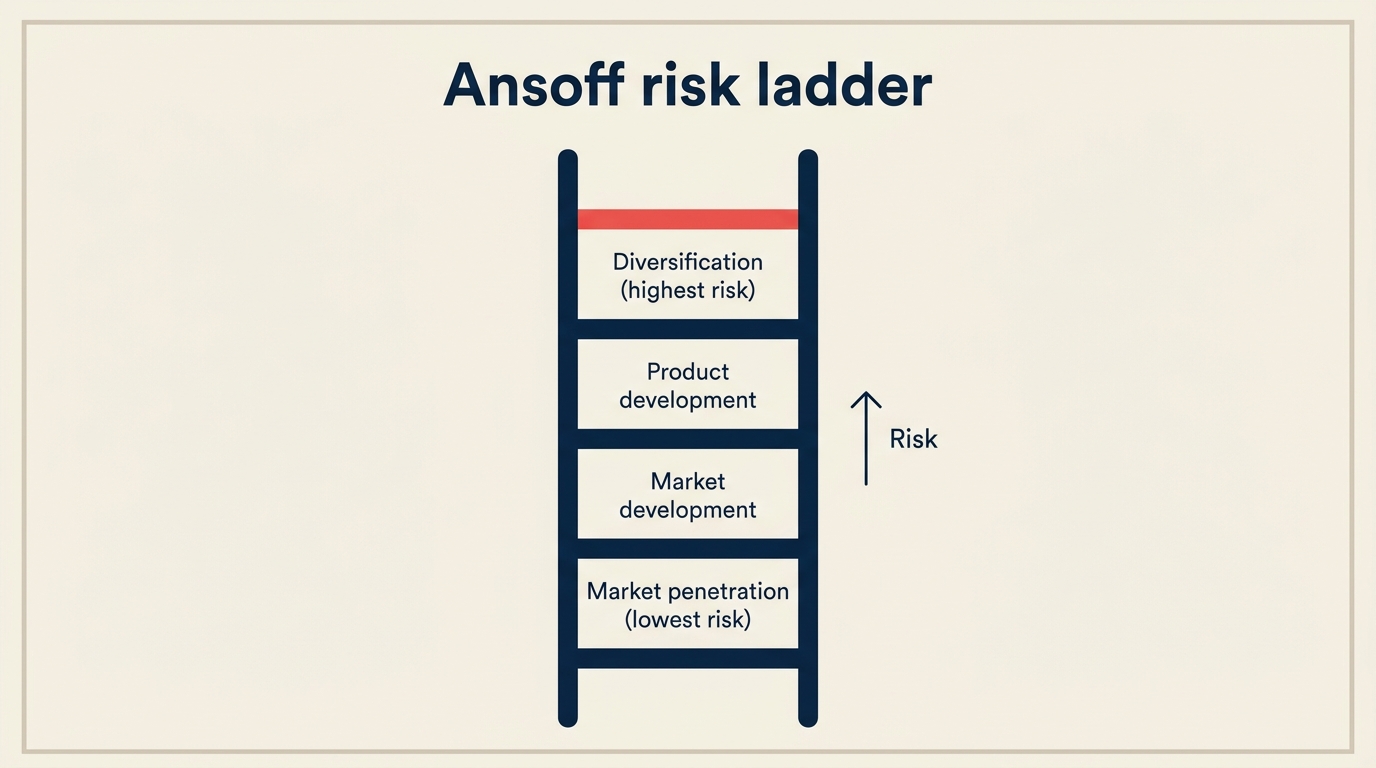
Escada de risco: qual estratégia é mais arriscada?
As quatro estratégias se posicionam em uma escada de risco clara, de baixo para cima:
- Penetração de mercado (risco mais baixo): você conhece o produto e conhece o comprador. Apenas risco de execução.
- Desenvolvimento de mercado: você conhece o produto, mas não o novo comprador. Risco de mercado adicionado.
- Desenvolvimento de produto: você conhece o comprador, mas não o novo produto. Risco de P&D e lançamento adicionado.
- Diversificação (risco mais alto): você não conhece nem o produto nem o mercado. As duas incertezas se somam.
A escada importa para decisões de portfólio. A maioria dos conselhos de administração financia apostas de penetração com orçamentos operacionais. O desenvolvimento de produto geralmente requer uma alocação de capital. A diversificação normalmente exige aprovação do conselho porque o perfil de risco se assemelha mais a uma aquisição ou a uma aposta de startup.
Exemplos da Matriz de Ansoff por empresa
Três casos do mundo real mostrando como empresas se moveram entre quadrantes ao longo do tempo.
Coca-Cola
| Movimento | Eixo de produto | Eixo de mercado | Quadrante de Ansoff |
|---|---|---|---|
| Investimento em promoções nos mercados domésticos | Existente | Existente | Penetração de mercado |
| Expansão da Coke Zero para novos países | Existente | Novo | Desenvolvimento de mercado |
| Lançamento das lojas Costa Coffee | Novo | Novo | Diversificação |
Apple
| Movimento | Eixo de produto | Eixo de mercado | Quadrante de Ansoff |
|---|---|---|---|
| iPhone SE (iPhone de menor preço) | Existente | Existente | Penetração de mercado |
| Lançamento do iPhone na China e na Índia | Existente | Novo | Desenvolvimento de mercado |
| Apple Watch para usuários de iPhone | Novo | Existente | Desenvolvimento de produto |
Netflix
| Movimento | Eixo de produto | Eixo de mercado | Quadrante de Ansoff |
|---|---|---|---|
| Planos com desconto e tier com anúncios | Existente | Existente | Penetração de mercado |
| Expansão global para 190+ países | Existente | Novo | Desenvolvimento de mercado |
| Conteúdo original Netflix | Novo | Existente | Desenvolvimento de produto |
Como usar a Matriz de Ansoff em 5 passos
Passo 1: Mapeie seu mix de receita atual
Liste cada produto ou linha de produtos junto ao segmento de mercado que o compra. Seja específico. "Enterprise SaaS na América do Norte" é mais útil do que "B2B". Esse ponto de partida indica em qual quadrante você já opera e, aproximadamente, quanta receita cada célula gera hoje.
Passo 2: Avalie cada célula pelo tamanho da oportunidade
Para cada um dos quatro quadrantes, estime o crescimento realista em receita ou unidades que você poderia atingir em um horizonte de 3 anos. Use os dados da sua análise SWOT, pesquisas de mercado e entrevistas com clientes. Não ignore o quadrante de penetração por parecer pouco empolgante; frequentemente é a maior oportunidade de curto prazo.
Passo 3: Avalie cada célula pelo risco
Atribua uma pontuação de risco a cada quadrante com base na situação específica da sua empresa. Uma empresa SaaS com forte vantagem de distribuição pode considerar o desenvolvimento de mercado muito menos arriscado do que um fabricante sem reconhecimento de marca fora de sua região de origem. Use os fatores críticos de sucesso para calibrar o que "risco de execução" realmente significa para sua equipe.
Passo 4: Escolha as 1-2 apostas que você vai de fato financiar
Compare o tamanho da oportunidade com o risco. O objetivo é encontrar a aposta de maior valor esperado que sua organização possa executar de forma realista. A maioria das empresas deveria financiar uma aposta de penetração (baixo risco, geração de caixa de curto prazo) e uma aposta de crescimento (risco maior, horizonte mais longo). Mais de dois movimentos ativos de Ansoff tende a diluir o foco.
Passo 5: Revise anualmente
Os mercados mudam. Revisite a matriz todo ano durante a análise dos seus objetivos SMART. Um movimento de desenvolvimento de mercado do ano passado pode agora ser sua maior oportunidade de penetração, porque o que era "mercado novo" já se tornou terreno familiar.
Matriz de Ansoff vs BCG Matrix vs Estratégias Genéricas de Porter
Esses três frameworks costumam ser confundidos porque todos vivem na gaveta de "estratégia de crescimento".
| Framework | Pergunta que responde | Eixos | Resultado |
|---|---|---|---|
| Matriz de Ansoff | Onde devemos crescer? | Produtos (existentes/novos) vs. Mercados (existentes/novos) | 4 opções de direção de crescimento |
| BCG Matrix | Como devemos alocar capital entre nosso portfólio? | Participação de mercado vs. Taxa de crescimento de mercado | Rótulos Cash Cow / Star / Question Mark / Dog |
| Estratégias Genéricas de Porter | Como competimos dentro de um mercado escolhido? | Escopo competitivo vs. vantagem competitiva | Liderança em custo / Diferenciação / Foco |
Uma conversa estratégica completa usa os três. Comece com Ansoff para escolher a direção, use a BCG Matrix para priorizar em quais produtos investir, e aplique Porter para definir como você vai vencer quando estiver comprometido com um quadrante. Seu business model canvas é a ferramenta certa para traduzir a estratégia escolhida em decisões de modelo operacional.
Pontos fortes e limitações da Matriz de Ansoff
Pontos fortes
- Força uma escolha concreta entre quatro direções de crescimento bem definidas
- Coloca o risco explicitamente como um insumo de primeira classe, não como um pensamento posterior
- Funciona para qualquer setor, tamanho de empresa ou tipo de produto
- Rápida de aplicar em um workshop (90 minutos são suficientes para a maioria das lideranças)
- Combina naturalmente com exercícios de pensamento estratégico porque os quadrantes oferecem às equipes um vocabulário compartilhado
Limitações
- Apenas duas dimensões (produto e mercado); ignora distribuição, capacidade e capital
- Trata cada quadrante como binário (existente vs. novo), quando a realidade é mais um espectro
- Não ajuda na execução depois que você escolheu uma direção
- Pode gerar falsa confiança se as definições de mercado e produto forem muito amplas
- Não considera modelos de negócios digitais onde um único produto pode atender mercados radicalmente diferentes com custo marginal próximo de zero
Use a Matriz de Ansoff como ponto de partida para a conversa, não como a palavra final. Combine-a com uma Matriz RACI para definir responsabilidades depois que uma aposta de crescimento for escolhida, e revisite o framework a cada ano para garantir que a aposta ainda se encaixa na realidade do mercado.
Perguntas frequentes
Quem criou a Matriz de Ansoff?
Igor Ansoff, matemático e estrategista de negócios russo-americano, apresentou a matriz em seu artigo de 1957 na Harvard Business Review, "Strategies for Diversification". Ele expandiu o framework em seu livro de 1965, Corporate Strategy.
Qual estratégia de Ansoff é a mais arriscada?
A diversificação é a mais arriscada porque exige que você construa ou adquira ao mesmo tempo um novo produto e uma nova posição de mercado. Nem o produto nem o cliente são familiares, então toda suposição é não testada. A penetração de mercado é a estratégia de menor risco porque você trabalha com produtos comprovados e compradores conhecidos.
A diversificação é sempre uma má ideia?
Não. A diversificação é de alto risco, mas também pode oferecer o maior retorno quando uma empresa tem o capital, a capacidade e o momento de mercado certos. A Amazon Web Services é o exemplo mais citado. A chave está em entrar com premissas realistas sobre o comprometimento de recursos necessário e uma tese clara de por que você tem vantagem no novo espaço.
Como a Matriz de Ansoff é diferente da BCG Matrix?
A Matriz de Ansoff responde à pergunta "onde devemos crescer?" mapeando produtos contra mercados. A BCG Matrix responde "como devemos alocar capital?" mapeando participação de mercado contra taxa de crescimento de mercado. Elas são complementares, não concorrentes. A maioria das equipes de estratégia usa Ansoff para definir direção e BCG para priorizar investimentos em um portfólio existente.
É possível usar múltiplas estratégias de Ansoff ao mesmo tempo?
Sim, e a maioria das empresas maduras o faz. Uma pesquisa da BCG de 2024 constatou que mais de 60% das empresas perseguem ao menos três quadrantes simultaneamente. A restrição prática não é o framework; é a atenção da liderança e o capital. Executar quatro movimentos de Ansoff ao mesmo tempo geralmente significa executar todos os quatro mal. A maioria das equipes obtém melhores resultados designando uma aposta principal e uma aposta secundária, e tratando os outros quadrantes como itens de observação.
O planejamento estratégico de crescimento funciona melhor quando está ancorado em um framework claro e revisitado regularmente. A Matriz de Ansoff oferece à liderança um vocabulário compartilhado para a direção do crescimento. Mas o trabalho real está na pontuação, na decisão de financiamento e na revisão anual. Crie esses três hábitos e a matriz se paga toda vez.

Senior Operations & Growth Strategist
On this page
- O que é a Matriz de Ansoff?
- Fatos-Chave
- As 4 estratégias de crescimento
- 1. Penetração de mercado (produto existente, mercado existente)
- 2. Desenvolvimento de mercado (produto existente, mercado novo)
- 3. Desenvolvimento de produto (produto novo, mercado existente)
- 4. Diversificação (produto novo, mercado novo)
- Escada de risco: qual estratégia é mais arriscada?
- Exemplos da Matriz de Ansoff por empresa
- Como usar a Matriz de Ansoff em 5 passos
- Passo 1: Mapeie seu mix de receita atual
- Passo 2: Avalie cada célula pelo tamanho da oportunidade
- Passo 3: Avalie cada célula pelo risco
- Passo 4: Escolha as 1-2 apostas que você vai de fato financiar
- Passo 5: Revise anualmente
- Matriz de Ansoff vs BCG Matrix vs Estratégias Genéricas de Porter
- Pontos fortes e limitações da Matriz de Ansoff
- Perguntas frequentes