Risk Matrix: Como Pontuar Probabilidade e Impacto (Template)
Turn this article into takeaways for your work.
Each assistant summarizes the article only for you and suggests best practices for your work.
Uma risk matrix é a forma mais rápida de transformar uma lista vaga de preocupações do projeto em um panorama ranqueado e acionável do que realmente merece sua atenção. Em vez de tratar todo risco como igualmente urgente, a matriz pontua cada um em duas dimensões: qual a probabilidade de acontecer e o quão grave seria o impacto se acontecesse. O resultado é uma grade que separa ameaças críticas de incômodos menores em um único olhar.
Gerentes de projeto, responsáveis por risco e executivos usam essa ferramenta antes de iniciar qualquer coisa relevante: um lançamento de produto, uma migração de sistema, uma obra, uma mudança regulatória. Mas a ferramenta só é tão boa quanto a disciplina de pontuação por trás dela. Este guia cobre a mecânica, as escolhas de tamanho mais comuns (3x3 vs 5x5), uma construção passo a passo e os erros que silenciosamente comprometem todo o exercício.
O Que É uma Risk Matrix?
Uma risk matrix (também chamada de matriz de probabilidade e impacto ou matriz de avaliação de risco) é uma grade bidimensional que posiciona riscos pela sua probabilidade de ocorrência em um eixo e pela sua gravidade de impacto no outro. Cada célula da grade representa uma pontuação de risco combinada. Quanto maior a pontuação, mais urgente a resposta.
O conceito segue a fórmula central da ISO 31000 e do PMBOK Guide:
Pontuação de Risco = Probabilidade x Impacto
Essa fórmula é enganosamente simples. O poder vem de aplicá-la de forma consistente em cada risco da sua lista, para que você possa comparar ameaças que parecem muito diferentes em natureza. Um atraso na cadeia de suprimentos e um vazamento de dados se tornam números que você pode ordenar, colorir e atribuir responsáveis.
A matriz não substitui o julgamento. Ela o estrutura. Dois riscos podem ter a mesma pontuação numérica, mas exigir respostas completamente diferentes com base em reversibilidade, exposição regulatória ou contexto estratégico. A grade mostra por onde começar a olhar; sua equipe decide o que fazer a respeito.
Principais Fatos
- A ISO 31000:2018, o padrão internacional de gestão de riscos, define risco como "o efeito da incerteza sobre os objetivos" e recomenda avaliar tanto a probabilidade quanto a consequência como insumos centrais para qualquer avaliação de risco.
- O PMBOK Guide (7ª edição) lista a matriz de probabilidade e impacto como uma ferramenta central de análise qualitativa de riscos, usada para priorizar riscos individuais do projeto para análise ou ação adicional.
- Uma pesquisa de 2023 do Project Management Institute constatou que organizações com práticas de risco maduras tinham 28% mais chances de atingir seus objetivos originais de projeto do que aquelas com processos de risco informais ou inexistentes (PMI Pulse of the Profession 2023).
Como Funciona uma Risk Matrix
A matriz tem dois eixos. Probabilidade (ou likelihood) fica em um eixo, geralmente vertical. Impacto (ou consequência) fica no outro, geralmente horizontal. Cada eixo é dividido em níveis de classificação: três níveis para uma matriz 3x3, cinco para uma 5x5.
Escala de probabilidade
| Nível | Rótulo | Definição |
|---|---|---|
| 1 | Raro | Menos de 10% de chance; não aconteceu em projetos similares |
| 2 | Improvável | 10-30% de chance; aconteceu ocasionalmente |
| 3 | Possível | 30-50% de chance; não seria surpreendente |
| 4 | Provável | 50-75% de chance; aconteceu na maioria dos projetos similares |
| 5 | Quase Certo | Mais de 75% de chance; espera-se que ocorra |
Escala de impacto
| Nível | Rótulo | Definição |
|---|---|---|
| 1 | Insignificante | Inconveniente menor; sem efeito no cronograma, custo ou qualidade |
| 2 | Pequeno | Pequeno atraso ou estouro de custo; resolvido internamente |
| 3 | Moderado | Impacto perceptível no escopo, orçamento ou cronograma; exige atenção da gestão |
| 4 | Grande | Estouro de custo significativo ou atraso de cronograma; afeta os objetivos do projeto |
| 5 | Catastrófico | Falha do projeto, perda financeira grave, violação regulatória ou incidente de segurança |
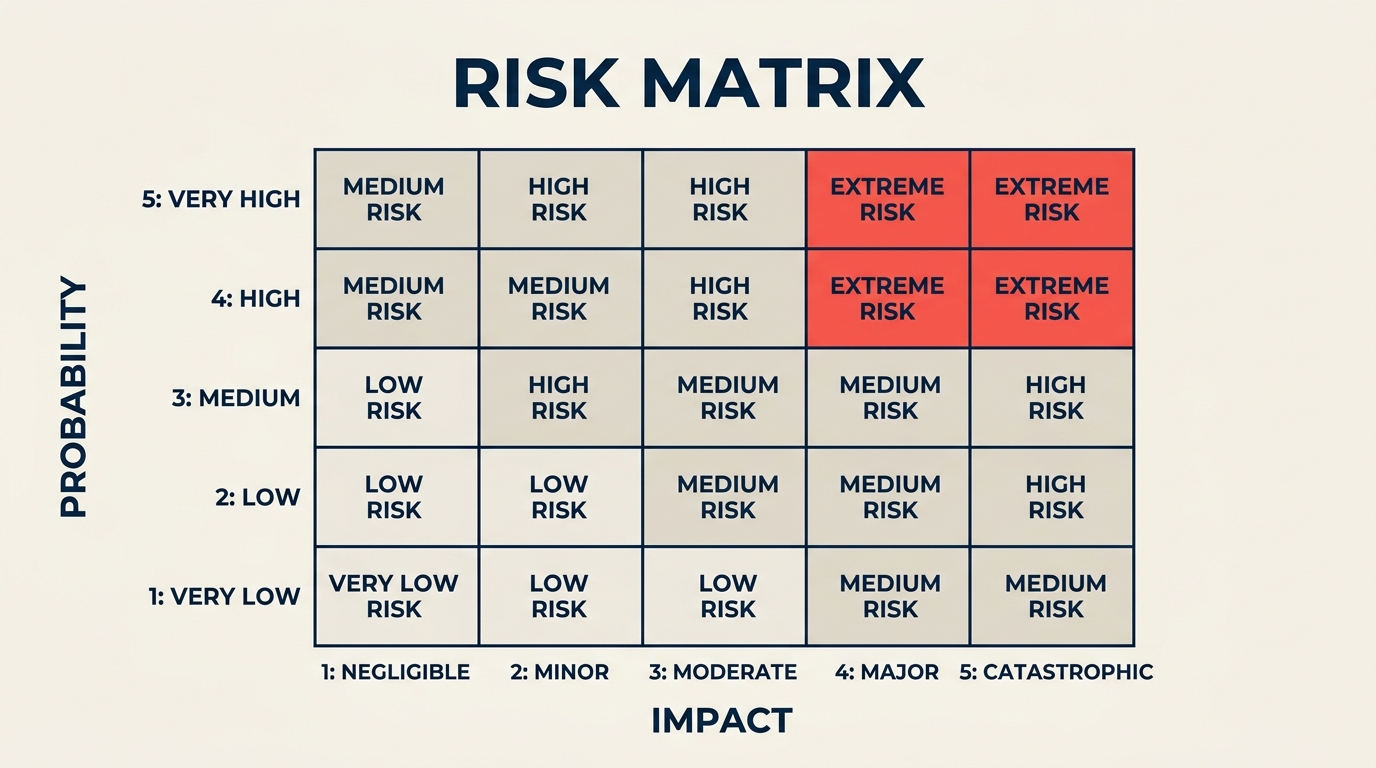
Zonas de pontuação de risco (grade 5x5)
Multiplique probabilidade por impacto para obter a pontuação de risco (1 a 25). As equipes geralmente mapeiam as pontuações em três ou quatro zonas de resposta:
| Probabilidade / Impacto | 1 Insignificante | 2 Pequeno | 3 Moderado | 4 Grande | 5 Catastrófico |
|---|---|---|---|---|---|
| 5 Quase Certo | 5 | 10 | 15 | 20 | 25 |
| 4 Provável | 4 | 8 | 12 | 16 | 20 |
| 3 Possível | 3 | 6 | 9 | 12 | 15 |
| 2 Improvável | 2 | 4 | 6 | 8 | 10 |
| 1 Raro | 1 | 2 | 3 | 4 | 5 |
Zonas de pontuação:
- 1-4 (Baixo): Monitorar; nenhuma ação imediata necessária
- 5-9 (Médio): Atribuir um responsável; planejar uma resposta, mas pode-se aceitar
- 10-16 (Alto): Gerenciar ativamente; mitigação necessária antes de o projeto avançar
- 17-25 (Crítico): Escalar imediatamente; pode exigir parar ou redesenhar o projeto
Risk Matrix 3x3 vs 5x5
A pergunta mais comum é se deve usar três ou cinco níveis por eixo. Ambos funcionam. A escolha depende da complexidade do seu projeto e de quanta granularidade de pontuação sua equipe consegue realmente sustentar.
| Dimensão | Matriz 3x3 | Matriz 5x5 |
|---|---|---|
| Faixa de pontuação | 1-9 | 1-25 |
| Melhor para | Projetos simples, escopo em estágio inicial, visões executivas | Projetos complexos, setores regulados, registros formais de risco |
| Granularidade | Baixa (faixas mais amplas) | Alta (distinções mais finas) |
| Risco de empate de pontuação | Maior (mais riscos caem na mesma célula) | Menor |
| Esforço de calibração | Baixo | Maior (5 níveis exigem definições mais precisas) |
| Uso comum | Equipes pequenas, workshops rápidos de risco | Programas liderados por PMO, construção, farmacêutica, transformação de TI |
Uma matriz 3x3 é mais fácil de preencher e explicar aos stakeholders. Uma matriz 5x5 é melhor quando você precisa distinguir entre, digamos, 20% e 40% de probabilidade, porque esses dois riscos podem exigir respostas muito diferentes mesmo que ambos caiam na faixa "média" em uma 3x3.
Como Construir uma Risk Matrix
Passo 1: Defina seus níveis de probabilidade
Escreva o que cada classificação de probabilidade realmente significa para o seu projeto. "Provável" significa coisas diferentes em um sprint de duas semanas versus um programa de infraestrutura de três anos. Vincule cada nível a uma faixa percentual e, quando possível, a um ponto de referência histórico que sua equipe reconheça.
Passo 2: Defina seus níveis de impacto
Faça o mesmo para o impacto. Mapeie cada nível para consequências reais: quantos dias de atraso no cronograma, qual limite de estouro de custo, qual resultado de qualidade ou regulatório. Âncoras concretas reduzem a variação subjetiva quando pessoas diferentes pontuam o mesmo risco.
Passo 3: Identifique e liste seus riscos
Reúna riscos através de um brainstorm estruturado, entrevistas com especialistas, registros de lições aprendidas ou um exercício de pre-mortem. Registre cada um em um risk register antes de pontuar. A matriz ranqueia os riscos; o registro os acompanha ao longo do tempo.
Passo 4: Pontue cada risco
Para cada risco, atribua uma classificação de probabilidade e uma classificação de impacto de forma independente. Faça isso em grupo sempre que possível. Pontuações discrepantes revelam suposições ocultas que valem a pena discutir. Multiplique as duas classificações para obter a pontuação de risco e posicione o risco na sua grade.
Passo 5: Defina limites de resposta e atribua responsáveis
Decida com antecedência o que cada zona de pontuação exige. Riscos críticos precisam de um responsável nomeado, um plano de mitigação e uma data de revisão antes de o trabalho continuar. Riscos altos precisam de um plano de resposta dentro de uma semana. Riscos médios entram na lista de observação. Riscos baixos são anotados e monitorados. Sem limites predefinidos, a matriz vira uma decoração em vez de uma ferramenta de decisão.
Benefícios
Vocabulário compartilhado. Quando todos usam as mesmas definições de probabilidade e impacto, as conversas sobre risco deixam de ser anedóticas. Um desenvolvedor, um líder financeiro e um executivo podem olhar para a mesma célula e concordar sobre o que ela significa.
Priorização em escala. Em um projeto com 30 ou 40 riscos identificados, você não consegue agir sobre todos igualmente. A matriz força um ranqueamento que permite concentrar tempo e orçamento onde a exposição é maior.
Alerta antecipado. Riscos que começam na zona média podem ser acompanhados ao longo das fases do projeto. Se a classificação de probabilidade de um risco sobe de "improvável" para "possível" no meio do projeto, a matriz mostra essa mudança claramente e provoca uma conversa antes que o risco vire um problema.
Comunicação com stakeholders. Grades coloridas são muito mais legíveis em uma apresentação de comitê diretor do que uma tabela de números brutos. Zonas vermelho/amarelo/verde traduzem análises complexas em sinal visual imediato.
Trilha de auditoria. Uma matriz datada e versionada dá a reguladores, auditores e patrocinadores a evidência de que os riscos foram formalmente avaliados e ativamente gerenciados. Em setores como farmacêutico, construção e finanças, essa trilha costuma ser obrigatória.
Erros Comuns
Pontuação subjetiva sem âncoras. Se seus níveis de probabilidade são definidos apenas como "baixo", "médio" e "alto" sem critérios de apoio, cinco pessoas diferentes darão cinco pontuações diferentes ao mesmo risco. Defina cada nível com uma faixa percentual e um exemplo concreto.
Ignorar os limites das zonas de pontuação. Às vezes as equipes constroem uma matriz bonita, a colorem corretamente e depois tratam todo risco como se exigisse a mesma resposta. Todo o sentido das zonas é disparar ações diferentes. Um risco Crítico que cai na zona vermelha precisa escalar; se em vez disso ele vai para uma lista de observação, a matriz falhou.
Tratar a matriz como uma entrega única. Os perfis de risco mudam à medida que os projetos avançam. Um risco que era de baixa probabilidade no início pode se tornar quase certo até o terceiro mês. Repontue seus riscos nos principais marcos: após o congelamento de requisitos, após a contratação, após o go-live. Uma matriz estática cria uma falsa confiança.
Confundir categorias de impacto. Impacto no cronograma e impacto financeiro não são a mesma coisa. Um risco que causa duas semanas de atraso pode custar quase nada se a equipe for interna; o mesmo atraso em um contrato de preço fixo com multas pode ser catastrófico. Considere manter dimensões de impacto separadas ou uma pontuação composta ponderada para programas de alto risco.
Sobrecarregar a matriz. Se todo risco cai na zona média, suas definições de pontuação provavelmente estão muito frouxas. Recalibre para que a distribuição reflita o perfil real de risco. As células do canto superior direito devem estar pouco povoadas; se estiverem cheias, ou você tem um projeto genuinamente perigoso, ou seus critérios precisam ser mais rigorosos.
Exemplo de Risk Matrix
Uma empresa de SaaS está migrando seu banco de dados de clientes para um novo provedor de nuvem. O gerente de projetos conduz um workshop de risco e identifica cinco riscos-chave.
| Risco | Probabilidade | Impacto | Pontuação | Zona |
|---|---|---|---|---|
| Perda de dados durante a migração | 2 (Improvável) | 5 (Catastrófico) | 10 | Alto |
| Atraso de fornecedor terceirizado | 4 (Provável) | 3 (Moderado) | 12 | Alto |
| Conflito de disponibilidade da equipe (sobreposição de férias) | 3 (Possível) | 2 (Pequeno) | 6 | Médio |
| Revisão regulatória demora mais que o planejado | 2 (Improvável) | 4 (Grande) | 8 | Médio |
| Degradação de desempenho pós-migração | 3 (Possível) | 3 (Moderado) | 9 | Médio |
O risco de perda de dados pontua 10 apesar da baixa probabilidade, porque o impacto seria catastrófico. Ele recebe um responsável nomeado (o líder de engenharia), um plano de rollback documentado antes do início da migração e uma verificação de status diária durante a janela de corte. O risco de atraso do fornecedor pontua 12 e recebe uma cláusula contratual e um fornecedor backup identificado. Os outros três entram na lista de observação com check-ins quinzenais.
Isso é a matriz cumprindo seu papel: dois riscos que parecem diferentes em natureza (perda acidental de dados vs um problema de agenda com um fornecedor) sobem para Alto, e ambos recebem gestão ativa.
Melhores Práticas
Calibre com dados históricos. Se sua organização já executou projetos similares antes, use a frequência real de ocorrências passadas de risco para ancorar suas definições de probabilidade. O feeling à vontade oscila; os registros de incidentes não.
Separe risco inerente e risco residual. Pontue os riscos antes dos controles (inerente) e depois de aplicados os controles (residual). A diferença entre os dois mostra o quanto valor seus controles atuais realmente entregam. Se a pontuação residual ainda estiver Alta depois dos controles, você precisa de uma mitigação mais forte.
Use um RAID log junto com a matriz. A matriz ranqueia os riscos; o RAID log os acompanha em contexto com suposições, problemas e dependências. As duas ferramentas se complementam, não se substituem.
Vincule a matriz ao seu plano de project risk management. A matriz é um retrato de um momento. O plano de gestão de riscos mais amplo define com que frequência você repontua, quem participa das revisões de risco, como os riscos escalam e como os riscos encerrados são documentados. Sem esse plano, a matriz fica solta.
Considere Monte Carlo simulation para riscos de cronograma e custo. Uma matriz é uma ferramenta qualitativa; ela não consegue modelar o efeito acumulado de múltiplos riscos acontecendo simultaneamente. Para grandes programas em que a variação de cronograma ou orçamento importa, os métodos de Monte Carlo fornecem a camada quantitativa que a matriz não consegue.
Conecte a resposta ao risco à sua stakeholder analysis matrix. Riscos Críticos e Altos costumam exigir planos de comunicação específicos por stakeholder. Saber quem se importa com qual risco, e quanta autoridade essa pessoa tem para aprovar mitigações, torna seus planos de resposta muito mais executáveis.
Aplique a MoSCoW prioritization ao seu backlog de resposta. Quando você tem mais riscos Altos do que sua equipe consegue mitigar simultaneamente, use um framework de priorização para decidir quais respostas precisam acontecer antes das outras.
Perguntas Frequentes
Qual é a diferença entre uma risk matrix e um risk register?
Um risk register é o catálogo completo de riscos identificados, acompanhando sua descrição, responsável, status e planos de resposta ao longo da vida de um projeto. Uma risk matrix é uma ferramenta de pontuação e visualização que ranqueia riscos por probabilidade e impacto em um determinado momento. O registro é o seu histórico; a matriz é o seu ranqueamento. A maioria das equipes de projeto usa os dois juntos: o registro guarda o detalhe, e a matriz conduz a conversa de priorização.
Com que frequência você deve atualizar uma risk matrix?
No mínimo, repontue sua matriz em cada marco importante do projeto: após o kickoff, após a aprovação de requisitos, após decisões-chave de contratação e antes de cada fase de entrega importante. Projetos de alta complexidade ou em ritmo acelerado se beneficiam de revisões mensais ou até quinzenais. Os riscos não são estáticos, e uma matriz que era precisa no início de um projeto pode se tornar perigosamente enganosa seis semanas depois sem uma atualização.
Um risco pode aparecer em várias células da matriz?
Não. Cada risco recebe uma pontuação por ciclo de avaliação, com base na sua melhor estimativa atual de probabilidade e impacto. Se um risco tem probabilidade ou impacto significativamente diferentes dependendo do que mais acontece primeiro, trate-o como dois riscos separados com uma dependência anotada, ou use pontuação baseada em cenários, avaliando-o sob diferentes condições do projeto.
Qual é a diferença entre risco inerente e risco residual em uma matriz?
Risco inerente é a pontuação antes de qualquer controle ou mitigação ser aplicado: essencialmente, o que aconteceria se você não fizesse nada. Risco residual é a pontuação depois que seus controles planejados estão em vigor. Vale a pena acompanhar os dois. Se a pontuação residual de um risco ainda estiver Alta depois dos seus controles, isso indica que os controles não são suficientes e você precisa adicionar ou reforçá-los.
Uma risk matrix é suficiente para projetos regulatórios ou críticos para a segurança?
Uma matriz é um ponto de partida útil, mas setores regulados (farmacêutico, construção, aviação, serviços financeiros) costumam exigir rigor adicional: análise quantitativa de risco, métodos formais de identificação de perigos e trilhas de revisão documentadas. A ISO 31000 e padrões específicos de cada setor fornecem o framework mais amplo. A matriz se encaixa dentro desse framework como a ferramenta qualitativa de triagem inicial, não como o processo completo de gestão de riscos.
Uma risk matrix oferece uma forma estruturada de parar de tratar todo risco como igualmente urgente. Pontue-a uma vez, atribua a resposta certa a cada zona e revisite-a conforme o projeto evolui. Combinada com um risk register sólido e um caminho de escalonamento claro, ela se torna uma das ferramentas mais práticas no kit de qualquer gerente de projetos.

Senior Operations & Growth Strategist
On this page
- O Que É uma Risk Matrix?
- Como Funciona uma Risk Matrix
- Escala de probabilidade
- Escala de impacto
- Zonas de pontuação de risco (grade 5x5)
- Risk Matrix 3x3 vs 5x5
- Como Construir uma Risk Matrix
- Passo 1: Defina seus níveis de probabilidade
- Passo 2: Defina seus níveis de impacto
- Passo 3: Identifique e liste seus riscos
- Passo 4: Pontue cada risco
- Passo 5: Defina limites de resposta e atribua responsáveis
- Benefícios
- Erros Comuns
- Exemplo de Risk Matrix
- Melhores Práticas
- Perguntas Frequentes
- Qual é a diferença entre uma risk matrix e um risk register?
- Com que frequência você deve atualizar uma risk matrix?
- Um risco pode aparecer em várias células da matriz?
- Qual é a diferença entre risco inerente e risco residual em uma matriz?
- Uma risk matrix é suficiente para projetos regulatórios ou críticos para a segurança?