Story Points: Como Estimar Trabalho Ágil (Com Exemplos)
Turn this article into takeaways for your work.
Each assistant summarizes the article only for you and suggests best practices for your work.
Story points confundem quase todas as equipes na primeira vez que as encontram. Não são horas. Não são dias. E, mesmo assim, as equipes as usam para prever entregas, planejar sprints e decidir se uma funcionalidade vai ao ar neste trimestre ou no próximo.
Se você é gestor ou diretor tentando trazer previsibilidade a um workflow ágil, entender story points é inegociável. Este guia explica o que elas são, por que funcionam, como conduzir sessões de estimativa e o que observar com cuidado.
O que são story points?
Um story point é uma unidade relativa usada para medir o esforço total necessário para implementar um item de trabalho. "Esforço" aqui cobre três dimensões: complexidade (quão difícil é o trabalho?), tamanho (quanto trabalho existe?) e incerteza (o que ainda não sabemos?).
A palavra-chave é relativa. Uma história que vale 3 pontos não significa "3 horas de trabalho". Significa que a equipe acredita que ela exige aproximadamente três vezes mais esforço do que uma história de 1 ponto e cerca de metade do esforço de uma história de 8 pontos. O número é uma comparação, não uma medição.
Essa distinção importa. Os humanos são notoriamente ruins em estimar durações absolutas ("isso vai levar 4 horas"), mas razoavelmente bons em comparações relativas ("essa tarefa é cerca de duas vezes mais difícil do que aquela"). Story points exploram essa vantagem cognitiva.
Principais Fatos: Story Points e Estimativa Ágil
- Equipes que usam estimativa relativa (story points ou método similar) relatam entrega de sprint mais consistente do que equipes que estimam em horas, segundo pesquisa da Scrum.org sobre previsibilidade de sprint.
- O 17º State of Agile Report (digital.ai, 2023) constatou que 88% dos praticantes ágeis usam Scrum ou um híbrido de Scrum, tornando a estimativa por story points praticamente universal no setor.
- Segundo a série CHAOS Report do Standish Group, estimativas ruins e requisitos pouco claros estão consistentemente entre as três principais causas de estouro de prazo em projetos, reforçando por que um método estruturado como story points importa.
- Uma forma de pensar que ajuda as equipes a se calibrarem: "Um story point mede o esforço da equipe, não o calendário. A mesma funcionalidade pode custar 5 pontos para uma equipe sênior e 13 para uma júnior, e ambas as respostas estão corretas para seu contexto."
Story points vs horas
Equipes novas no ágil costumam perguntar por que não podem simplesmente estimar em horas. Aqui está a comparação honesta:
| Dimensão | Story points | Horas |
|---|---|---|
| O que mede | Esforço relativo (complexidade + tamanho + incerteza) | Duração de tempo absoluta |
| A quem pertence a estimativa | À equipe coletivamente | Muitas vezes a um único estimador |
| Melhora com o tempo? | Sim, através da calibração de velocity | Raramente, devido ao viés de ancoragem |
| Comparável entre equipes? | Não, intencionalmente específica de cada equipe | Parece comparável, mas raramente é |
| Lida bem com incerteza? | Sim, incerteza alta amplia a estimativa | Não, tende a subestimar o risco |
| Melhor para | Planejamento de sprint, previsão de roadmap | Contratos de escopo fechado, cobrança por tempo |
Horas parecem precisas, mas não são. Quando um desenvolvedor diz "isso são quatro horas", ele está realmente dizendo "se nada der errado, se eu não for interrompido, se eu já conhecer a base de código, e se os requisitos não mudarem". Story points reconhecem a ambiguidade em vez de escondê-la.
Dito isso, horas ainda têm seu lugar. Contratos de preço fechado, auditorias de compliance e cobrança de clientes exigem estimativas baseadas em tempo. O truque é saber qual ferramenta se encaixa em qual contexto.
Por que as equipes usam story points (benefícios)
Sessões de estimativa mais rápidas. Debater se algo são 6 ou 8 horas é doloroso. Debater se é um 5 ou um 8 (na escala de Fibonacci) é muito mais rápido porque a diferença entre os valores é intencionalmente grande.
Propriedade compartilhada das estimativas. Quando toda a equipe dimensiona o trabalho junta, todos entendem o escopo. Desenvolvedores identificam detalhes de implementação que os product owners deixaram passar. O QA sinaliza casos extremos com antecedência. A estimativa se torna um contrato que a equipe faz consigo mesma.
Velocity como ferramenta de previsão. Depois que uma equipe completa várias sprints, sua velocity média (story points concluídos por sprint) se torna um previsor confiável. Se sua equipe tem média de 40 pontos por sprint, um backlog de 200 pontos levará aproximadamente cinco sprints para ser entregue. Isso é um roadmap.
Redução de ancoragem. Quando um engenheiro sênior diz "isso é um trabalho de dois dias" antes de a estimativa começar, todo mundo se ajusta em direção a esse número. Story points, especialmente quando revelados simultaneamente no planning poker, impedem que uma única voz domine.
Melhores conversas, não apenas números. Quando duas pessoas escolhem valores de pontos diferentes, essa discordância revela complexidade oculta. A parte mais valiosa da estimativa não é o número final; é a conversa que leva até ele.
Erros comuns e limitações
Tratar pontos como horas. Esse é o modo de falha mais comum. Assim que um gestor pergunta "então 1 ponto equivale a quantas horas?", todo o sistema começa a desmoronar. Pontos não são uma unidade de tempo.
Comparar velocity entre equipes. A Equipe A tem média de 50 pontos por sprint e a Equipe B, 30. Isso não significa que a Equipe A é mais rápida. Equipes diferentes calibram suas escalas de forma diferente. Comparar velocities entre equipes é como comparar preços em moedas diferentes sem saber a taxa de câmbio.
Inflar estimativas por autoproteção. Quando as equipes aprendem que estimativas erradas levam à culpabilização, elas inflam os números. Uma história de 3 pontos vira uma de 5 "só por garantia". Isso infla a velocity e destrói a precisão da previsão ao longo do tempo. Culturas seguras para errar produzem estimativas melhores.
Ancorar-se à escala de uma sprint anterior. As equipes vão mudando ao longo do tempo. O que costumava ser uma história de 3 pontos pode efetivamente ser um 5 agora, porque a base de código cresceu. Recalibrações periódicas mantêm a escala honesta.
Usar pontos para medir produtividade individual. Story points pertencem à equipe. Rastrear quantos pontos cada desenvolvedor "produziu" transforma uma ferramenta de previsão em uma métrica de desempenho, o que quebra as duas coisas.
Estimar com muito detalhe cedo demais. Histórias planejadas para o próximo trimestre não precisam de precisão de 3 pontos. Um dimensionamento grosseiro por tamanho de camiseta (P/M/G/GG) é suficiente até que uma história esteja a uma ou duas sprints de ser assumida.
Como estimar com story points (passo a passo)
Passo 1: Combine sua história de referência
Antes da sua primeira sessão de estimativa, escolha uma história real que toda a equipe entenda. Essa se torna sua baseline. Atribua a ela 3 pontos (ou o que parecer um esforço médio). Toda história futura será estimada em relação a essa.
Uma boa baseline é algo que envolve as três dimensões de estimativa em um nível moderado: um pouco de complexidade, uma quantidade razoável de código a escrever e alguma incerteza (mas não excessiva).
Passo 2: Use a sequência de Fibonacci
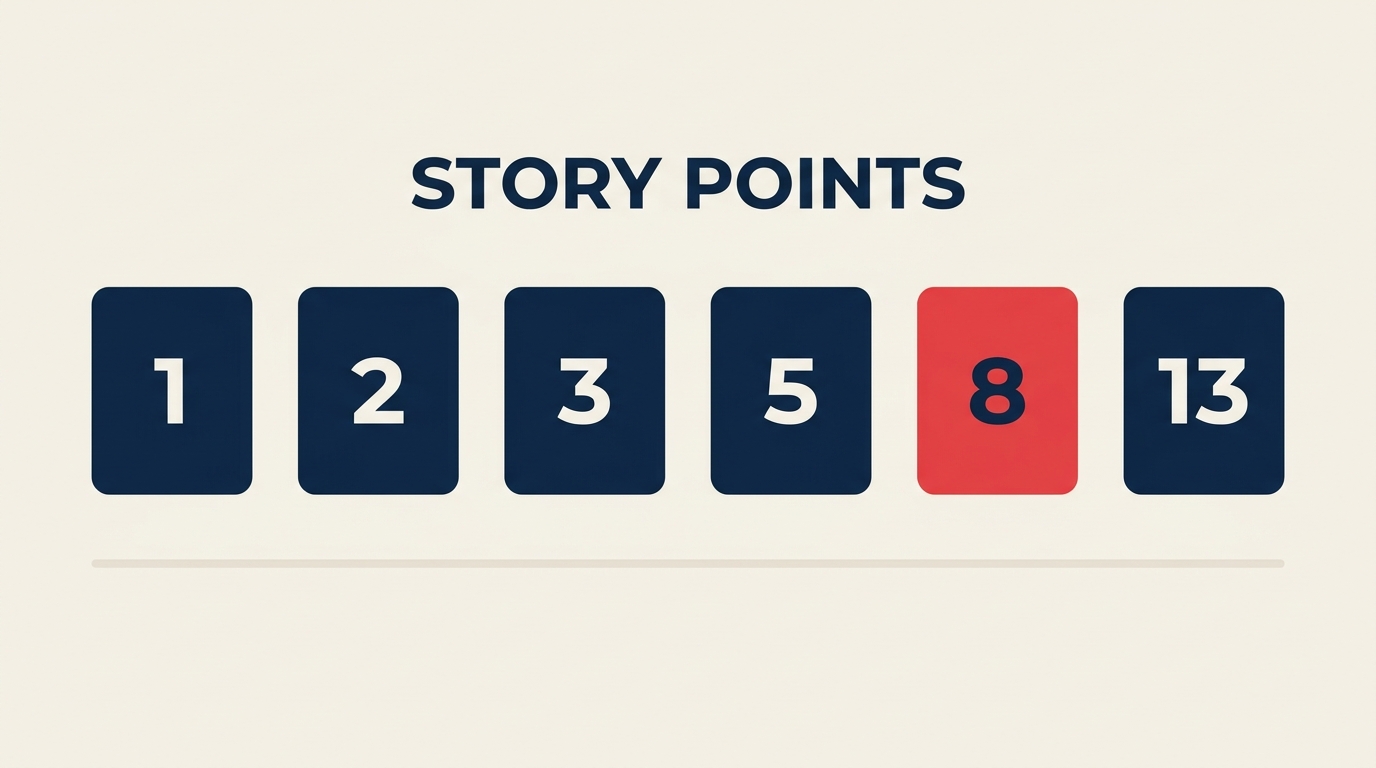
A escala de story points mais comum é uma sequência de Fibonacci modificada: 1, 2, 3, 5, 8, 13, 21. Algumas equipes adicionam 0 (trivial), 40 e 100 para trabalho de nível épico.
Por que Fibonacci? Porque os intervalos entre os valores crescem à medida que os números aumentam. Uma história de 5 pontos e uma de 8 pontos parecem significativamente diferentes. Uma de 5 pontos e uma de 6 pontos provavelmente não. A escala força a equipe a fazer distinções reais sem fingir uma precisão que não tem.
Histórias estimadas em 13 ou mais são fortes candidatas a divisão. Estimativas grandes geralmente sinalizam que o escopo ainda não está bem compreendido.
Passo 3: Conduza uma sessão de planning poker
O planning poker é a técnica padrão para estimativa colaborativa:
- O product owner lê a user story em voz alta e responde perguntas de esclarecimento.
- Cada membro da equipe seleciona privadamente uma carta de pontuação (ou um número em uma ferramenta digital).
- Todos revelam sua estimativa simultaneamente.
- Se as estimativas divergirem em mais de um degrau (por exemplo, uma pessoa escolhe 3 e outra escolhe 13), os valores discrepantes explicam seu raciocínio.
- A equipe discute e reestima até convergir.
A revelação simultânea é fundamental. Ela evita a ancoragem e garante que cada voz seja ouvida antes de o consenso se formar.
Passo 4: Calibre através da velocity
Depois das primeiras sprints, calcule a velocity da sua equipe: o total de story points concluídos em uma sprint. Não conte histórias transferidas de uma sprint anterior como "concluídas".
Após 4 a 6 sprints, você terá uma faixa de velocity confiável. Use o limite inferior dessa faixa para previsões conservadoras e a média para o planejamento típico.
A velocity se ajusta naturalmente conforme as habilidades da equipe, a familiaridade com a base de código e os hábitos de estimativa amadurecem. Não tente inflá-la manipulando as estimativas.
Passo 5: Reajuste a baseline periodicamente
Pelo menos uma vez por trimestre, revisite sua história de referência. O entendimento da equipe sobre "esforço médio" mudou? Se sim, ajuste. O objetivo é a consistência dentro da equipe ao longo do tempo, não a consistência com algum padrão externo.
Exemplos de story points
Veja como uma equipe ágil de exemplo pode estimar um conjunto de itens de backlog para um produto B2B SaaS, junto com o raciocínio e como a velocity se desenrola.
| Item do backlog | Story points | Raciocínio |
|---|---|---|
| Atualizar rótulo de botão na página de configurações | 1 | Mudança trivial de UI, sem lógica, bem compreendida |
| Adicionar validação de e-mail ao formulário de cadastro | 2 | Pequena adição de lógica, padrões existentes a seguir |
| Construir fluxo de redefinição de senha | 5 | Múltiplas telas, integração de e-mail, alguns casos extremos |
| Integrar gateway de pagamento de terceiros | 13 | Alta complexidade, API externa, incerteza significativa |
| Refatorar módulo de autenticação | 21 | Escopo grande, conhecimento profundo do sistema exigido, alto risco |
| Adicionar exportação CSV à página de relatórios | 3 | Padrão conhecido, escopo moderado, baixa incerteza |
| Construir dashboard personalizado para o tier enterprise | 8 | Funcionalidade média-grande, alguma ambiguidade de design |
Se essa equipe concluir as histórias de 1, 2, 3, 5 e 8 pontos na Sprint 1, sua velocity é de 19 pontos. Depois de algumas sprints, suponha que a velocity média se estabilize em 22 pontos. Um backlog de 110 story points dá a eles uma previsão de 5 sprints, ou aproximadamente 10 semanas em sprints de duas semanas.
A história de 13 pontos do gateway de pagamento é candidata à divisão. "Pesquisar opções de provedor de pagamento e documentar a abordagem de integração" pode ser um 5, e "implementar e testar a integração", um 8 ou 13. Dividir torna o progresso visível e reduz o risco da sprint.
Boas práticas
Faça:
- Dimensione histórias como equipe, não individualmente
- Divida qualquer história acima de 13 pontos antes de programá-la em uma sprint
- Acompanhe a velocity em janelas móveis de 4 a 6 sprints, não em sprints isoladas
- Mantenha a história baseline acessível durante as sessões de estimativa
- Deixe os desenvolvedores donos das estimativas; os product owners donos das prioridades
- Use user stories como sua unidade primária de estimativa para manter o escopo fundamentado em valor para o usuário
Não faça:
- Converter pontos em horas em qualquer comunicação oficial
- Comparar velocity entre equipes ou usá-la como sinal de contratação ou desempenho
- Deixar uma única voz dominar a estimativa antes de as cartas serem reveladas
- Reabrir estimativas no meio da sprint para acomodar expansão de escopo; registre isso como uma nova história
- Pular a estimativa de histórias "rápidas"; uma conversa de 10 minutos evita uma surpresa de 2 dias
Uma observação sobre sprint planning: as estimativas em story points são o principal insumo para decidir quanto trazer para uma sprint. Comprometer-se além da capacidade em 20% é comum em equipes novas. Conforme a velocity se estabiliza, a precisão do planejamento melhora drasticamente.
Perguntas frequentes
Por que usar números de Fibonacci em vez de 1, 2, 3, 4, 5?
A sequência de Fibonacci tem intervalos crescentes entre os valores (1, 2, 3, 5, 8, 13...), enquanto uma escala linear não tem. Quando você está estimando uma história de 5 pontos contra uma de 6 pontos, provavelmente está discutindo detalhes irrelevantes. Com Fibonacci, o salto de 5 para 8 força uma conversa genuína: essa história tem complexidade adicional suficiente para justificar um número maior? Esse atrito produz decisões melhores.
Quantas horas vale um story point?
Não vale nenhuma. Story points não mapeiam para horas por design. Se a velocity da sua equipe é de 20 pontos por sprint de 2 semanas e você trabalha 80 horas-equipe por sprint, você poderia dividir e obter 4 horas por ponto, mas esse cálculo quebra imediatamente quando o tamanho da equipe muda, a complexidade varia, ou você tem uma sprint com interrupções incomumente altas ou baixas. Use a velocity para previsão de tempo, não para matemática de horas por ponto.
Story points vs dimensionamento por tamanho de camiseta (P/M/G/GG)?
O dimensionamento por tamanho de camiseta é um método de estimativa relativa mais rápido e menos preciso, frequentemente usado para planejamento em nível de roadmap. É ótimo para funcionalidades três ou mais trimestres à frente. Story points são melhores para trabalho em nível de sprint porque suportam o cálculo de velocity. Muitas equipes usam ambos: tamanhos de camiseta para refinamento de backlog na etapa de roadmap, depois convertem para pontos quando uma funcionalidade está a uma ou duas sprints de ser desenvolvida.
Story points funcionam fora do desenvolvimento de software?
Sim. Equipes de marketing, conteúdo e operações usam story points ou técnicas de estimativa relativa similares. A escala de Fibonacci e o planning poker funcionam para qualquer trabalho que envolva complexidade e incerteza, não apenas código. A calibração só demora mais em domínios sem uma baseline estabelecida.
O que acontece quando uma história leva mais tempo do que o estimado?
Nada, idealmente. Estimativas são previsões, não compromissos. Quando uma história de 3 pontos leva o dobro do tempo esperado, a resposta certa é uma conversa em equipe: a estimativa estava errada, ou o escopo mudou? Depois, ajuste o processo, não a pessoa. Subestimação persistente em uma categoria (digamos, todas as histórias de integração de API demoram) é um sinal para ajustar sua escala ou dividir essas histórias de forma mais agressiva.
Para onde ir a partir daqui
Story points são uma camada de um sistema mais amplo de estimativa e planejamento ágil. Depois que sua equipe tiver uma velocity estável, combine a estimativa por story points com o sprint planning para definir metas de sprint realistas e com os gráficos de burndown para acompanhar o progresso em tempo real.
Se sua equipe está apenas começando com o ágil, o agile manifesto e o o que é metodologia ágil oferecem contexto útil sobre por que a estimativa relativa surgiu. Para equipes que já rodam sprints, as sprint retrospectives são o mecanismo para melhorar a precisão da estimativa ao longo do tempo.
Leitura relacionada

Senior Operations & Growth Strategist
On this page
- O que são story points?
- Story points vs horas
- Por que as equipes usam story points (benefícios)
- Erros comuns e limitações
- Como estimar com story points (passo a passo)
- Passo 1: Combine sua história de referência
- Passo 2: Use a sequência de Fibonacci
- Passo 3: Conduza uma sessão de planning poker
- Passo 4: Calibre através da velocity
- Passo 5: Reajuste a baseline periodicamente
- Exemplos de story points
- Boas práticas
- Perguntas frequentes
- Para onde ir a partir daqui
- Leitura relacionada