Velocity dalam Agile: Cara Mengukur Daya Pengeluaran Pasukan
Turn this article into takeaways for your work.
Each assistant summarizes the article only for you and suggests best practices for your work.
Velocity agile adalah antara nombor paling praktikal yang boleh dijejaki oleh pasukan Scrum. Ia memberitahu anda, secara purata, berapa banyak kerja yang benar-benar diselesaikan oleh pasukan anda dalam satu sprint, iaitu asas bagi mana-mana ramalan pelancaran atau perancangan kapasiti yang jujur.
Kebanyakan pasukan mendengar tentang velocity pada peringkat awal perjalanan agile mereka, menyalahgunakannya sebagai skor prestasi, kemudian tertanya-tanya mengapa ia mencipta tekanan bukannya kejelasan. Panduan ini menerangkan apa itu velocity, cara mengiranya dengan betul, dan cara menggunakannya sebagai alat ramalan tanpa memanipulasi nombor tersebut.
Apakah Itu Velocity dalam Agile?
Velocity agile ialah purata bilangan story point yang diselesaikan oleh pasukan dalam satu sprint. Ia dikira dengan membahagikan jumlah mata yang selesai merentas beberapa sprint terkini dengan bilangan sprint tersebut.
Itulah keseluruhan definisinya. Velocity tidak mengukur kualiti, kelajuan, kecekapan, atau usaha. Ia mengukur daya pengeluaran yang selesai dalam tetingkap masa tetap, tiada lebih daripada itu.
Kata kunci di sini ialah "selesai." Story point yang dimulakan tetapi tidak selesai sebelum sprint tamat tidak dikira dalam velocity. Kredit separa tidak wujud di sini. Ketegasan inilah yang menjadikan velocity satu input ramalan yang boleh dipercayai: jika sesuatu pasukan mempunyai purata velocity 42 mata, anda boleh meramal sprint akan datang dengan keyakinan yang munasabah kerana nombor itu mencerminkan apa yang benar-benar dihantar, bukan apa yang cuba dilakukan.
Fakta Utama
- Pasukan yang menjejaki velocity sekurang-kurangnya 6 sprint menghasilkan anggaran tarikh pelancaran yang 40% lebih tepat berbanding pasukan yang menganggar berdasarkan rasa hati semata-mata (Scrum Alliance State of Scrum, 2023).
- Purata velocity pasukan Scrum berkisar antara 20 hingga 60 story point setiap sprint, walaupun nombor itu sendiri kurang penting berbanding kestabilannya dari semasa ke semasa (VersionOne State of Agile, 2023).
- Kira-kira 60% pasukan agile melaporkan menggunakan velocity sebagai metrik perancangan kapasiti utama mereka, menjadikannya ukuran daya pengeluaran yang paling meluas digunakan dalam Scrum (Digital.ai State of Agile Report, 2023).
Cara Mengira Velocity
Formulanya mudah.
Velocity = Jumlah story point yang selesai / Bilangan sprint yang diukur
Gunakan 3 hingga 5 sprint terkini untuk purata bergerak. Kurang daripada 3 sprint memberikan gambaran yang bising; lebih daripada 7 mula mencampurkan data daripada tempoh apabila pasukan mempunyai komposisi atau tabiat anggaran yang berbeza.
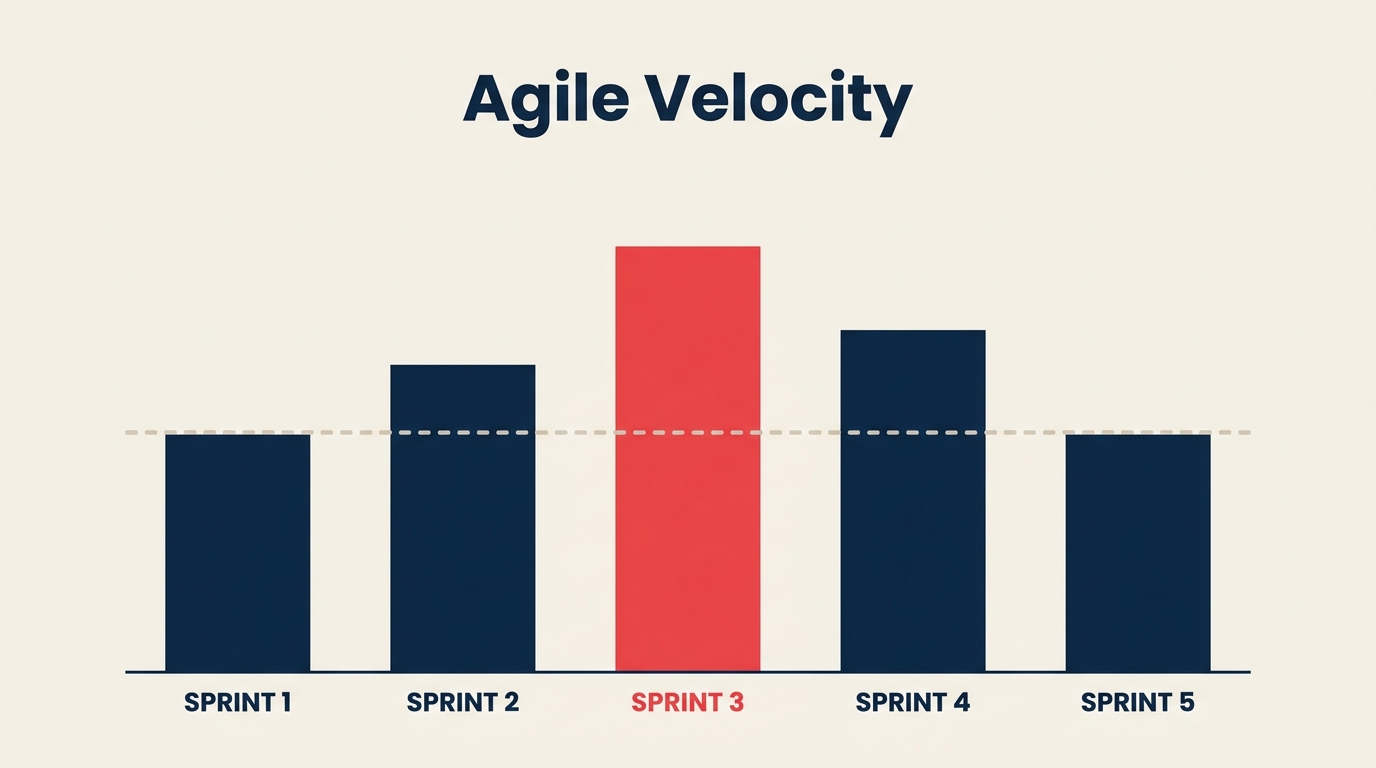
Berikut ialah contoh terperinci bagi pasukan yang menjalankan sprint 2 minggu:
| Sprint | Mata Dikomited | Mata Selesai |
|---|---|---|
| Sprint 1 | 48 | 42 |
| Sprint 2 | 45 | 44 |
| Sprint 3 | 50 | 39 |
| Sprint 4 | 46 | 45 |
Purata velocity bergerak (4 sprint): (42 + 44 + 39 + 45) / 4 = 42.5 mata
Velocity kerja pasukan ini kira-kira 42 mata setiap sprint. Perhatikan bahawa nombor yang dikomited tidak penting untuk pengiraan ini. Apa yang penting ialah apa yang melepasi garis "selesai" sebelum sprint tamat. Jika Sprint 3 kelihatan rendah, siasat puncanya (perubahan skop? halangan di tengah sprint? cuti umum?) berbanding mengabaikannya atau menggelembungkannya.
Cara Menggunakan Velocity untuk Ramalan
Sebaik sahaja anda mempunyai velocity yang stabil, anda boleh menjawab soalan yang akhirnya ditanya oleh setiap pihak berkepentingan: "Bila ini akan siap?"
Pendekatannya mudah. Jumlahkan story point pada backlog yang tinggal (atau bahagian backlog untuk sesuatu pelancaran), kemudian bahagikan dengan purata velocity anda.
Sprint sehingga siap = Mata backlog yang tinggal / Purata velocity
Katakan pasukan anda mempunyai 210 mata yang tinggal dalam backlog pelancaran dan velocity 42. Itu bermakna 5 sprint, atau 10 minggu pada kadar 2 minggu. Itulah ramalan anda.
Beberapa amalan menjadikan ini lebih berguna dalam praktik:
- Gunakan julat, bukan satu anggaran tepat. Masukkan keputusan sprint terkini terendah dan tertinggi anda untuk mendapatkan jalur keyakinan. "Antara 4.5 dan 6 sprint" lebih jujur berbanding "tepat 5."
- Ramal semula setiap sprint. Apabila pasukan menyelesaikan kerja, menambah item baharu, atau mengurangkan skop, unjuran itu berubah. Layan ia sebagai nombor hidup, bukan kontrak.
- Hubungkan velocity dengan tabiat penghalusan backlog anda. Ramalan velocity hanya sebaik perancangan sprint yang memastikan backlog bersaiz dan tersusun dengan baik. Jika anggaran melencong atau backlog menjadi usang, velocity kehilangan kuasa ramalannya.
- Kaitkan dengan pencapaian penting roadmap. Jika roadmap anda menyatakan sesuatu ciri akan dilancarkan pada Q3, kerja ke belakang daripada tarikh akhir untuk melihat berapa banyak sprint yang anda ada, darabkan dengan velocity, dan semak sama ada skop yang tinggal muat. Jika tidak, anda ada perbualan skop atau garis masa yang perlu dijalankan lebih awal, bukan pada tarikh akhir.
Kaedah ramalan ini juga sesuai digandingkan dengan planning poker, yang membantu memastikan anggaran story point kekal ditentukur merentas pasukan supaya velocity kekal bermakna dari semasa ke semasa.
Apa Yang BUKAN Velocity
Di sinilah kebanyakan pasukan tersilap.
Velocity bukan metrik produktiviti. Pasukan dengan velocity 60 bukan "lebih baik" daripada pasukan dengan velocity 30. Story point adalah relatif kepada skala setiap pasukan sendiri. Satu pasukan mungkin menyaiz sesuatu ciri pada 8 mata; pasukan lain mungkin menyaiz ciri yang sama pada 3 mata. Tiada unit kongsi. Membandingkan velocity merentas pasukan tidak bermakna.
Velocity bukan sasaran untuk ditingkatkan. Apabila pengurus menetapkan "tingkatkan velocity sebanyak 20%" sebagai matlamat, pasukan melakukan tepat satu perkara yang boleh diramal: mereka menggelembungkan anggaran story point mereka. Nombor itu meningkat, tetapi output sebenar tidak berubah. Anda baru sahaja merosakkan penentukuran sistem anggaran anda.
Velocity bukan ukuran prestasi individu. Velocity kepunyaan pasukan, bukan kepunyaan seseorang individu. Menggunakannya untuk menilai individu mencipta insentif yang salah dan merosakkan anggaran kolaboratif yang menjadikan metrik ini tepat.
Velocity bukan komitmen. Pihak berkepentingan kadangkala melayan velocity sebagai lantai: "Anda menyiapkan 44 mata sprint lepas, jadi anda komited kepada sekurang-kurangnya 44 sprint ini." Bukan begitu ia berfungsi. Velocity ialah purata sejarah yang digunakan untuk perancangan, bukan obligasi daya pengeluaran minimum.
Faktor Yang Mempengaruhi Velocity
Velocity berubah dari semasa ke semasa, dan kebanyakan perubahan itu mempunyai punca yang jelas. Mengetahui apa yang mendorong variasi membantu anda mentafsir nombor tersebut berbanding bertindak balas terhadapnya.
Perubahan komposisi pasukan. Apabila seseorang yang baharu menyertai, velocity biasanya menurun selama 2 hingga 3 sprint semasa mereka menyesuaikan diri. Apabila seseorang meninggalkan pasukan, kesannya serta-merta. Kedua-dua perubahan itu tidak bermakna pasukan itu gagal.
Cuti umum dan cuti peribadi. Sprint yang merentangi cuti umum atau mempunyai ramai orang bercuti akan menghasilkan velocity yang lebih rendah. Sesetengah pasukan menyesuaikan kapasiti sprint mereka; yang lain hanya mencatatnya semasa menyemak purata.
Perubahan skop di tengah sprint. Menarik masuk kerja yang tidak dirancang atau menukar story separuh jalan melalui sprint merosakkan hubungan antara apa yang dirancang dan apa yang diselesaikan. Ini adalah salah satu sebab mengapa had WIP penting: mengehadkan kerja dalam proses melindungi sprint daripada gangguan pertengahan.
Lencongan anggaran. Sepanjang beberapa bulan, pasukan kadangkala secara tidak sedar mengubah cara mereka menyaiz kerja. "Story 5 mata" pada bulan pertama mungkin terasa seperti "story 3 mata" pada bulan keenam apabila pasukan menjadi lebih pantas dengan kerja serupa. Jika velocity meningkat secara konsisten tanpa sebarang perubahan pada saiz pasukan atau alat, semak sama ada anggaran telah melencong berbanding menganggap pasukan itu benar-benar lebih pantas.
Hutang teknikal dan geseran persekitaran. Talian paip CI yang perlahan, insiden pengeluaran yang kerap, dan isu kualiti kod menghabiskan kapasiti sprint tanpa muncul dalam backlog. Pasukan yang membawa hutang teknikal yang ketara sering mempunyai velocity yang lebih rendah dan lebih tidak menentu berbanding apa yang disarankan oleh kapasiti mereka.
Velocity vs Metrik Aliran Lain
Velocity ialah metrik peringkat sprint. Ia memberitahu anda tentang daya pengeluaran merentas kotak masa tetap. Tetapi ia tidak memberitahu anda segalanya tentang bagaimana kerja mengalir melalui sistem anda.
| Metrik | Apa Yang Diukur | Paling Sesuai Untuk |
|---|---|---|
| Velocity | Story point selesai setiap sprint | Ramalan pelancaran, kapasiti sprint |
| Rajah aliran kumulatif | Kiraan item kerja merentas peringkat aliran kerja dari semasa ke semasa | Mengesan kesesakan, pertumbuhan WIP, kestabilan aliran |
| Had WIP | Item serentak maksimum dalam satu peringkat | Pengoptimuman daya pengeluaran, mengurangkan pertukaran konteks |
| Masa kitaran | Masa dari mula hingga selesai bagi setiap item | Kebolehramalan pada peringkat item |
| Carta burndown | Kerja yang tinggal dalam sesuatu sprint atau pelancaran | Kesihatan sprint masa nyata |
Velocity dan rajah aliran kumulatif saling melengkapi. Velocity memberikan anda nombor ramalan peringkat sprint; CFD menunjukkan sama ada aliran kerja anda cukup sihat untuk mengekalkannya. Pasukan dengan velocity yang baik tetapi CFD yang tidak stabil (jalur WIP yang berkembang, persilangan jalur yang kerap) sedang menuju ke arah penurunan velocity.
Cara Meningkatkan (Menstabilkan) Velocity
Matlamatnya bukan untuk memaksimumkan velocity. Ia adalah untuk menjadikan velocity boleh diramal, supaya ramalan anda boleh dipercayai. Berikut ialah caranya.
Jalankan sprint yang konsisten. Panjang sprint yang berubah-ubah (bertukar antara 1 minggu dan 2 minggu) menjadikan data velocity tidak boleh dibandingkan. Pilih satu kadar dan kekalkannya sekurang-kurangnya 6 sprint sebelum membuat kesimpulan.
Selesaikan definisi selesai sebelum menutup story. Jika definisi selesai pasukan anda kabur, story melencong merentasi garis selesai pada tahap kualiti yang berbeza, menjadikan mata tidak boleh dibandingkan. Perjelaskan definisi tersebut dan kuatkuasakannya.
Lindungi sprint daripada kerja yang tidak dirancang. Setiap "kebakaran" di tengah sprint yang menarik seorang pembangun keluar adalah pukulan langsung kepada velocity. Bina proses triage yang ringan (penapis pemilik produk, peraturan "pecahkan kaca") yang menyalurkan item mendesak tanpa merosakkan komitmen sprint.
Kekalkan anggaran ditentukur. Jalankan latihan penentukuran semula yang ringkas setiap suku tahun. Ambil 5 hingga 10 story yang telah selesai dan anggar semula dengan pasukan semasa. Jika anggaran baharu berbeza dengan ketara daripada yang asal, data velocity anda sebelum peralihan itu memerlukan pelarasan mental.
Jejaki punca sprint luar biasa. Apabila velocity melonjak atau menurun lebih 20% daripada purata bergerak, catatkan puncanya dalam retrospektif sprint anda. Corak akan menjadi jelas: jika sprint yang melibatkan cuti secara konsisten menurun 25%, anda boleh mengambil kira itu dalam perancangan kapasiti.
Gunakan penghalusan backlog secara konsisten. Item backlog yang belum dihalus menghasilkan anggaran yang tidak boleh dipercayai, yang menghasilkan velocity yang bising. Pasukan yang menghalus secara berkala mengekalkan velocity yang lebih stabil kerana mereka bekerja daripada story yang difahami dengan baik dan bersaiz betul.
Kurangkan pertukaran skop. Perubahan skop yang kerap di tengah sprint adalah pendorong terbesar bagi ketidakstabilan velocity untuk kebanyakan pasukan. Sprint yang stabil dengan perubahan skop yang minimum menghasilkan velocity yang stabil.
Soalan Lazim
Berapa banyak sprint data yang saya perlukan sebelum velocity boleh dipercayai? Kebanyakan pengamal mengesyorkan sekurang-kurangnya 5 hingga 6 sprint yang selesai sebelum melayan velocity sebagai input ramalan. Sebelum itu, anda melihat sampel yang terlalu kecil untuk menapis bunyi bising. Sepanjang beberapa sprint pertama, layan velocity sebagai petunjuk arah, bukan ramalan.
Bagaimana jika velocity kami berubah secara mendadak dari sprint ke sprint? Varians yang tinggi biasanya menandakan salah satu daripada beberapa perkara: panjang sprint yang tidak konsisten, perubahan skop yang kerap di tengah sprint, pasukan yang baru berubah, atau lencongan anggaran. Mulakan dengan mencatatkan punca setiap sprint luar biasa dalam retrospektif anda. Sebaik sahaja anda boleh menerangkan variasi itu, anda boleh menangani punca sebenar berbanding sekadar mengambil purata sekitar bunyi bising itu.
Patutkah kami berkongsi velocity dengan pihak berkepentingan? Kongsi ramalan pelancaran, bukan nombor mentah. Pihak berkepentingan yang melihat angka velocity secara berasingan sering melayannya sebagai sasaran atau penanda aras berbanding pasukan lain. Ramalan itu ("pelancaran ini berada di landasan untuk Q3 berdasarkan kadar semasa") memberikan mereka apa yang diperlukan tanpa mencipta tekanan yang salah.
Bolehkah kami menggunakan velocity tanpa story point? Ya. Sesetengah pasukan menjejaki velocity mengikut bilangan story berbanding mata, yang berfungsi jika story mereka konsisten dari segi saiz. Yang lain menggunakan saiz T-shirt yang ditukar kepada skala berangka. Kuncinya ialah unit apa sahaja yang anda gunakan kekal konsisten cukup lama untuk membina purata yang bermakna.
Bagaimana velocity berbeza daripada kapasiti? Kapasiti ialah ketersediaan yang dirancang (jumlah jam pasukan dalam satu sprint). Velocity ialah daya pengeluaran sebenar (mata selesai). Kapasiti ialah input; velocity ialah output. Pasukan kadangkala menggunakan kapasiti untuk menetapkan matlamat sprint, tetapi mereka menggunakan velocity untuk meramal pelancaran akan datang. Mencampur adukkan kedua-duanya membawa kepada terlebih komited: sprint pada 100% kapasiti tidak menjamin 100% mata yang dirancang akan selesai.
Velocity ialah nombor yang mudah, tetapi pasukan mendapat manfaat paling banyak apabila mereka berhenti mengejarnya dan mula membacanya. Velocity yang stabil bermakna tabiat anggaran dan penghantaran anda cukup konsisten untuk dirancang. Apabila velocity berubah, itu adalah maklumat: sesuatu dalam persekitaran atau proses pasukan telah berubah, dan ia berbaloi untuk difahami.
Gandingkan ia dengan disiplin perancangan sprint, anggaran story point yang bersih, dan keterlihatan aliran daripada rajah aliran kumulatif anda, dan anda mempunyai sistem ramalan yang benar-benar boleh dipercayai oleh pihak berkepentingan.
