ROI Calculation: Quantifying Value in Financial Terms Buyers Understand
Turn this article into takeaways for your work.
Each assistant summarizes the article only for you and suggests best practices for your work.
An enterprise software company analyzed their pipeline and found that deals with quantified ROI closed 2.7 times faster than deals without ROI analysis. When they made ROI calculation mandatory for all opportunities above $50K, their average sales cycle decreased from 147 days to 89 days while win rates improved from 34% to 51%. The ROI calculations didn't change their product or value. They simply translated value into financial terms that buyers needed for internal approvals and made purchase decisions dramatically easier.
Deals with quantified ROI close 2-3 times faster because they provide the financial justification buyers need to secure approvals, compare alternatives objectively, and move forward confidently. Without ROI, purchases require faith. With ROI, purchases become data-driven decisions backed by financial analysis that finance teams and executives understand and respect. This financial clarity is especially critical when engaging with executive decision-makers who need concrete numbers to justify investments.
Most vendors claim strong ROI but few provide rigorous calculations with transparent assumptions, credible data sources, and conservative projections. The difference between claimed ROI and credible ROI is methodology, rigor, and transparency. Buyers trust ROI calculations built on their data, validated through their assumptions, and presented with honest acknowledgment of uncertainty and risk.
ROI Fundamentals
Return on Investment measures financial return generated by an investment relative to its cost. The basic formula is simple: (Benefits minus Costs) divided by Costs, expressed as percentage. If benefits are $500K and costs are $200K, ROI is 150%, you gain $1.50 for every $1.00 invested.
In B2B software, ROI encompasses software subscription costs, implementation expenses, training and change management, ongoing support and maintenance, plus internal resources allocated. Benefits include revenue increases, cost reductions, productivity gains, risk mitigation, and quality improvements.
ROI importance in B2B extends beyond financial returns. It forces disciplined thinking about value delivery, creates shared language between buyers and sellers, provides objective basis for comparing alternatives, enables internal advocacy by champions, and establishes success metrics for post-purchase validation. Strong ROI calculations also help you develop internal champions who can advocate for your solution with financial evidence.
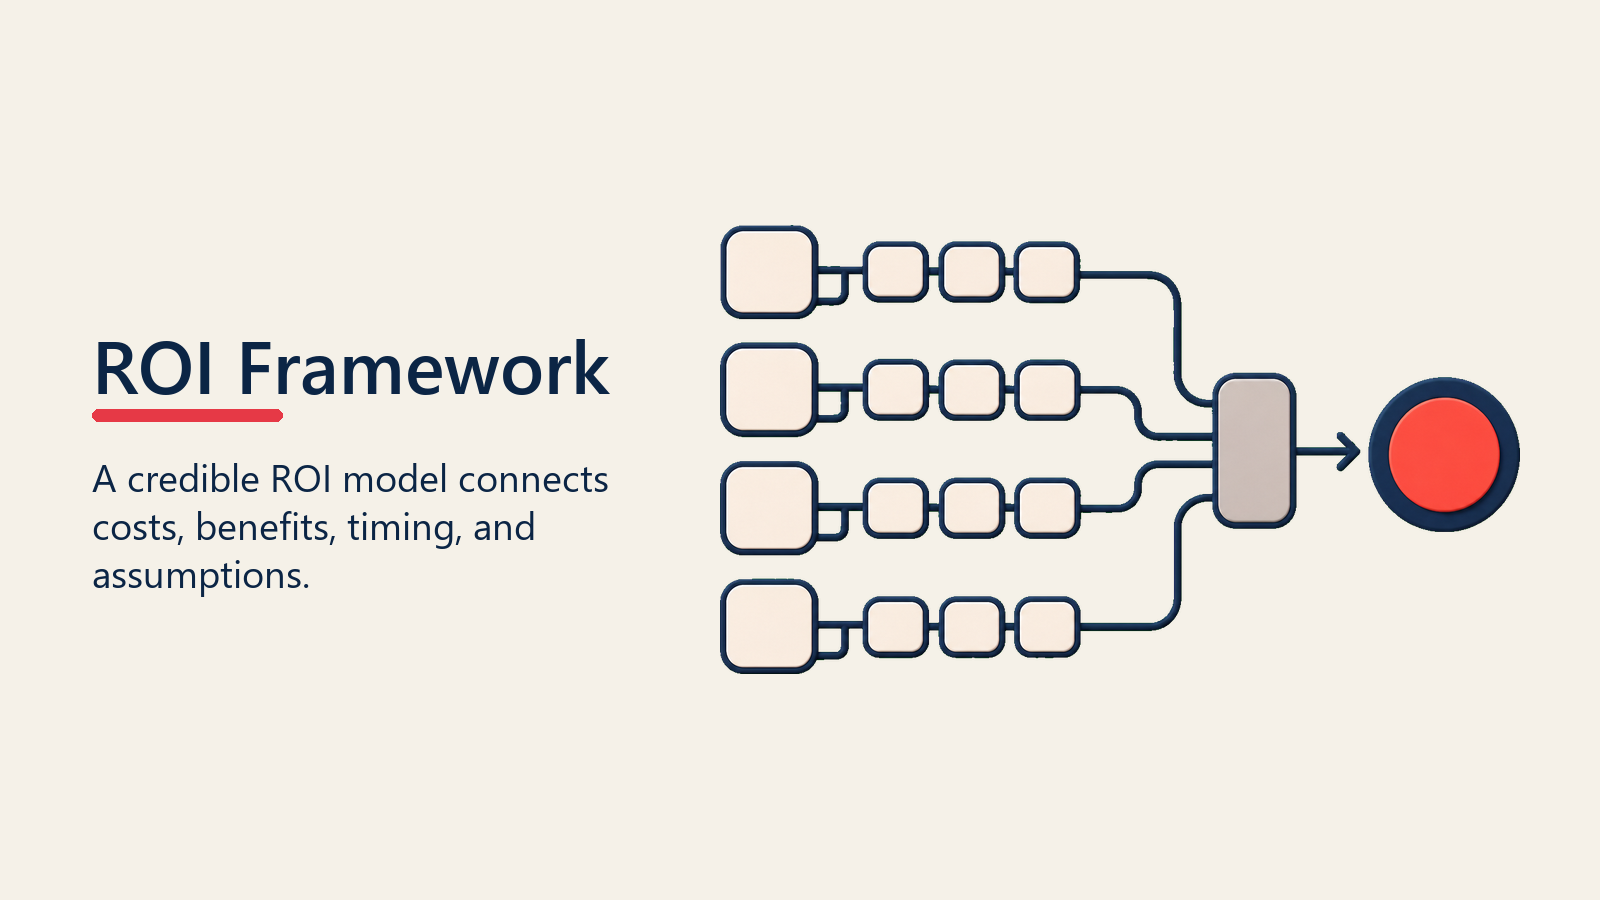
The ROI Framework
ROI combines measurable benefits, full costs, and time value so buyers can compare the investment against other priorities.
Total Benefits
Calculate all quantifiable benefits comprehensively. Revenue benefits include increased sales from faster response, higher win rates from better capabilities, expanded deal sizes from enhanced offerings, improved retention increasing lifetime value, and faster sales cycles enabling more deals annually.
Cost reduction benefits include eliminated software licenses, reduced labor through automation, consolidated infrastructure, decreased external services, and eliminated waste from errors or rework. Productivity benefits convert time savings to financial value using fully-loaded labor costs.
Risk mitigation benefits value reduced probability or impact of negative events: compliance violations, security breaches, quality issues, customer dissatisfaction, or operational failures. Risk benefits use expected value calculations: probability times impact.
Total Costs
Document complete ownership costs. Initial costs include software licenses or subscriptions (year one), implementation services and configuration, data migration and integration, training and change management, hardware or infrastructure if required, and internal resources allocated to implementation.
Ongoing costs include annual subscription or license fees, support and maintenance, infrastructure and hosting, upgrades and enhancements, and internal resources for administration. Calculate costs over 3-5 year periods to capture full ownership costs.
Time Value
Account for timing of benefits and costs. Implementation costs occur upfront. Benefits accrue over time. Dollar received in year three is worth less than dollar received today due to time value of money. Use net present value calculations that discount future cash flows to present value.
Apply appropriate discount rates (typically 8-12% for corporate investments). Higher discount rates favor solutions with faster payback. Lower discount rates favor solutions with sustained long-term benefits. These financial considerations become crucial when structuring multi-year deals where timing of costs and benefits significantly impacts decision-making.
ROI Formula
Standard ROI formula: (Total Benefits - Total Costs) / Total Costs. Express as percentage. 100% ROI means you doubled your money. 50% ROI means you gained 50% beyond your investment. Negative ROI means costs exceeded benefits.
Alternative metrics complement ROI percentage: payback period (months until cumulative benefits exceed cumulative costs), net present value (present value of benefits minus present value of costs), and internal rate of return (discount rate that makes NPV equal zero).
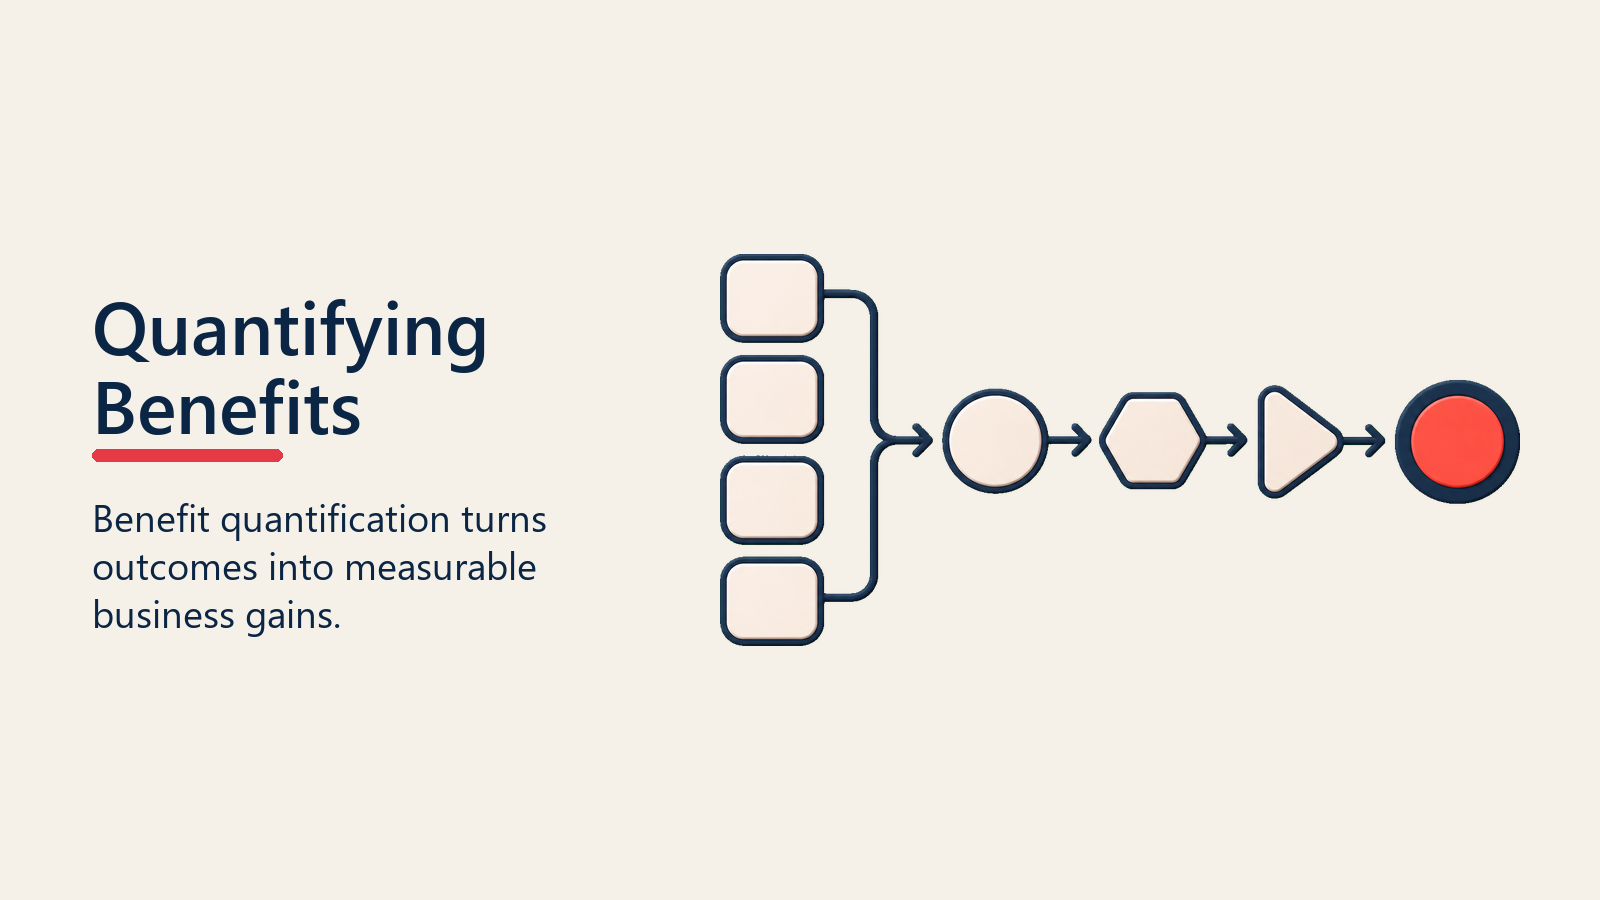
Quantifying Benefits
Benefit quantification works best when revenue, cost, productivity, risk, and quality gains are separated before being combined.
Revenue Increase
Calculate revenue impact through specific mechanisms. If solution enables faster lead response and improves conversion by 2 percentage points, calculate impact: leads per month times conversion improvement times average deal size.
Example: "Your team handles 800 inbound leads monthly with 15% conversion to $50K average deals. Industry data shows responding within 5 minutes instead of 2 hours improves conversion by 2-3 percentage points. Using conservative 2% improvement: 800 leads times 2% times $50K equals $800K monthly or $9.6M annually."
Retention impact requires understanding customer lifetime value. If solution improves retention by 5 percentage points through better service, calculate value: number of customers times retention improvement times average annual value times expected relationship duration.
Cost Reduction
Quantify cost reductions precisely. Identify current costs being eliminated or reduced: labor hours times fully-loaded rate, software licenses no longer needed, external services being replaced, or infrastructure being consolidated.
Example: "Your AP team spends 40 hours weekly processing invoices manually. At $75/hour fully loaded, that's $156K annually. Our automation reduces manual processing by 70%, saving $109K annually while improving accuracy and speed."
Calculate fully-loaded labor costs accurately. Salary is typically 60-70% of fully-loaded cost after including benefits, taxes, overhead, and facilities. Use $75-100 per hour for individual contributors, $100-150 for managers, $150-200 for directors as rough guidelines.
Productivity Gains
Convert time savings to financial value. If solution saves each rep 5 hours weekly, that's 260 hours annually per rep. With 50 reps earning $100K annually (roughly $50/hour with full loading), time savings value is 260 hours times 50 reps times $50/hour equals $650K annually.
Throughput gains calculate differently. If solution enables team to process 100 transactions daily instead of 75 (33% improvement), calculate value of additional throughput: 25 extra transactions times 250 business days times value per transaction.
Risk Mitigation
Value risk reduction using expected value: probability of adverse event times cost if it occurs. If annual probability of compliance violation is 5% with $500K penalty and fines, expected cost is $25K annually. Solution reducing probability to 1% saves $20K annually in expected risk cost.
Security breach risk follows similar logic. If breach probability is 2% annually with $3M average impact (remediation, fines, customer loss), expected annual cost is $60K. Security improvements reducing probability to 0.5% save $45K annually.
Quality Improvement
Quality improvements have financial value through error reduction, rework elimination, customer satisfaction improvement, and brand protection. If current process has 5% error rate requiring rework at $200 per error correction and you process 10,000 transactions monthly, annual error cost is $1.2M. Reducing errors to 1% saves $960K annually.
Customer satisfaction improvements translate to retention, expansion, and referrals. Use historical data connecting satisfaction scores to these outcomes. If 10-point NPS improvement correlates to 3% better retention and your customer base generates $50M annually, the value is $1.5M annually.
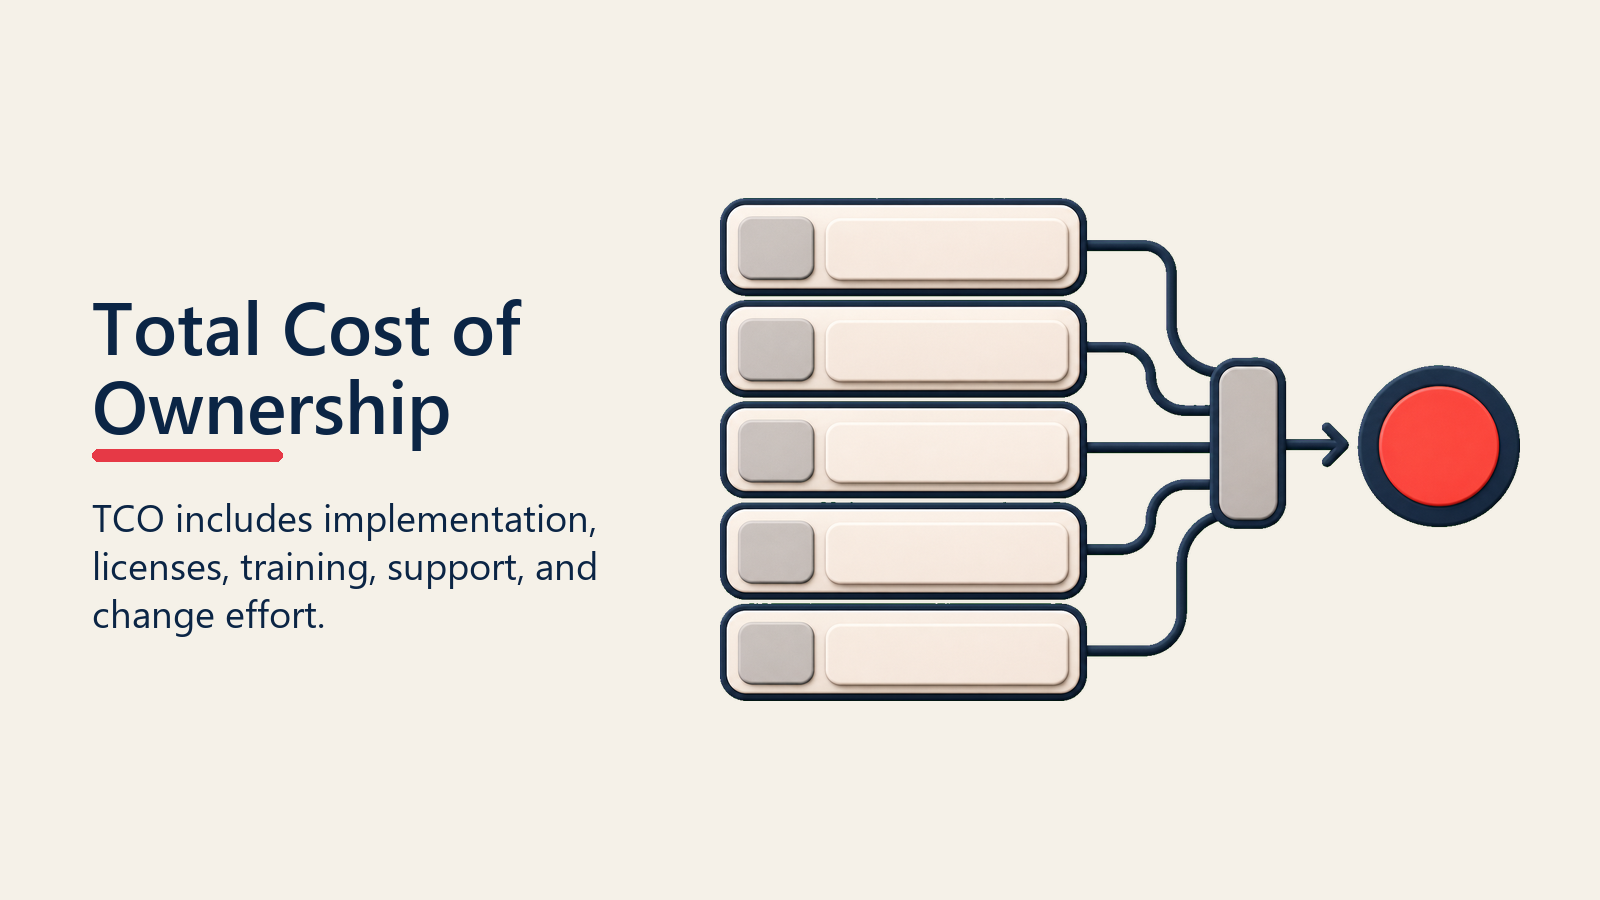
Calculating Total Cost of Ownership
Total cost of ownership includes the visible purchase price plus implementation, operations, change management, and hidden costs.
Initial Investment
Document all upfront costs: software licensing or year-one subscription, implementation and configuration services, integration development, data migration, training program development and delivery, hardware or infrastructure if required, and internal project team allocation.
Get specific quotes for professional services. Rough estimates undermine credibility. If implementation is $75K-125K, provide $100K as expected cost with ranges.
Implementation Costs
Implementation costs often surprise buyers who focus only on subscription pricing. Include internal resource costs: project manager (25% allocation for 4 months), IT resources (2 people, 50% allocation for 3 months), and business resources for requirements and testing.
Calculate internal costs using loaded rates. Project manager at $120K salary fully loaded to $180K costs $3,750 per week. At 25% allocation for 16 weeks, that's $15K.
Training and Change Management
Training costs include instructor time, participant time away from work, materials development, and ongoing support. For 200 users requiring 4 hours training each, that's 800 user-hours. At $50/hour fully loaded, training costs $40K in opportunity cost plus instructor costs.
Change management includes communication, stakeholder management, resistance mitigation, and adoption tracking. Estimate 10-15% of implementation budget.
Ongoing Operating Costs
Annual operating costs include subscription or maintenance fees (often escalating 3-5% annually), infrastructure and hosting if applicable, support and administration (internal resources), upgrades and enhancements, and additional user licenses as you grow.
Project these costs over 3-5 years. Year-over-year increases should reflect realistic growth and escalation. If subscription is $100K year one, it might be $105K year two and $110K year three assuming 5% escalation. These cost projections directly influence your pricing negotiation strategy and how you present total investment to buyers.
Hidden Costs
Identify hidden costs: integration maintenance as systems evolve, report development and customization, data quality management, compliance and audit activities, and productivity losses during adoption.
Indirect costs might include workflow changes affecting other systems, staff turnover requiring retraining, or organizational impacts of process changes.
ROI Calculation Methods
Different ROI methods answer different buyer questions about return, payback speed, present value, and investment efficiency.
Simple ROI Percentage
Basic ROI: (Benefits - Costs) / Costs times 100%. If 3-year benefits are $2.5M and costs are $800K, ROI is 213%.
Show ROI progression over time. Year one might be negative ROI due to implementation costs and partial benefits. Year two shows positive ROI as benefits ramp. Year three shows full ROI with mature adoption.
Payback Period
Calculate months or years until cumulative benefits equal cumulative costs. If implementation costs $300K and you pay $100K annually for subscription with $60K monthly benefits ($720K annually), net annual benefit is $620K. Payback occurs at approximately 5.8 months.
Payback period communicates risk clearly. Faster payback (under 12 months) represents low-risk investment. Longer payback (24+ months) requires confidence in sustained benefits. Most B2B software targets 12-18 month payback.
Net Present Value (NPV)
NPV discounts future cash flows to present value using discount rate (cost of capital). Calculate present value of each year's net benefit (benefits minus costs), sum them, and subtract initial investment. Positive NPV means investment creates value after accounting for time value of money.
Example: $100K implementation cost today, year one net benefit $200K, year two $300K, year three $300K. Using 10% discount rate: Year 1 PV = $200K / 1.1 = $182K. Year 2 PV = $300K / 1.21 = $248K. Year 3 PV = $300K / 1.331 = $225K. Total PV = $655K. NPV = $655K - $100K = $555K.
Internal Rate of Return (IRR)
IRR is the discount rate that makes NPV equal zero. It represents the effective annual return on investment. If IRR is 45%, the investment effectively yields 45% annual return. Compare IRR to organization's hurdle rate (minimum acceptable return, typically 15-20% for technology investments).
Building Credible Assumptions
Data Sources
Use customer's data whenever possible. Their labor costs, transaction volumes, error rates, and current system costs have credibility that generic benchmarks lack. Ask: "What's your current cost for this process?"
When customer data unavailable, use validated industry benchmarks from analyst firms, academic research, or industry associations. Cite sources explicitly: "According to Gartner research, average fully-loaded cost for finance analysts is $85/hour in mid-market companies."
Have customers validate assumptions. Walk through ROI calculations together: "I'm assuming 40% efficiency improvement based on similar customer results. Does that seem realistic for your environment, or should we use more conservative assumptions?"
Conservative vs Optimistic
Use conservative projections that stakeholders will believe. Optimistic ROI that buyers question as unrealistic undermines entire business case. Conservative ROI that still justifies investment is far more persuasive.
Provide range estimates: conservative case (50% of target benefits), base case (100% of target benefits), and optimistic case (150% of target benefits). Show that even conservative case generates acceptable ROI.
Documenting Methodology
Document every assumption and calculation step. What data sources did you use? What formulas did you apply? What growth rates did you assume? Transparent methodology enables buyers to verify calculations, adjust assumptions, and defend analysis to colleagues.
Provide calculation spreadsheets that let buyers modify assumptions and see updated ROI. Interactive ROI models give buyers agency and let them explore scenarios.
Sensitivity Analysis
Test ROI across assumption variations. Key variables to test: benefit realization percentage (what if actual benefits are 20% lower?), adoption timeline (what if full adoption takes 6 months longer?), cost increases (what if implementation costs 25% more?), and discount rate (how does NPV change across discount rates?).
Create sensitivity tables showing ROI across different assumption combinations. If ROI remains positive even with 30% lower benefits and 25% higher costs, the business case is robust.
Scenario planning builds confidence. Best case, expected case, and worst case scenarios show ROI range. If worst case still generates acceptable return, buyers feel comfortable proceeding. This approach also helps you address risk concerns by demonstrating that even conservative projections justify the investment.
Presenting ROI
ROI presentation should translate the calculation into formats executives and evaluators can use in the buying decision.
Making Numbers Compelling
Present ROI in multiple formats: percentage (213% ROI over 3 years), absolute dollars ($1.7M net benefit over 3 years), payback period (7 months to recoup investment), and equivalent metrics (saving 15 FTE equivalents annually).
Use visual presentation: bar charts comparing benefits to costs, waterfall charts showing ROI buildup, timeline graphics showing payback progression, and dashboard-style summaries with key metrics highlighted.
Tell the ROI story: "Today you spend $500K annually on manual processes. Our solution costs $150K year one including implementation, then $100K annually. It eliminates $400K in manual process costs starting in month four. By month 7, you've recouped your investment. By year three, you've saved net $950K while improving speed and accuracy."
Addressing Skepticism
Anticipate skepticism about ROI claims. Address concerns proactively: "You may wonder if 40% efficiency improvement is realistic. We've seen 35-55% improvements across 50 similar implementations. I'm using 40% as conservative middle estimate. There are three customer references you can call to validate results."
Acknowledge uncertainty: "These projections depend on assumptions about adoption, integration complexity, and benefit realization. I've used conservative assumptions throughout. Even if actual benefits are 25% lower than projected, ROI still exceeds 100% with 11-month payback."
Offer proof points: customer case studies with documented results, pilot program data from their environment, or trial results showing early benefits.
Common Mistakes
ROI mistakes weaken trust because buyers can spot inflated benefits, hidden costs, and assumptions that do not reflect their reality.
Overstating Benefits
Avoid claiming every theoretical benefit without realistic achievement assessment. If you claim 80% time savings, buyers question credibility. More believable is 40-50% savings with evidence from comparable implementations.
Understating Costs
Don't hide costs to inflate ROI. Buyers discover hidden costs during implementation, damaging trust and creating post-sale dissatisfaction. Include all costs upfront: subscription, implementation, integration, training, change management, ongoing support, and internal resources.
Ignoring Time Value
Presenting multi-year ROI without considering time value of money lacks financial sophistication. $100K benefit in year three is worth less than $100K today. Use NPV or explicitly discount future cash flows.
Unrealistic Assumptions
Assumptions that don't pass buyer scrutiny undermine entire ROI calculations. If you assume 100% adoption in 30 days, buyers know that's unrealistic. Use assumptions that reflect typical implementation challenges, adoption curves, and real-world complexity.
Failing to Validate
Building ROI in isolation without customer input creates calculations buyers don't believe or own. Collaborative ROI development where customers provide data, validate assumptions, and agree on methodology creates business cases buyers will advocate for internally. This collaborative approach should be documented in your mutual action plan to ensure alignment throughout the buying process.
ROI Tools
Interactive Calculators
Build web-based or spreadsheet ROI calculators that prospects can use interactively. Input their specific variables (user counts, transaction volumes, current costs) and calculator produces instant ROI analysis.
Provide calculator templates that buyers can customize with their data. Editable spreadsheets let them adjust every assumption to reflect their reality.
Benchmarking Databases
Maintain databases of actual customer results: typical efficiency gains, adoption timelines, cost reductions achieved, and payback periods realized. Use this data to inform conservative projections and provide evidence for ROI claims.
Reference specific customer results: "Mid-market financial services companies typically see 35-45% reduction in month-end close time. Using 40% for your calculation..."
ROI Reporting for Customers
Calculate actual ROI for existing customers post-implementation. Document realized benefits, actual costs, and net returns. Use these validated ROI results as case studies for prospects.
Share ROI validation reports with customers showing documented value delivered. This reinforces their purchase decision, strengthens the relationship, and creates champions who can reference actual ROI.
Making ROI Work
ROI calculation isn't about generating the biggest numbers. It's about building credible, defensible financial justification that buyers trust and can defend to their colleagues. Companies that excel at ROI use customer data, conservative assumptions, transparent methodology, and collaborative validation to create business cases that withstand scrutiny.
Make ROI calculation standard practice for deals above defined thresholds. Develop templates and tools that enable consistent, rigorous analysis. Train teams on financial analysis, assumption documentation, and presentation skills. Track correlation between ROI quality and win rates.
The best ROI calculations feel like joint analysis conducted by buyer and seller together, not vendor claims. They use customer's data, reflect customer's priorities, acknowledge uncertainty transparently, and result in financial justifications that internal stakeholders trust.
Review your ROI methodology regularly. Are your projections proving accurate post-implementation? Which benefit categories resonate most with buyers? What assumptions most often require adjustment? Use this learning to refine your approach continuously. ROI excellence is a competitive advantage that directly impacts close rates and cycle times.
Learn More
- Business Case Creation - Build comprehensive business cases that integrate ROI calculations
- Value Reinforcement - Reinforce ROI claims throughout the sales cycle with consistent value messaging
- Proposal Development - Integrate ROI analysis into compelling proposals that win deals
- Price Objections - Use ROI to overcome price objections by shifting focus to value
- Closing Readiness Assessment - Evaluate whether your ROI analysis has adequately prepared the deal to close
