Business Case Creation: Building Quantified Justification for Purchase
Turn this article into takeaways for your work.
Each assistant summarizes the article only for you and suggests best practices for your work.
A sales enablement director analyzed 150 stalled enterprise deals and found that 76% lacked documented business cases. Champions liked the product, trials went well, and technical validation succeeded. But without quantified business justification, deals couldn't progress through approval processes. When they implemented mandatory business case creation for all deals above $100K, their close rate improved from 31% to 52%. The business cases didn't change the product or pricing. They simply provided buyers with the financial justification needed to get deals approved.
The internal selling challenge is often more difficult than external selling. Your champion must convince colleagues, justify budget allocation, compete for resources, and navigate organizational politics. Without strong business cases that quantify value, demonstrate ROI, and address risk, champions lack the ammunition needed for internal advocacy.
Business case creation is not a vendor exercise. It's collaborative work between you and your customer to build quantified justification that both parties believe is credible. The best business cases use customer data, customer assumptions, and customer priorities to calculate returns that their organization will recognize as valid. Generic ROI claims from vendors lack credibility. Customer-specific business cases built collaboratively become powerful tools for internal approval.
Why Business Cases Matter
The Internal Selling Challenge
B2B purchases require internal consensus across multiple stakeholders: end users must want to use it, IT must approve technical fit and integration, security must validate compliance and risk management, finance must approve cost and ROI, procurement must negotiate terms, and executives must prioritize it against competing investments.
Your champion navigates this internal landscape. They present your solution in meetings you don't attend, answer questions you haven't anticipated, and defend your value against skepticism you haven't heard. Understanding the enterprise buying process helps you build business cases that address each stakeholder's concerns.
Business cases serve as internal selling documents. They provide champions with the data, logic, and financial justification needed to build consensus. Well-constructed business cases address each stakeholder's concerns: business value for executives, operational benefits for end users, technical feasibility for IT, risk management for security, and financial returns for finance.
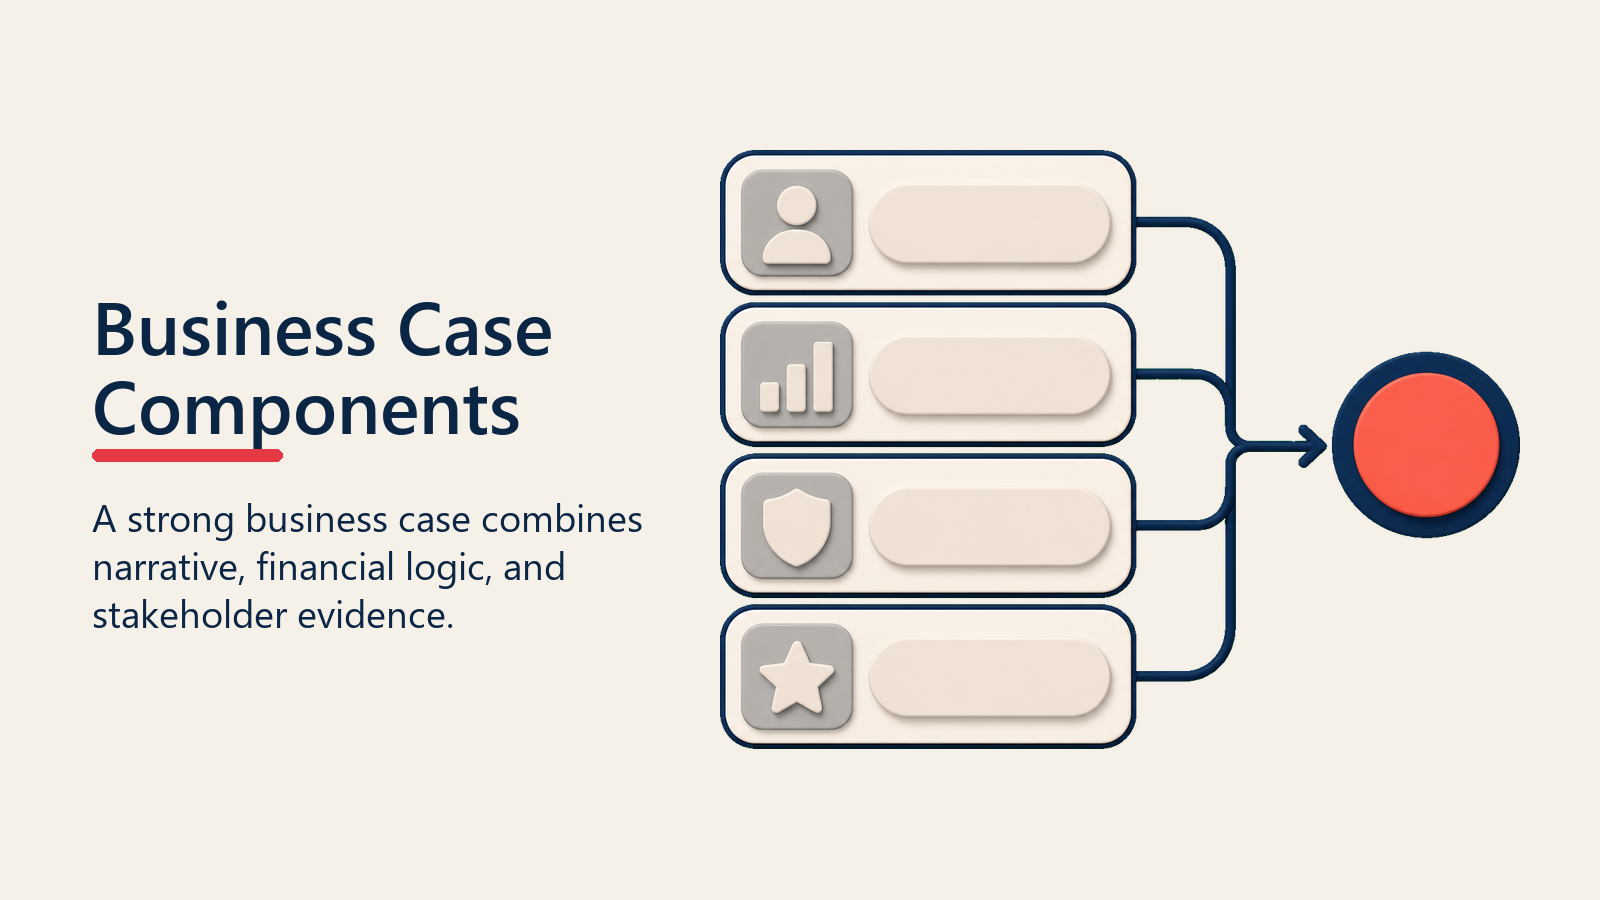
Business Case Components
A strong business case combines strategic narrative, financial logic, and stakeholder-specific evidence into one internal selling document.
Problem Statement and Current State
Establish the business problem and current state costs. What specific challenges exist? What's the business impact? What does the current state cost in direct spending, indirect inefficiency, or opportunity cost? Quantify current state comprehensively because the gap between current and future state becomes your ROI.
Use customer's data whenever possible. If they spend $500K annually on manual processes you'll automate, document that spending. Customer-specific data has far more credibility than generic industry benchmarks.
Structure current state analysis systematically: direct costs (labor, systems, external services), indirect costs (inefficiency, errors, delays), opportunity costs (revenue not captured, market share not gained), and risk costs (compliance failures, security incidents, customer dissatisfaction).
Proposed Solution and Future State
Describe the future state enabled by your solution. How will processes work differently? What capabilities will they gain? What outcomes will improve? Paint a concrete picture of the transformed state that stakeholders can visualize.
Quantify future state improvements: reduced process time from 10 days to 3 days, decreased error rates from 15% to 2%, increased productivity from 80 units daily to 120 units, or improved customer satisfaction from 72% to 88%.
Connect future state to their strategic objectives. If they're pursuing operational excellence, show how your solution advances that goal. If they're focused on customer experience, demonstrate customer impact.
Financial Analysis and ROI
Calculate financial returns comprehensively: total benefits, total costs, net benefits, ROI percentage, payback period, and net present value. This financial analysis provides the core justification finance teams and executives require.
Structure financial analysis over 3-5 years. Year one includes implementation costs and partial benefits as adoption ramps. Years 2-5 show full run-rate benefits. Multi-year analysis demonstrates sustained value beyond initial implementation.
Use conservative assumptions that stakeholders will believe. Optimistic ROI that stakeholders question as unrealistic undermines credibility. Conservative ROI that still justifies investment is far more persuasive because stakeholders trust the analysis. For detailed guidance on building credible calculations, see our guide on ROI calculation methodology.
Risk Assessment and Mitigation
Address implementation risks and mitigation strategies: technical integration challenges, organizational change management, adoption resistance, cost overruns, timeline delays, and vendor risk.
Quantify risk costs when possible. If implementation fails, what's the cost? If adoption is slow, how does that affect ROI? Risk-adjusted financial analysis shows expected value across scenarios, not just best-case outcomes.
Present risk mitigation plans for each major risk: technical validation to reduce integration risk, phased rollout to manage change, training programs to drive adoption, fixed-price implementation to cap costs, and vendor references to validate reliability.
Implementation Plan and Timeline
Detail how solution implementation will proceed: phases and milestones, resource requirements, dependencies and prerequisites, decision points, and go-live targets.
Show realistic timelines with buffer for typical delays. Aggressive timelines that slip undermine credibility. Conservative timelines that you beat build confidence. Include customer resource requirements explicitly.
Success Metrics and KPIs
Define how success will be measured: key performance indicators, measurement methodology, baseline metrics, target metrics, and measurement frequency.
Include both leading indicators (adoption rates, usage metrics) and lagging indicators (efficiency improvements, cost reductions). Leading indicators provide early signals. Lagging indicators prove business impact.
Recommendation and Next Steps
Conclude business cases with clear recommendations and next steps. What should they decide? When should they decide? What happens next if they approve?
Frame recommendations confidently: "Based on the analysis showing $2.1M ROI over three years with 8-month payback, we recommend proceeding with implementation beginning Q3 2026. Next steps include executive approval by May 15, contract execution by May 30, and implementation kickoff June 1."
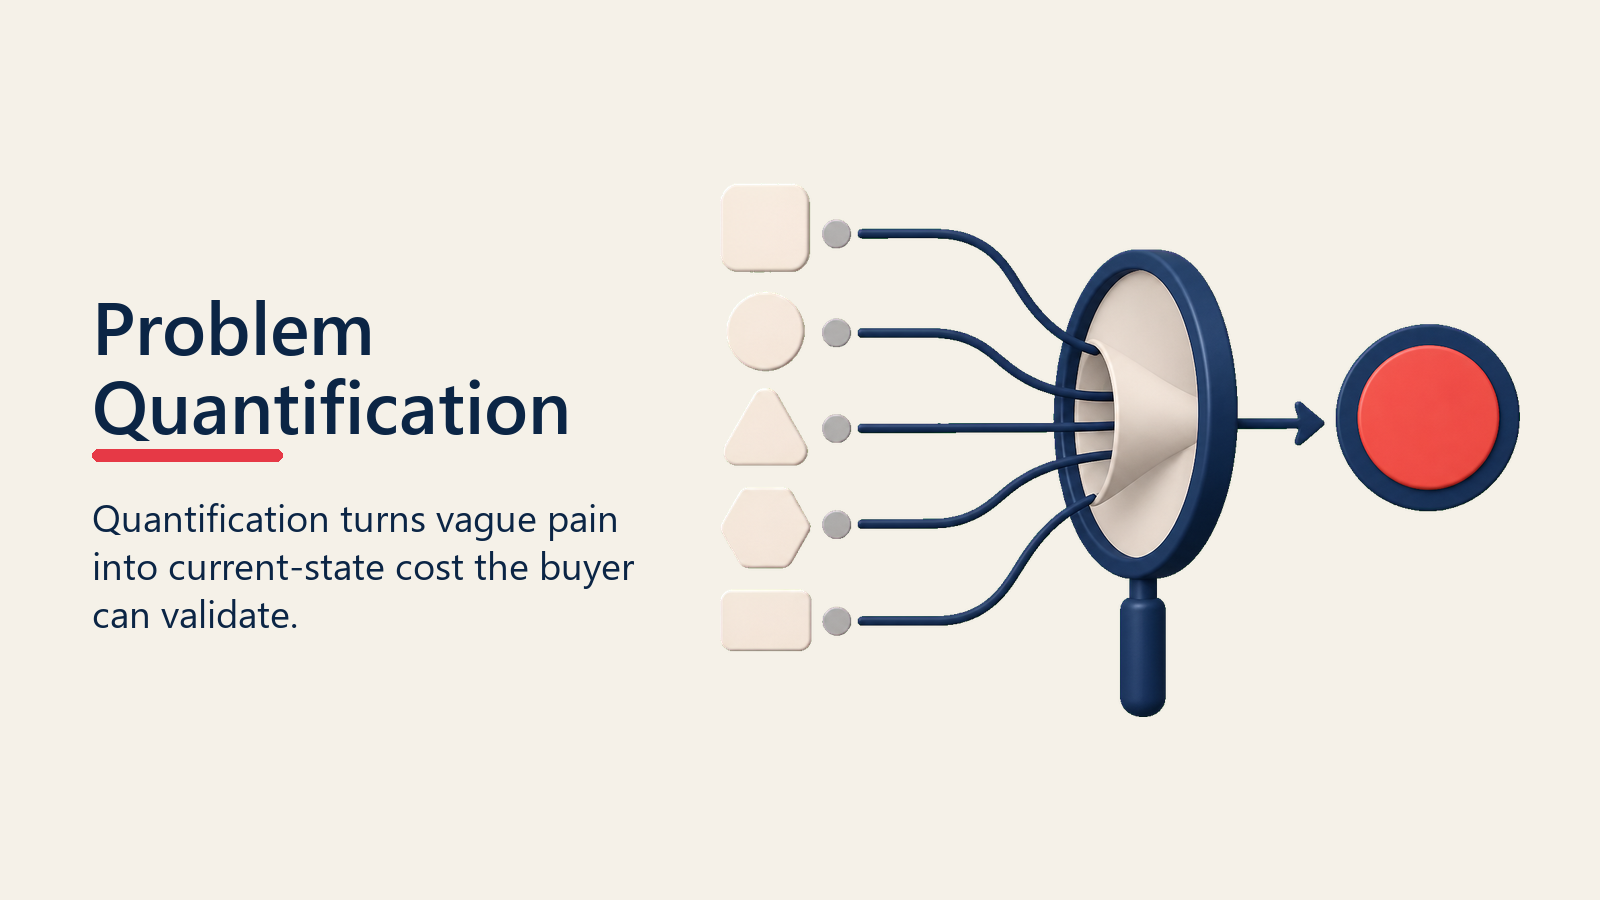
Problem Quantification
Problem quantification turns vague pain into a current-state cost the customer can validate.
Cost of Current State
Calculate total cost of current state comprehensively. Direct costs are usually visible: software licenses, labor costs, external services. Indirect costs require analysis: inefficiency multiplied by fully-loaded labor rates, error rates multiplied by correction costs, delays multiplied by opportunity cost.
Work with customer finance to validate cost assumptions. What's the fully-loaded cost per employee hour? What's the cost of customer acquisition? What's the value of retained customers?
Inefficiency and Waste
Quantify inefficiency precisely. "Current process is slow" lacks impact. "Current process requires 40 hours per week from three analysts at $75/hour fully loaded, costing $468K annually" creates concrete cost baseline.
Identify waste categories: rework due to errors, manual work that could be automated, delays causing missed opportunities, duplicate effort from poor coordination, and resources allocated to low-value activities.
Opportunity Cost
Calculate opportunity costs: revenue not captured due to slow response, market share lost to faster competitors, strategic initiatives delayed by operational burdens, and innovation constrained by resource allocation to inefficient processes.
Frame opportunity costs conservatively. If sales team spends 20 hours weekly on administrative tasks instead of selling, calculate opportunity cost based on realistic sales productivity assumptions.
Competitive Risk
Quantify competitive risks from inaction. If competitors deploy similar solutions and gain efficiency advantages, what market share might you lose? If industry adopts new capabilities and you don't, what customer satisfaction impact might occur?
Use scenarios to bound risk: "If three major competitors deploy AI-powered customer service by Q4 and we don't, we estimate 3-5% market share loss valued at $2-3M annually. The risk of inaction significantly exceeds the $400K solution investment."
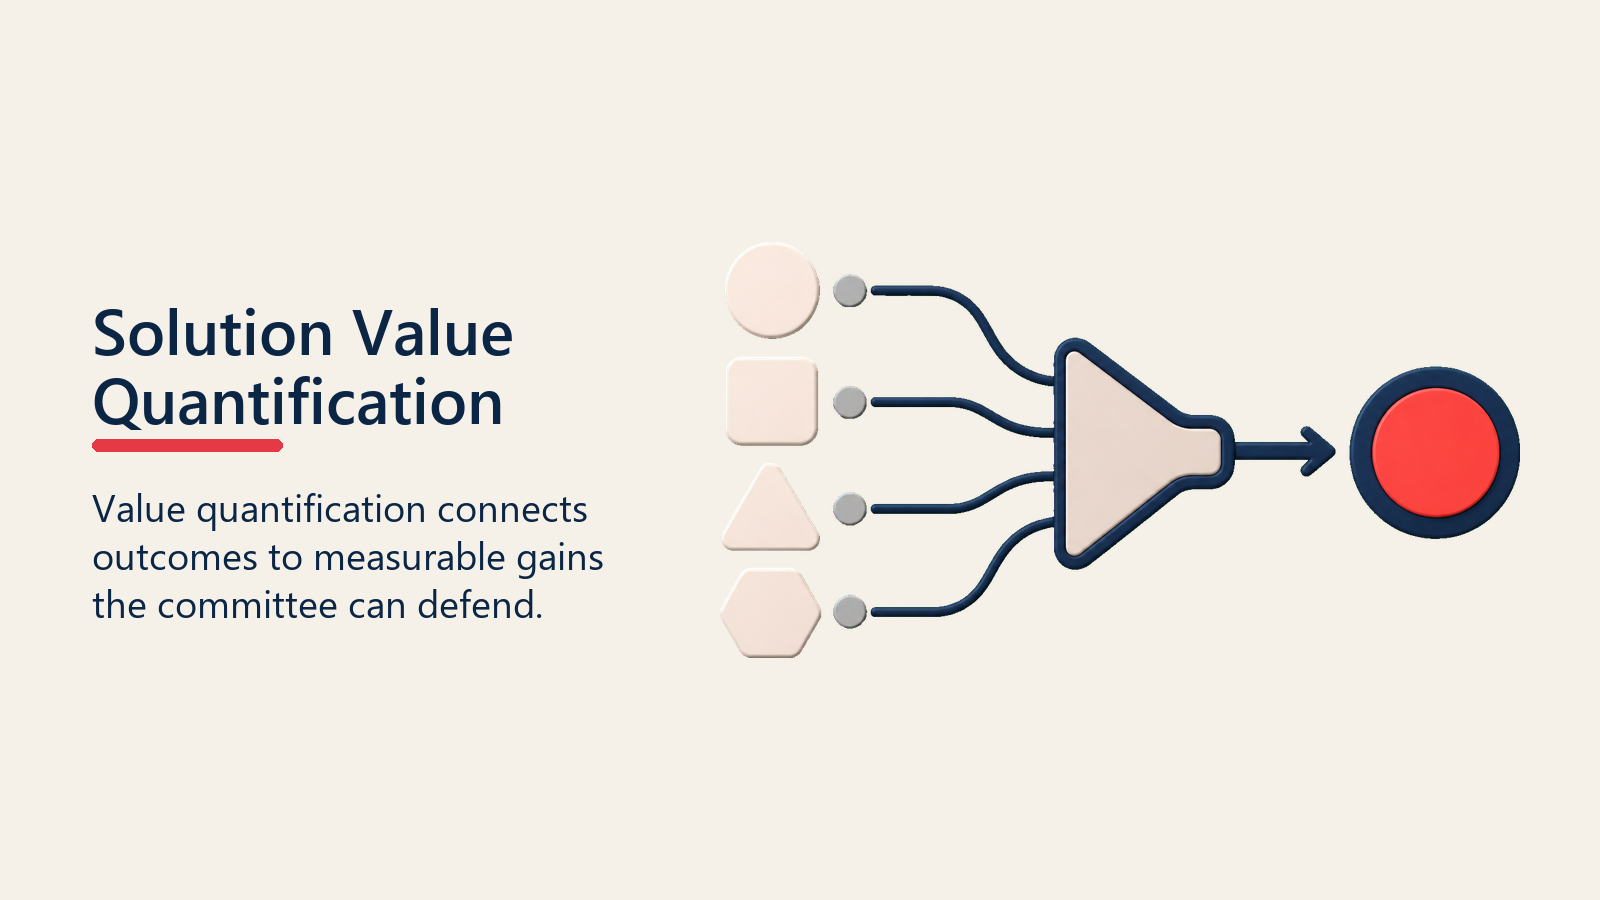
Solution Value Quantification
Value quantification connects solution outcomes to measurable gains the buying committee can defend.
Efficiency Gains
Quantify efficiency improvements in time and cost terms. If solution reduces process time from 10 days to 3 days, calculate the value of 7 days saved: reduced labor costs, faster time to market, improved cash flow.
Measure efficiency at scale. Process improvement of 2 hours per transaction seems modest. At 500 transactions monthly, that's 1,000 hours monthly or 12,000 hours annually. At $75/hour fully loaded, annual efficiency value is $900K.
Revenue Impact
Calculate revenue implications: increased sales from faster response times, higher win rates from better proposals, expanded deal sizes from improved capabilities, faster sales cycles enabling more deals, or improved customer retention increasing lifetime value.
Use conservative conversion assumptions. If faster lead response improves conversion by 2 percentage points and you process 1,000 leads monthly with $50K average deal size, that's 20 additional deals monthly or $12M annually.
Cost Reduction
Document direct cost reductions: software licenses eliminated, labor hours reduced, external services no longer needed, office space freed up, or infrastructure consolidated.
Show net cost reduction after accounting for your solution costs. If current state costs $800K annually and your solution costs $250K annually but eliminates $500K in other costs, net cost reduction is $250K annually.
Risk Mitigation Value
Value risk mitigation: reduced compliance violation risk, decreased security incident probability, lower error rates preventing customer dissatisfaction, or improved audit performance avoiding penalties.
Calculate expected value: probability of risk event multiplied by cost if it occurs. If annual compliance violation probability is 5% with $500K penalty, expected cost is $25K annually. Solution that reduces probability to 1% saves $20K annually.
Strategic Benefits
Some benefits resist quantification but matter strategically: improved market positioning, enhanced brand perception, increased innovation capability, or competitive differentiation. Include strategic benefits in business cases but separate them from quantified ROI.
Frame strategic benefits as option value: "Investment in this capability positions us to pursue adjacent markets valued at $50M annually. While we're not assuming market entry revenue in ROI calculation, the strategic option value significantly enhances investment attractiveness."
Financial Analysis Framework
The financial framework translates the business case into metrics finance and executives already use.
Total Cost of Ownership (TCO)
Calculate complete ownership costs: software subscription fees, implementation costs, training and change management, integration development, ongoing support and maintenance, internal resources allocated, and infrastructure costs.
Structure TCO over 3-5 years showing year-by-year costs. Year one includes implementation plus first year subscription. Years 2-5 show run-rate subscription and maintenance.
Return on Investment (ROI)
Calculate ROI as (Total Benefits minus Total Costs) divided by Total Costs. Present as percentage: if 3-year benefits are $2.8M and 3-year costs are $1.1M, ROI is 155%.
Show ROI progression over time. Year one ROI may be negative or low due to implementation costs. Years 2-3 show positive ROI as benefits compound.
Payback Period
Calculate how long until cumulative benefits exceed cumulative costs. If monthly benefits are $50K and implementation cost is $200K with $15K monthly subscription, payback occurs in month 6 when $300K cumulative benefits exceed $290K cumulative costs.
Payback period communicates investment risk clearly. Shorter payback (6-12 months) means lower risk. Longer payback (24+ months) requires confidence in sustained benefits.
Net Present Value (NPV)
Calculate present value of future benefits and costs using appropriate discount rate (typically 8-12% for corporate investments). NPV accounts for time value of money: a dollar today is worth more than a dollar in three years.
Use customer's discount rate or weighted average cost of capital if known. This ensures NPV calculation reflects their financial standards.
Stakeholder-Specific Business Cases
Different stakeholders care about different benefits. Create stakeholder-specific business case views.
Executive Business Case: Focus on strategic impact, financial returns, competitive positioning, and risk mitigation. Lead with ROI, payback period, and strategic benefits. Effective executive engagement strategies help ensure your business case resonates with C-level priorities.
Operational Business Case: Emphasize process improvements, efficiency gains, user productivity, error reduction, and workflow optimization.
Financial Business Case: Provide detailed cost analysis, benefit calculations, assumption documentation, sensitivity analysis, and risk-adjusted scenarios. Rigor matters more than optimism.
IT Business Case: Highlight technical efficiency, integration benefits, infrastructure consolidation, maintenance reduction, and security improvements.
End User Business Case: Focus on daily workflow improvements, frustration elimination, time savings, ease of use, and capability enhancements.
Making Assumptions Transparent
Document all assumptions explicitly: labor costs and fully-loaded rates, efficiency improvement percentages, adoption timelines and ramp curves, usage volumes and growth, unit economics and conversion rates, and risk probabilities and impact costs.
Transparent assumptions enable stakeholders to adjust analysis based on their knowledge or beliefs. If they think adoption will be slower, they can recalculate ROI. Transparency builds credibility and trust.
Provide sensitivity analysis showing ROI across assumption ranges. If base case assumes 40% efficiency improvement but sensitivity analysis shows positive ROI even at 20% improvement, the business case is robust.
Enabling Champion Presentations
Create business case materials that champions can present independently: executive summary slide deck, detailed business case document, financial model spreadsheet with adjustable assumptions, stakeholder-specific one-pagers, and FAQ document addressing common objections. These materials complement your proposal development process by providing the financial foundation buyers need.
These materials arm champions for internal meetings you won't attend. Clear, comprehensive, well-designed materials enable effective advocacy.
Coach champions on presenting business cases: lead with outcomes and ROI, acknowledge assumptions and invite input, address risk concerns proactively, connect to strategic priorities, and recommend clear next steps.
Business Case Templates and Tools
Develop business case templates for consistency and efficiency: standard structure and sections, financial model templates with pre-built formulas, assumption documentation frameworks, sensitivity analysis templates, and presentation deck templates.
Templates ensure comprehensive coverage while enabling customization for specific situations. Sales teams can develop strong business cases quickly using proven templates.
Build ROI calculators that enable rapid scenario modeling. Input customer-specific variables (employee counts, transaction volumes, current costs) and calculator produces instant ROI analysis.
Making Business Cases Work
Business case creation is collaborative work between sellers and buyers to build quantified justification for investment. Companies that excel at business cases treat them as strategic tools that enable internal approvals, not administrative documents.
Make business case creation mandatory for deals above defined thresholds. Track correlation between business case quality and win rates. Develop templates and tools that enable consistent, efficient business case development. Ensure your deal desk operations support rapid business case creation with standardized templates and approval workflows.
The best business cases feel like joint work products created by buyer and seller together, not vendor marketing claims. They use customer data, reflect customer priorities, address customer-specific circumstances, and result in ROI calculations that internal stakeholders trust.
Review business case effectiveness regularly. Do deals with documented business cases close at higher rates? Which value drivers resonate most with buyers? What assumptions prove accurate versus optimistic? Use this learning to refine templates, improve calculations, and enhance capabilities that directly impact revenue.
Learn More
- Internal Approvals - Navigate the approval process that your business case must support
- Mutual Action Plans - Create collaborative plans that incorporate business case milestones
- Multi-Stakeholder Navigation - Address diverse stakeholder needs with tailored business case views
- Pricing Strategies - Align pricing with the value demonstrated in your business case

Senior Operations & Growth Strategist