Mapa Estratégico: Cómo Visualizar Su Estrategia (Con Ejemplos)
Turn this article into takeaways for your work.
Each assistant summarizes the article only for you and suggests best practices for your work.
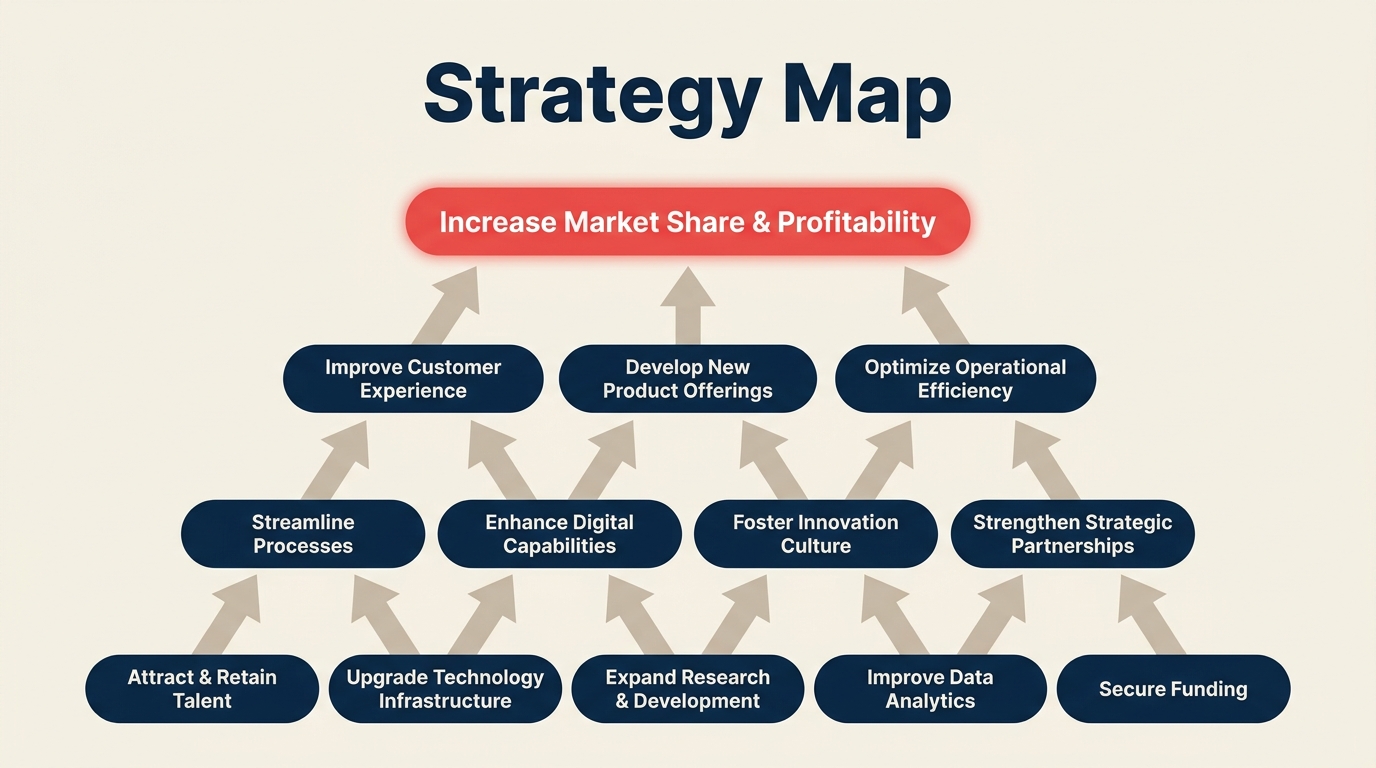
Un mapa estratégico es un visual de una sola página que muestra cómo su organización crea valor al vincular objetivos estratégicos a través de cuatro perspectivas en una cadena de causa y efecto. Si su equipo puede dibujar el mapa de memoria, comprende la estrategia. Si no puede, tiene un problema de comunicación que vale la pena resolver.
¿Qué es un mapa estratégico?
Un mapa estratégico es un diagrama que organiza los objetivos estratégicos de una organización en cuatro capas apiladas (Financiera, Cliente, Procesos Internos, y Aprendizaje y Crecimiento) y traza flechas entre objetivos para mostrar cuáles impulsan a cuáles. Responde a una sola pregunta en forma visual: "¿Cómo pasamos de donde estamos a donde queremos llegar?"
Robert S. Kaplan y David P. Norton desarrollaron el mapa estratégico como complemento de su balanced scorecard. El scorecard le indica qué medir. El mapa estratégico le indica por qué esas medidas importan y cómo se conectan. Kaplan y Norton describieron el concepto por primera vez en el artículo de Harvard Business Review de 1992 que introdujo el balanced scorecard, y lo ampliaron en una metodología completa en su libro de 2004 Strategy Maps: Converting Intangible Assets into Tangible Outcomes.
"Una imagen vale más que mil palabras. Un mapa estratégico vale más que mil presentaciones." (Parafraseando el argumento central de Kaplan y Norton: la visualización fuerza a que la lógica estratégica quede al descubierto para que las brechas y contradicciones se vuelvan visibles.)
Datos Clave
- Kaplan y Norton introdujeron el balanced scorecard en un artículo de Harvard Business Review de 1992 titulado "The Balanced Scorecard: Measures That Drive Performance."
- La metodología formal del mapa estratégico fue publicada en su libro de 2004 Strategy Maps: Converting Intangible Assets into Tangible Outcomes (Harvard Business School Press).
- Investigaciones del Balanced Scorecard Institute muestran consistentemente que menos del 10% de las organizaciones ejecutan sus estrategias de forma eficaz, y la comunicación deficiente de la estrategia a los empleados de primera línea se cita como la causa principal (Balanced Scorecard Institute, Strategy Execution Report, 2023).
Las cuatro perspectivas de un mapa estratégico
Un mapa estratégico se construye con cuatro capas. Léalo de abajo hacia arriba: cada capa sostiene a la que está encima. Los objetivos en la parte inferior son las causas raíz; los objetivos en la parte superior son los resultados.
| Capa (de abajo hacia arriba) | Pregunta que responde | Objetivos típicos |
|---|---|---|
| Aprendizaje y Crecimiento | ¿Qué competencias, sistemas y cultura necesitamos? | Capacidad del personal, infraestructura tecnológica, cultura organizacional |
| Procesos Internos | ¿En qué procesos debemos destacar? | Calidad del producto, velocidad del ciclo de ventas, eficiencia operativa, pipeline de innovación |
| Cliente | ¿Cómo debemos aparecer ante nuestros clientes? | Satisfacción del cliente, cuota de mercado, reputación de marca, valor entregado |
| Financiera | ¿Cómo nos ven los accionistas? | Crecimiento de ingresos, reducción de costos, retorno sobre el capital, márgenes de rentabilidad |
La lógica causal avanza hacia arriba. Se invierte en aprendizaje y crecimiento (programas de capacitación, nuevos sistemas) para mejorar los procesos internos (entrega más rápida, menos defectos). Mejores procesos producen mejores resultados para el cliente (fidelización, referencias, mayor disposición a pagar). Los clientes satisfechos generan los resultados financieros que interesan a los accionistas.
Esta es la perspectiva que diferencia a un mapa estratégico de un organigrama genérico o una lista de prioridades: hace explícita la cadena causal. Cuando el número de ingresos trimestral decepciona, se puede rastrear hacia atrás a través del mapa para identificar qué métrica de cliente falló y qué métrica de proceso la precedió.
Para más información sobre cómo establecer los objetivos correctos en cada capa, consulte objetivos estratégicos y KPI vs métrica.
Mapa estratégico vs balanced scorecard
Las personas suelen usar estos términos indistintamente, pero cumplen funciones diferentes.
| Dimensión | Mapa estratégico | Balanced scorecard |
|---|---|---|
| Formato | Diagrama visual (una página) | Tabla de medición |
| Propósito principal | Mostrar la lógica causal de la estrategia | Hacer seguimiento del progreso respecto a objetivos |
| Componentes principales | Objetivos y flechas causales a través de cuatro perspectivas | Objetivos, medidas, metas e iniciativas |
| Cuándo usarlo | Comunicar estrategia, alinear equipos, identificar brechas | Gestión y reporte continuo del desempeño |
| Origen | Kaplan y Norton, 2004 Strategy Maps | Kaplan y Norton, artículo HBR 1992 |
Piénselo así: el mapa estratégico es el plano, y el balanced scorecard es el panel de instrumentos. Se diseña el plano primero, luego se construyen instrumentos para monitorear cada componente crítico. Lea la guía completa del balanced scorecard para ver cómo funcionan ambas herramientas juntas en la práctica.
Beneficios de un mapa estratégico
Obliga a un pensamiento explícito de causa y efecto. La mayoría de las presentaciones de estrategia listan prioridades sin mostrar cómo se conectan. Un mapa estratégico requiere que trace las flechas, lo que revela supuestos y brechas que permanecen ocultos en las presentaciones.
Alinea a los equipos en torno a una imagen compartida. Cuando finanzas, operaciones, ventas y RR.HH. ven el mismo visual de una página, comprenden cómo su trabajo se integra en los mismos objetivos. El mapa reemplaza cientos de conversaciones individuales de alineación.
Ayuda a priorizar. Si una iniciativa no aparece en ningún lugar del mapa como impulsora de un objetivo estratégico, es una brecha en el mapa o una distracción. En cualquier caso, hay que decidir.
Hace más rápida la comunicación de la estrategia. Un nuevo ejecutivo, un miembro de la junta o un nuevo empleado puede comprender la lógica estratégica en cinco minutos. Una presentación de 40 diapositivas toma 40 minutos y a menudo comunica con menos claridad.
Crea una herramienta diagnóstica. Cuando los resultados se quedan cortos, se rastrea hacia atrás a través de la cadena causal. El mapa indica dónde buscar, no solo que algo está mal.
Para más contexto sobre dónde encaja un mapa estratégico dentro de los pasos más amplios del proceso de planificación estratégica, consulte esa guía.
Cómo construir un mapa estratégico
Paso 1: Defina sus objetivos financieros
Comience por la cima. ¿Qué resultados financieros intenta alcanzar en este período de planificación? Objetivos comunes: aumentar los ingresos un 20%, reducir los costos operativos un 10%, mejorar el retorno sobre el capital invertido. Limítese a dos o tres objetivos. Más de eso y nada es verdaderamente una prioridad.
Paso 2: Identifique los resultados del cliente que impulsan esos resultados financieros
Pregúntese: "¿Qué comportamientos del cliente producen esos resultados financieros?" Si el crecimiento de ingresos es el objetivo, el impulsor del cliente probablemente sea un aumento de compras, mayor retención o expansión hacia nuevos segmentos. Nombre los resultados específicos del cliente, no los programas que planea ejecutar. "Mejorar el Net Promoter Score (NPS) de 32 a 55" es un objetivo del cliente. "Lanzar un programa de fidelización" es una iniciativa que pertenece al balanced scorecard, no al mapa.
Paso 3: Mapee los procesos internos que crean esos resultados para el cliente
Pregúntese: "¿Qué debemos hacer excepcionalmente bien para entregar esa experiencia al cliente?" Si la satisfacción del cliente impulsa el crecimiento financiero, los impulsores del proceso podrían ser: reducir el tiempo de cumplimiento de pedidos, mejorar la calidad del producto o acortar los tiempos de resolución del soporte. Esta capa es donde la mayoría de los mapas estratégicos se vuelven específicos.
Paso 4: Identifique las capacidades de aprendizaje y crecimiento requeridas
Pregúntese: "¿Qué competencias, herramientas y cultura necesitamos para ejecutar esos procesos?" Capacidades comunes: alfabetización en análisis de datos, gestión ágil de proyectos, retención del personal o una nueva plataforma CRM. Esta capa es la más descuidada en la mayoría de los mapas estratégicos. Las organizaciones suelen omitirla y luego se preguntan por qué se estancan las mejoras de procesos.
Paso 5: Trace las flechas causales
Conecte objetivos entre capas con flechas que representen relaciones de causa y efecto. Una flecha de "Mejorar la capacidad de análisis de datos" (aprendizaje) a "Reducir el retraso en la predicción de abandono" (proceso interno) a "Aumentar la retención de clientes" (cliente) a "Hacer crecer los ingresos recurrentes" (financiero) es una cadena causal completa. Cada objetivo financiero debe rastrearse hasta al menos un objetivo de aprendizaje a través de una cadena completa.
Paso 6: Revise y simplifique
Un buen mapa estratégico tiene entre 15 y 25 objetivos en total en las cuatro perspectivas. Si tiene más de 30, ha listado una lista de deseos, no una estrategia. Elimine objetivos que no tienen cadena causal, son redundantes con otros o no se pueden medir. Luego revíselo con su equipo de liderazgo y pregúntese: "¿Esta imagen coincide con lo que realmente estamos intentando hacer?" Los desacuerdos que surgen durante esta revisión son valiosos.
Paso 7: Vincule al balanced scorecard
Para cada objetivo del mapa, asigne al menos un indicador clave de desempeño (KPI), un valor objetivo y la iniciativa responsable de cerrar la brecha. Esto vincula el mapa estratégico visual con el sistema operativo de gestión del desempeño. Consulte el marco OKR para conocer un enfoque alternativo para establecer y hacer seguimiento de metas que complementa este paso.
Ejemplos de mapas estratégicos
| Sector o función | Objetivo financiero | Objetivo del cliente | Objetivo de proceso interno | Objetivo de aprendizaje y crecimiento |
|---|---|---|---|---|
| Manufactura | Reducir el costo de producción por unidad | Mejorar la tasa de entrega a tiempo | Reducir los defectos por millón de unidades | Capacitar a los operadores en métodos de manufactura lean |
| Empresa SaaS | Hacer crecer los ingresos recurrentes anuales | Aumentar la retención neta de ingresos | Acelerar el ritmo de lanzamiento de productos | Desarrollar capacidad de análisis de productos |
| Banco minorista | Hacer crecer los ingresos por comisiones | Aumentar la adopción del canal digital | Agilizar la apertura digital de cuentas | Capacitar a los asesores de sucursal en herramientas digitales |
| Hospital | Reducir el costo por episodio de paciente | Mejorar los puntajes de satisfacción del paciente | Reducir las tasas de readmisión | Certificar al personal clínico en protocolos basados en evidencia |
| Función de RR.HH. | Reducir el costo total de la fuerza laboral | Mejorar la satisfacción del gerente de contratación | Reducir el tiempo de cobertura de roles críticos | Desarrollar capacidad de sourcing de talento en ingeniería |
El patrón es consistente en todas las industrias: los resultados financieros se ubican en la cima, los objetivos de cliente y proceso en el centro, y las inversiones en capacidades en la base.
Para una visión más amplia de cómo esto encaja dentro de la base de misión vs declaración de visión de la estrategia, y cómo la ejecución de la estrategia convierte el mapa en resultados reales, consulte esas guías relacionadas.
Errores comunes que debe evitar
Listar iniciativas en lugar de objetivos. "Lanzar un nuevo CRM" es una iniciativa. "Reducir el ciclo de ventas promedio de 45 a 28 días" es un objetivo de proceso interno. El mapa debe mostrar lo que se intenta lograr, no cómo.
Omitir la capa de aprendizaje y crecimiento. Muchos mapas tienen objetivos financieros y de cliente sólidos, pero objetivos de capacidad vagos. Esto hace que el mapa parezca completo mientras oculta la restricción real. Si no sabe qué competencias y sistemas necesita, no sabe si puede ejecutar.
Trazar demasiadas flechas. Cuando todo se conecta con todo, nada es causal. Sea selectivo. Una flecha debe representar una hipótesis genuina y comprobable, no solo una asociación plausible.
Construir el mapa de forma aislada. Un mapa estratégico construido únicamente por el CEO y el CFO y luego distribuido raramente gana tracción. Los equipos que ayudan a construir el mapa lo comprenden mejor y se comprometen más profundamente con él.
Tratar el mapa como estático. Los mapas estratégicos deben revisarse cuando el entorno de negocio cambia, cuando una iniciativa importante fracasa o, como mínimo, anualmente. Un mapa de hace tres años puede estar basado en supuestos que ya no se sostienen.
Preguntas frecuentes
¿Qué es un mapa estratégico? Un mapa estratégico es un diagrama visual de una sola página que muestra los objetivos estratégicos de una organización organizados en cuatro capas (Financiera, Cliente, Procesos Internos y Aprendizaje y Crecimiento) con flechas que conectan objetivos para mostrar relaciones de causa y efecto. Fue desarrollado por Robert Kaplan y David Norton como herramienta complementaria del balanced scorecard.
¿Cuáles son las cuatro perspectivas de un mapa estratégico? Las cuatro perspectivas son Financiera (¿qué resultados financieros necesitamos?), Cliente (¿cómo debemos aparecer ante los clientes para lograr esos resultados?), Procesos Internos (¿en qué procesos debemos destacar para ofrecer esa experiencia al cliente?) y Aprendizaje y Crecimiento (¿qué competencias, sistemas y cultura necesitamos para ejecutar esos procesos?). Se apilan de abajo hacia arriba en una cadena causal.
¿En qué se diferencia un mapa estratégico de un balanced scorecard? Un mapa estratégico es un diagrama visual que muestra la lógica causal entre objetivos. Un balanced scorecard es una tabla de medición que asigna indicadores clave de desempeño (KPIs), metas e iniciativas a cada objetivo. El mapa viene primero, porque define los objetivos. El scorecard especifica luego cómo se hará el seguimiento y la gestión del progreso respecto a ellos. Consulte la guía completa del balanced scorecard para más detalles.
¿Cuántos objetivos debe tener un mapa estratégico? La mayoría de los mapas estratégicos efectivos tienen entre 15 y 25 objetivos en total en las cuatro perspectivas. Menos de 12 puede ser demasiado simple para representar una estrategia real. Más de 30 generalmente significa que el mapa incluye tareas operativas e iniciativas en lugar de verdaderos objetivos estratégicos.
¿Las pequeñas empresas necesitan un mapa estratégico? Sí, a menudo más que las grandes. Las pequeñas empresas toman decisiones estratégicas con menos personas y menos revisión formal. Un mapa estratégico de una página aporta la misma disciplina que una gran empresa obtiene de las revisiones estratégicas trimestrales. No tiene que ser complejo: incluso 8 a 12 objetivos en cuatro capas pueden clarificar prioridades y eliminar la ambigüedad sobre dónde invertir tiempo.
Un mapa estratégico no se ejecuta solo, pero le indicará dónde buscar cuando los resultados se queden cortos y dónde invertir cuando tenga espacio para crecer. Constrúyalo, revíselo trimestralmente y pasará menos tiempo debatiendo prioridades y más tiempo ejecutándolas.

Senior Operations & Growth Strategist
On this page
- ¿Qué es un mapa estratégico?
- Las cuatro perspectivas de un mapa estratégico
- Mapa estratégico vs balanced scorecard
- Beneficios de un mapa estratégico
- Cómo construir un mapa estratégico
- Paso 1: Defina sus objetivos financieros
- Paso 2: Identifique los resultados del cliente que impulsan esos resultados financieros
- Paso 3: Mapee los procesos internos que crean esos resultados para el cliente
- Paso 4: Identifique las capacidades de aprendizaje y crecimiento requeridas
- Paso 5: Trace las flechas causales
- Paso 6: Revise y simplifique
- Paso 7: Vincule al balanced scorecard
- Ejemplos de mapas estratégicos
- Errores comunes que debe evitar
- Preguntas frecuentes