Renewal Metrics: Measuring and Optimizing Renewal Performance
Turn this article into takeaways for your work.
Each assistant summarizes the article only for you and suggests best practices for your work.
What Gets Measured Gets Managed (But Only If You Measure the Right Things)
Most renewal teams drown in metrics. They track everything, understand nothing, and react too late.
Here's the pattern I see over and over: A VP shows me their renewal dashboard with 47 different metrics, color-coded cells, and three-letter acronyms everywhere. I ask, "If you could only check three numbers every Monday morning, which would they be?" Silence. They don't know because they're measuring activity instead of outcomes, and tracking what happened instead of what's about to happen.
Good renewal metrics do three things. They predict problems before renewal dates arrive. They show you where your process is broken. And they tell you whether your fixes are actually working.
Everything else is noise.
The Only Three Metrics That Actually Matter for Leadership
If your executive team only cares about three numbers, these should be them:
Logo Renewal Rate - How many customers stick around.
Formula: (Customers Renewed / Customers Up for Renewal) × 100
Example: 85 customers renewed out of 100 up for renewal = 85% logo renewal rate
The benchmark everyone quotes is 85-95% for healthy SaaS businesses. Below 80% means you have serious problems. But don't obsess over this number alone because it treats your $1M enterprise customer the same as your $5K SMB account.
Gross Dollar Retention - How much ARR you keep from existing customers, ignoring expansions.
Formula: (Renewed ARR / Total ARR Up for Renewal) × 100
Example: You have $1M in ARR up for renewal this quarter. Customers representing $850K renew (some churn, some downgrade). That's 85% gross retention.
This number tells the truth about your retention before expansion masks the problems. I've seen companies brag about 110% NRR while their gross retention sits at 75%. They're sprinting on a treadmill, winning new business to replace what they're losing. Eventually they run out of breath.
Benchmark: 85-95% gross retention for strong businesses. Below 80% requires immediate intervention.
Net Retention Rate (NRR) - The ultimate scorecard that includes everything: renewals, expansions, churn, downgrades.
Formula: ((Starting ARR + Expansion - Churn - Contraction) / Starting ARR) × 100
Example: Start with $1M ARR in your cohort. Add $200K in expansions. Lose $100K to full churn. Lose another $50K to downgrades. That's ($1M + $200K - $100K - $50K) / $1M = 105% NRR.
Benchmarks change by market segment:
- 100-110% is good
- 110-120% is excellent
- 120%+ means you've built something special
- Below 100% means your business is shrinking before you count new sales
SMB businesses struggle to break 100% because small customers churn faster than they expand. Enterprise businesses should be hitting 110%+ or they're leaving money on the table.
Pipeline Metrics (Because Renewals Don't Close Themselves)
Renewal Pipeline Coverage - Do you have enough in your pipeline to hit your target?
Formula: (Weighted Pipeline Value / Renewal Target) × 100
Example: Your target is $1M in renewals this quarter. Your weighted pipeline (after applying win probabilities) shows $1.2M. That's 120% coverage.
You want 150-200% coverage for accuracy. Sales teams live by this rule, but renewal teams often wing it. If you're sitting at 100% coverage, you're going to miss your target. Things fall out. Deals slip. Customers ghost you.
Below 100% coverage? You're already behind.
Pipeline Stage Distribution - Where are your deals stuck?
Break your pipeline into stages:
- Not Yet Engaged (T-120 or earlier)
- Initial Discussion (T-90 to T-120)
- Proposal Submitted (T-60 to T-90)
- Negotiation (T-30 to T-60)
- Closed Won/Lost
Healthy pipelines show steady progression. If 60% of your pipeline is stuck in "Proposal Submitted" at T-45, you've got a negotiation problem. If everything's still in "Not Yet Engaged" at T-60, your outreach is failing.
One of my clients had $2M stuck in "Initial Discussion" with renewal dates 30 days out. Turns out their CSMs were logging every email exchange as "discussion" even when customers weren't responding. False pipeline coverage is worse than no coverage because it creates false confidence.
Forecast Accuracy - Are you any good at predicting what will actually close?
Formula: (Actual Renewals / Forecasted Renewals) × 100
Track this at different time horizons. Your forecast accuracy 30 days before quarter end should be 90-95%. At the start of the quarter, 80-90% is reasonable.
If you're consistently over-forecasting, your CSMs are too optimistic (or lying). If you're under-forecasting, they're sandbagging. Either way, you can't plan hiring, cash flow, or board meetings with bad data.
Time in Stage - How long do deals sit at each step?
Average days in each pipeline stage tells you where friction lives. If proposals sit for 45 days before customers respond, maybe your proposals suck. Or maybe you're sending them too early before customers are ready to engage.
Fast progression through stages sounds great until you realize CSMs are advancing deals prematurely to make their pipeline look healthy. Track both time-in-stage AND win rates by stage to catch that game.
Process Efficiency Metrics (How Well Your Machine Actually Runs)
Days to Close Renewal - Your renewal cycle length from first outreach to signature.
Benchmark: 30-60 days for standard renewals.
Longer cycles increase risk and eat resources. But segment by customer size because enterprise deals naturally take longer. If your SMB renewals are taking 90 days, something's broken. If you're trying to close enterprise deals in 15 days, you're probably skipping important steps.
Touchpoints to Close - How many interactions does it take to get a signature?
I see two problems here. CSMs with 15+ touchpoints per renewal who can't get to "yes." And CSMs with 2-3 touchpoints who aren't doing real renewal work (they're just processing paperwork for customers who were going to renew anyway).
Benchmark: 5-8 touchpoints for mid-market accounts, 10-15 for enterprise.
If your top CSM closes renewals in 4 touches while everyone else needs 12, study what she's doing differently. Usually it's better discovery, stronger value positioning, or executive relationships that make renewal conversations easier.
Proposal to Signature Time - Days from sending your renewal proposal to getting it signed.
Benchmark: 7-14 days for SMB, 14-30 days for mid-market, 30-60 days for enterprise.
Long proposal-to-signature times mean one of three things: Your proposal raised objections. The customer needs to negotiate. Or internal approvals are stuck.
If this metric is climbing, your CSMs either aren't qualifying properly before sending proposals, or they're sending proposals that don't match what the customer actually wants.
Average Discount Rate - How much are you cutting prices to close deals?
Formula: Sum of All Discounts / Number of Renewals
Benchmark: 5-10% average discount is normal. Over 15% means you've got pricing problems or value problems.
Rising discount rates over time are a red flag. Either your product isn't delivering value, competitors are undercutting you, or CSMs are lazy negotiators who discount first instead of defending value.
I once audited a company giving 22% average discounts at renewal. Turned out half their CSMs opened every renewal conversation with "We can offer you 20% off if you sign early." They trained customers to expect discounts without even trying to renew at full price. Took us nine months to break that habit.
Risk Metrics (Spotting Problems Before They Kill Deals)
At-Risk ARR - How much revenue might not renew?
Track this at T-90, T-60, and T-30. Watch how the number changes. If at-risk ARR is climbing as you get closer to renewal dates, your interventions aren't working. If it's dropping, you're successfully de-risking your pipeline.
Segment at-risk ARR by reason: product issues, competitive threats, budget cuts, champion turnover, usage decline. Different problems need different solutions.
Save Rate - When you identify an at-risk customer, how often do you actually save them?
Formula: (Saved ARR / At-Risk ARR) × 100
Example: You flagged $1M as at-risk this quarter. You successfully retained $700K of it. That's a 70% save rate.
Benchmark: 50-70% save rate is strong. Below 40% means your interventions don't work (or you're flagging customers as at-risk too late).
Here's the catch with save rates: They're only meaningful if you're honest about what's truly at-risk. Some CSMs flag everything as at-risk so they look like heroes when deals close. Others refuse to admit customers are at-risk until it's too late. Your save rate only matters if your at-risk identification is accurate.
Average Save Discount - How much are you paying to keep at-risk customers?
Compare this to your standard renewal discount. If you're giving 5% discounts for healthy renewals but 30% discounts for saves, you're not saving customers. You're bribing them to stay another year.
Discounting might be necessary sometimes. But if your primary save tactic is "we'll cut the price," you haven't fixed the underlying value problem. They'll churn next year.
Escalation Rate - How often do renewals need executive involvement?
Formula: (Renewals Requiring Escalation / Total Renewals) × 100
Benchmark: Under 15% escalation for healthy renewal processes.
High escalation rates mean CSMs lack authority, confidence, or skills to handle standard renewal situations. Your VP shouldn't be saving every $50K renewal. If she is, either your CSMs need training or your product has fundamental problems that frontline teams can't solve.
Early Renewal Metrics (The Secret Weapon Most Teams Ignore)
Early Renewal Rate - How many customers renew before they have to?
Formula: (Early Renewals / Total Renewals) × 100
Benchmark: 15-25% early renewal rate indicates a healthy program.
Early renewals reduce your workload, decrease churn risk, and signal strong customer value perception. But only if you're doing it right.
Average Days Early - When early renewals happen, how far ahead of expiration?
Benchmark: 90-120 days early creates meaningful acceleration.
If customers are renewing 5 days early, that's not an early renewal program. That's normal renewal timing. You want customers committing months ahead, not days.
Multi-Year Renewal Rate - How many customers sign multi-year deals?
Benchmark: 20-35% multi-year rate is strong for SaaS.
Multi-year deals improve predictability, reduce future renewal workload, and typically come with expansion commitments. But make sure the economics work. If you're giving 40% discounts for three-year deals, you're destroying lifetime value to boost short-term bookings.
Expansion Metrics (Because Renewals Should Grow Accounts, Not Just Keep Them)
Expansion Rate at Renewal - What percentage of renewals include upsells, cross-sells, or added seats?
Formula: (Renewals with Expansion / Total Renewals) × 100
Benchmark: 30-50% expansion attachment at renewal is strong.
Renewal conversations are your best expansion opportunity. The customer's already evaluating their investment, comparing alternatives, and thinking about next year's needs. If your CSMs are just renewing flat, they're missing the easiest expansion motion you have.
Average Expansion Amount - When expansions happen, how big are they?
This tells you whether you're adding a few seats or selling major platform expansions. Both are valuable, but knowing your typical expansion size helps with forecasting and goal-setting.
If your average expansion is $5K and you need $500K in expansion this quarter, you need 100 expansion events. Can your team execute that many? Or do you need bigger expansion deals?
Expansion Attach Rate by Type - What kind of expansions actually work?
Break down by:
- Additional users/seats
- Product tier upgrades
- Module/feature additions
- New products
One company I worked with assumed their cross-sell motion was working because "expansion rate" looked good. When we segmented it, 90% of expansion was just seat additions in existing products. Their expensive cross-sell initiative was generating almost nothing. We killed it and focused on tier upgrades instead.
Leading Indicators (Predicting the Future Before It Happens)
These are the metrics that separate good renewal teams from great ones. Outcome metrics tell you what happened. Leading indicators tell you what's going to happen.
Health Score at T-90 - What's the customer's health score 90 days before renewal?
Correlate health scores with actual renewal outcomes. At one company we found that customers with 75+ health scores at T-90 renewed at 95% rates, while customers scoring 50-75 renewed at 70% rates, and below-50 customers renewed at 40% rates.
Now their CSMs know exactly which accounts need intervention and how much time they have.
Engagement at T-60 - Is the customer actively using your product 60 days before renewal?
Declining engagement approaching renewal predicts churn better than almost anything else. If usage drops 30% in the 60 days before renewal, that customer's thinking about leaving even if they haven't told you yet.
Track product logins, feature usage, support ticket volume, QBR attendance, and response rates to emails. When engagement falls off a cliff, your customer's already mentally checked out.
Value Review Completion - Did you conduct a business review or ROI analysis before renewal?
Customers who participate in value reviews renew at significantly higher rates. I've seen this data across dozens of companies. The exact lift varies (usually 10-20 percentage points), but the pattern holds.
If 40% of your upcoming renewals don't have completed value reviews at T-60, you're leaving renewals to chance.
Executive Sponsor Stability - Is your champion still there?
Executive sponsor churn in the 90 days before renewal is one of the strongest churn predictors. New executives want to prove themselves. They question inherited decisions. They look for quick wins, which often means cutting software spend.
When your champion leaves, renewal risk shoots up. Track executive turnover and immediately escalate affected renewals.
Segmentation Analysis (Because Averages Hide the Truth)
Renewal Rates by Customer Segment - Not all customers renew at the same rates.
Compare performance across:
- Company size (SMB, Mid-Market, Enterprise)
- Industry vertical
- Geography/region
- Product/plan tier
- Annual contract value bands
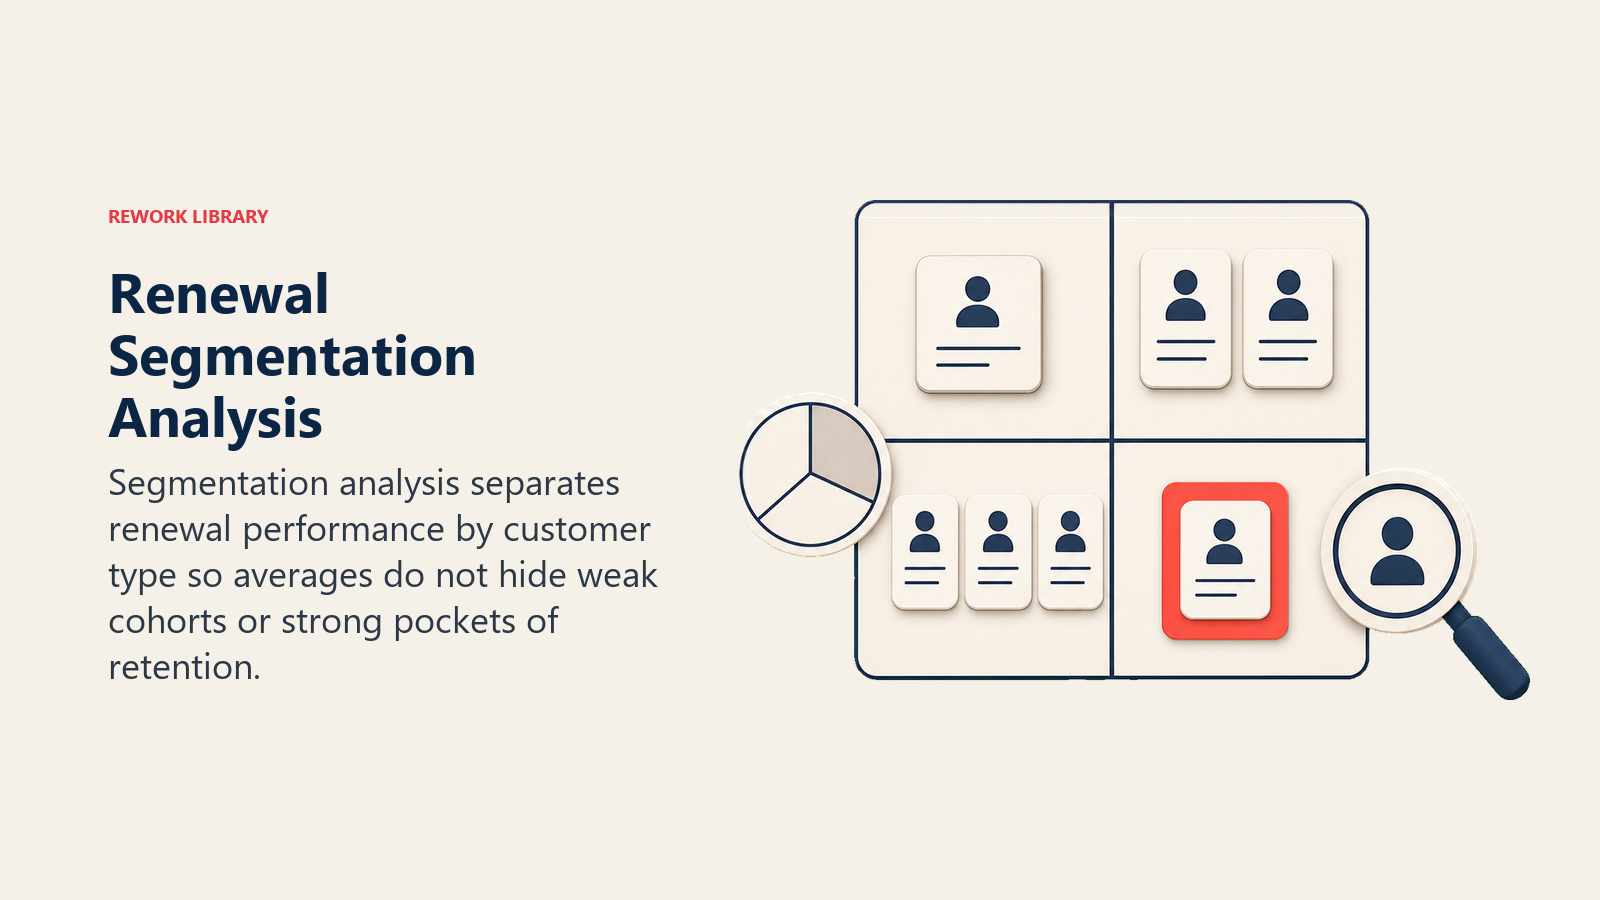
You might have an 88% overall renewal rate that hides a 95% enterprise rate and a 72% SMB rate. That's two completely different problems requiring different solutions.
Renewal Rates by Cohort - Are newer customers retaining better than older ones?
Track renewal performance by acquisition cohort (the month or quarter they first signed). If customers who signed in Q1 2024 are renewing at 85% while Q3 2024 customers renew at 78%, something changed for the worse. New sales team? Different customer profile? Worse onboarding?
Cohort analysis shows whether your retention is improving over time as you fix onboarding, refine ideal customer profiles, and improve customer success processes.
Renewal Rates by CSM - Who's actually good at this?
Individual CSM renewal performance reveals who's excelling and who's struggling. But be careful. Raw renewal rates can be misleading if CSMs have different portfolios.
The CSM with a 95% renewal rate managing 20 enterprise accounts with high health scores isn't necessarily better than the CSM with an 82% rate managing 80 SMB accounts with budget constraints. Segment by customer type and account characteristics.
Benchmark: CSM renewal rate variance should be under 15 percentage points. Wider variance indicates inconsistent processes or insufficient training.
Renewal Rates by Tenure - First renewal vs. second renewal vs. third renewal.
Many businesses see higher churn at first renewal (customers realizing it's not the right fit) with improved retention in subsequent renewals as customers deepen their commitment and integration.
If your first renewal rate is 75% but second renewal is 92%, focus your improvement efforts on onboarding and first-year experience. If first renewal is 90% but second renewal drops to 78%, you have a value delivery problem after year one.
Setting Benchmarks That Actually Mean Something
Industry benchmarks are useful context, but don't obsess over them. A $50/month SMB tool and a $500K/year enterprise platform have completely different retention profiles.
Industry Renewal Benchmarks by Segment:
SMB SaaS:
- Logo Retention: 70-85%
- Dollar Retention: 75-90%
- Net Retention: 85-100%
Mid-Market SaaS:
- Logo Retention: 85-92%
- Dollar Retention: 88-95%
- Net Retention: 95-110%
Enterprise SaaS:
- Logo Retention: 90-97%
- Dollar Retention: 92-98%
- Net Retention: 100-120%
Best-in-Class Targets:
Top quartile SaaS companies typically achieve:
- 95%+ logo retention
- 95%+ gross retention
- 115%+ net retention
- 90%+ forecast accuracy
- 25%+ early renewal rate
But here's what matters more than industry benchmarks: Your own baseline and your improvement trajectory.
Setting Targets That Work:
Start by establishing your baseline across 12 months. Then set improvement targets that are:
Achievable - Within 10-15% of current performance. If your renewal rate is 80%, shooting for 95% next quarter is fantasy. Targeting 85% is realistic.
Specific - "Improve renewal rate" is useless. "Increase SMB renewal rate from 73% to 78% by Q3" is actionable.
Segmented - Different targets for different customer types. Don't average everything together and miss where the real problems live.
Balanced - Don't optimize one metric at the expense of others. Pushing hard on early renewals with huge discounts might boost early renewal rate while destroying margins.
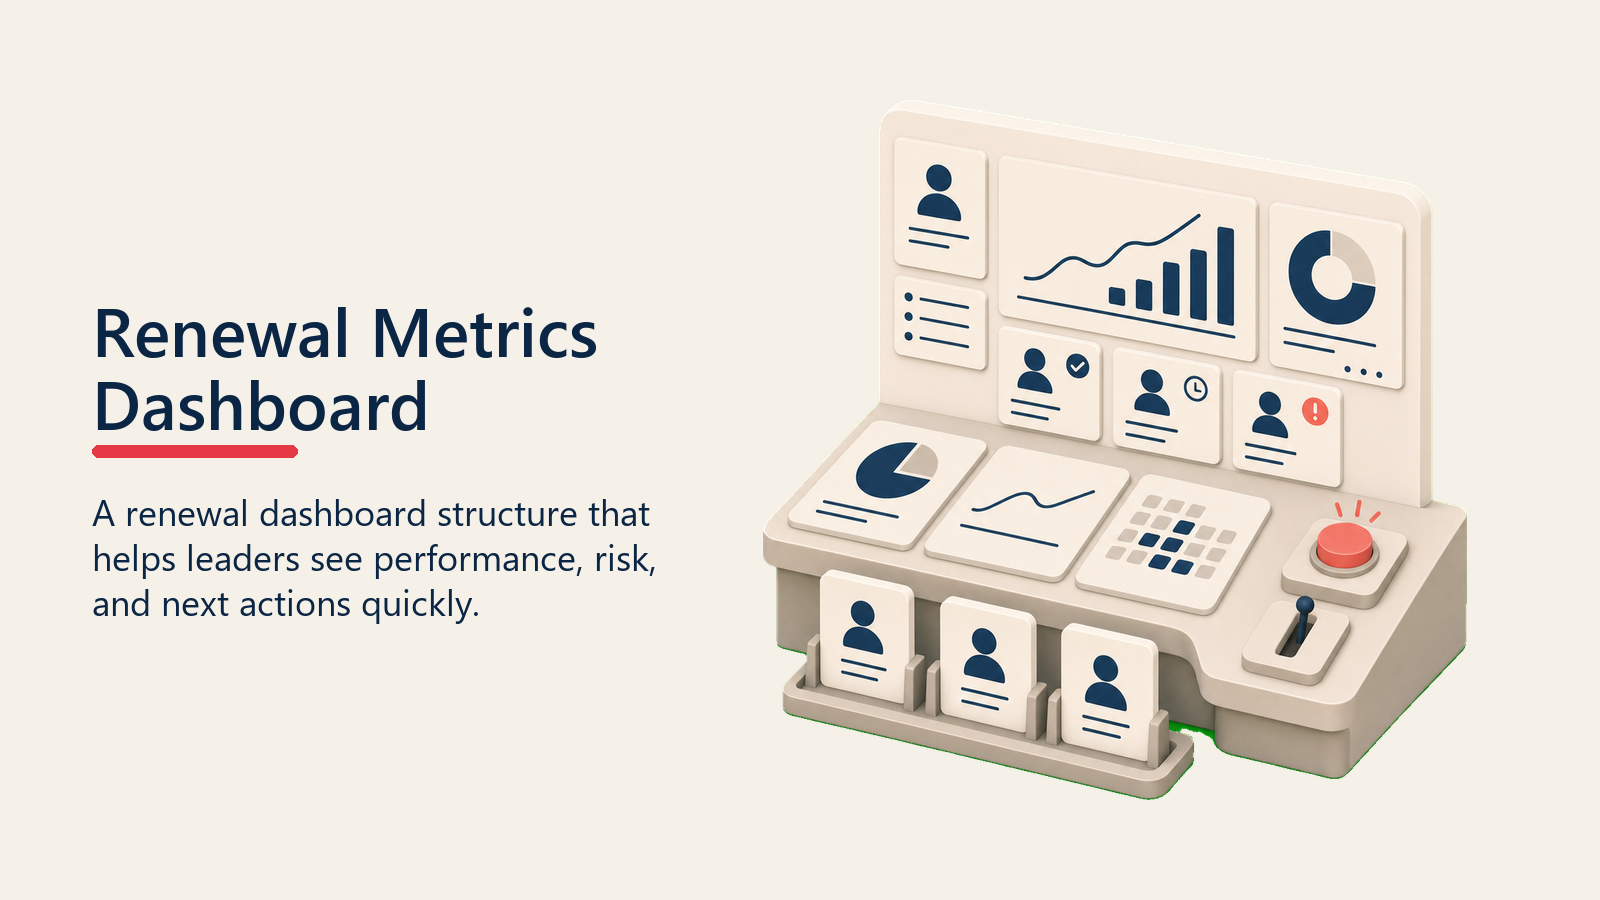
Building Dashboards People Actually Use
Most renewal dashboards fail because they show everything instead of showing what matters.
For Executives (Monthly or Quarterly):
One page. That's it. Include:
- Period renewal rate and NRR
- Renewal ARR and churn ARR
- Forecast for upcoming period
- At-risk ARR and save progress
- Key trends and issues (three bullets maximum)
Your CEO doesn't need to know your pipeline stage distribution. She needs to know whether renewals are on track and what's at risk.
For CSMs (Daily/Weekly):
Operational dashboard focused on action:
- Individual book of business renewal rate
- Upcoming renewals (next 30/60/90 days) with current stage
- At-risk accounts flagged for immediate attention
- Next steps and action items
CSMs should open this dashboard and immediately know what to do today. If they're scrolling through metrics trying to figure out priorities, the dashboard failed.
For Renewal Operations:
Process and efficiency focused:
- Cycle time by stage
- Discount analysis and trends
- Escalation patterns
- Team capacity and workload
- Coaching priorities based on performance gaps
Operations leaders need different data than CSMs. They're optimizing the machine, not working individual deals.
Forecast Accuracy Tracking:
Compare forecasted vs. actual renewals every week:
- Current quarter forecast evolution (how has it changed each week?)
- Next quarter early forecast
- Accuracy trends over time
- Individual CSM forecasting patterns
You can't improve forecast accuracy without tracking it systematically. Most teams "feel like" their forecasts are good without actually measuring.
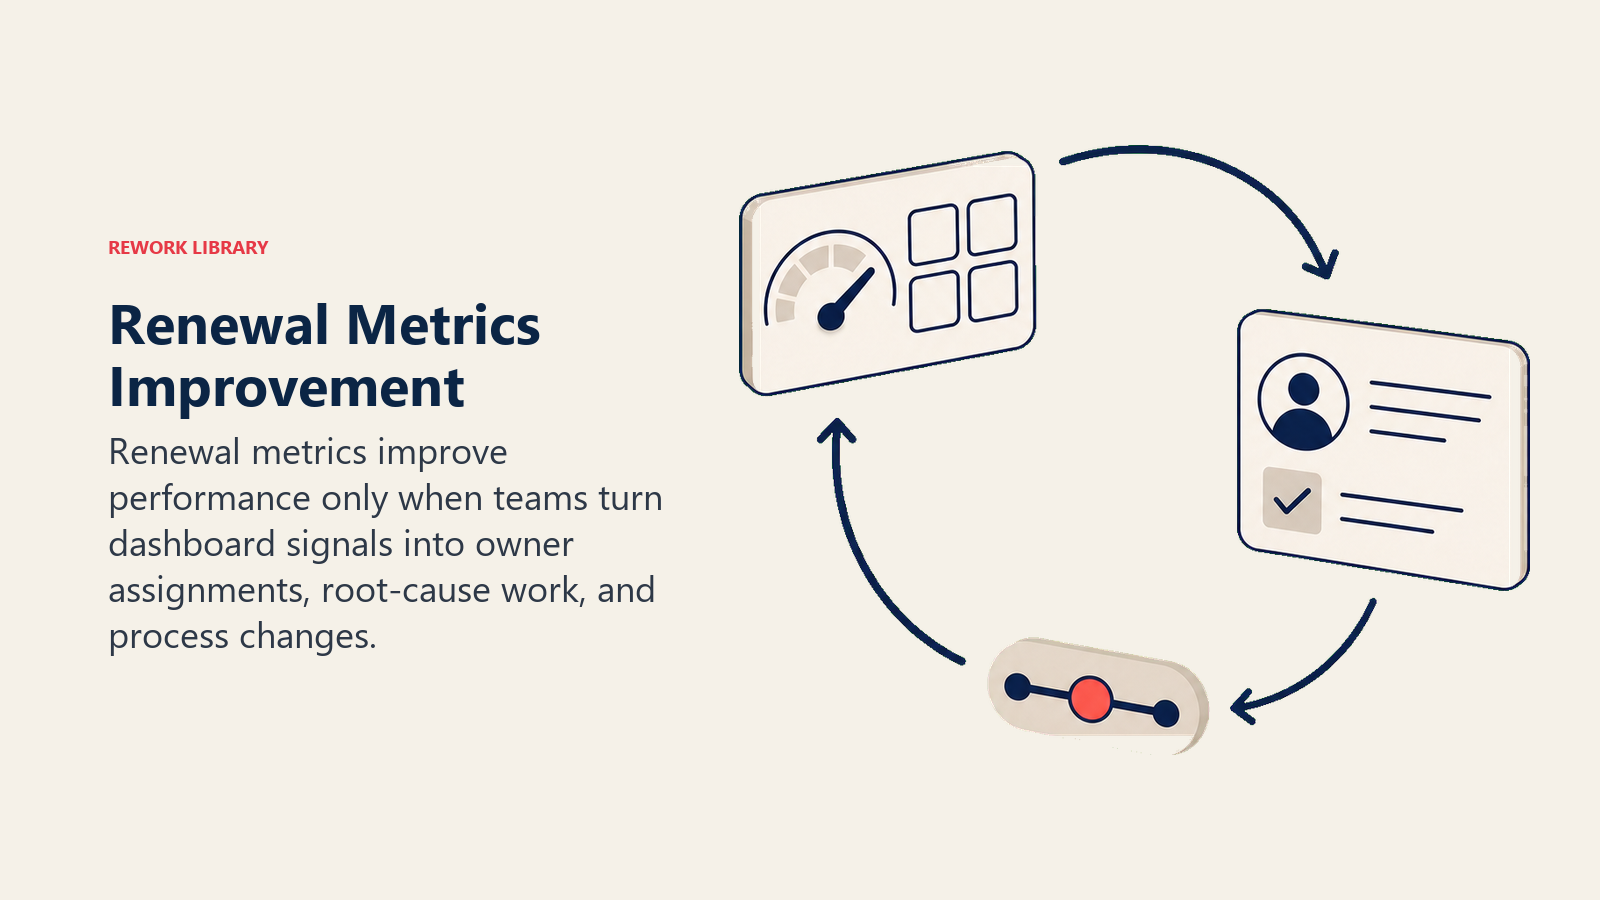
Using Metrics to Actually Improve Performance
Metrics without action are just scorekeeping. Here's how to turn numbers into improvement:
Run Regular Review Cadences:
- Daily: CSMs review their individual renewal pipeline and next actions
- Weekly: Team pipeline reviews with stage-by-stage analysis
- Monthly: Performance analysis, forecast accuracy, trend identification
- Quarterly: Strategic review, target adjustments, process improvements
Dig Into Root Causes:
When metrics show problems, ask why:
- Why is renewal rate declining? (Is it one segment? One CSM? One product? Timing-based?)
- What causes long proposal-to-close times? (Legal reviews? Procurement? Budget approvals? Internal disagreement?)
- Which customer segments drive at-risk ARR? (And can we prevent them from becoming at-risk earlier?)
- What differentiates high-performing CSMs from struggling ones? (Skills? Portfolio? Process? Luck?)
Most teams stop at "renewal rate is down." Great teams figure out exactly why and fix the specific problem.
Fix Process Bottlenecks:
Metrics show you where your process breaks:
- Long time-in-stage at proposal? Your proposals aren't good enough or you're sending them too early.
- High escalation rates? Your CSMs lack authority, training, or confidence.
- Low forecast accuracy? Poor qualification or sandbagging.
Don't just track these metrics. Use them to identify and eliminate friction in your renewal process.
Coach Based on Data:
Generic coaching doesn't work. Use metrics to provide specific, targeted coaching:
- CSMs with low renewal rates need discovery and value communication skills
- High discount rates indicate an inability to defend pricing
- Low early renewal rates suggest missed opportunity identification
- Long cycle times might mean poor time management or inability to create urgency
When you tell a CSM "your renewal rate is 12 points below team average and your average discount is 18% compared to team average of 9%," that's a specific, actionable coaching conversation. "You need to improve" is useless.
Allocate Resources Intelligently:
Deploy your best people where they'll have the biggest impact:
- At-risk ARR concentration guides where to assign senior CSMs
- Segment renewal rates show where to invest in improvement programs
- Efficiency metrics reveal where to add capacity vs. fix process
- Save rates by CSM show who should handle high-risk escalations
If 60% of your at-risk ARR is in five enterprise accounts, don't spread your best CSMs across 50 low-risk SMB renewals. Put them on the accounts that matter.
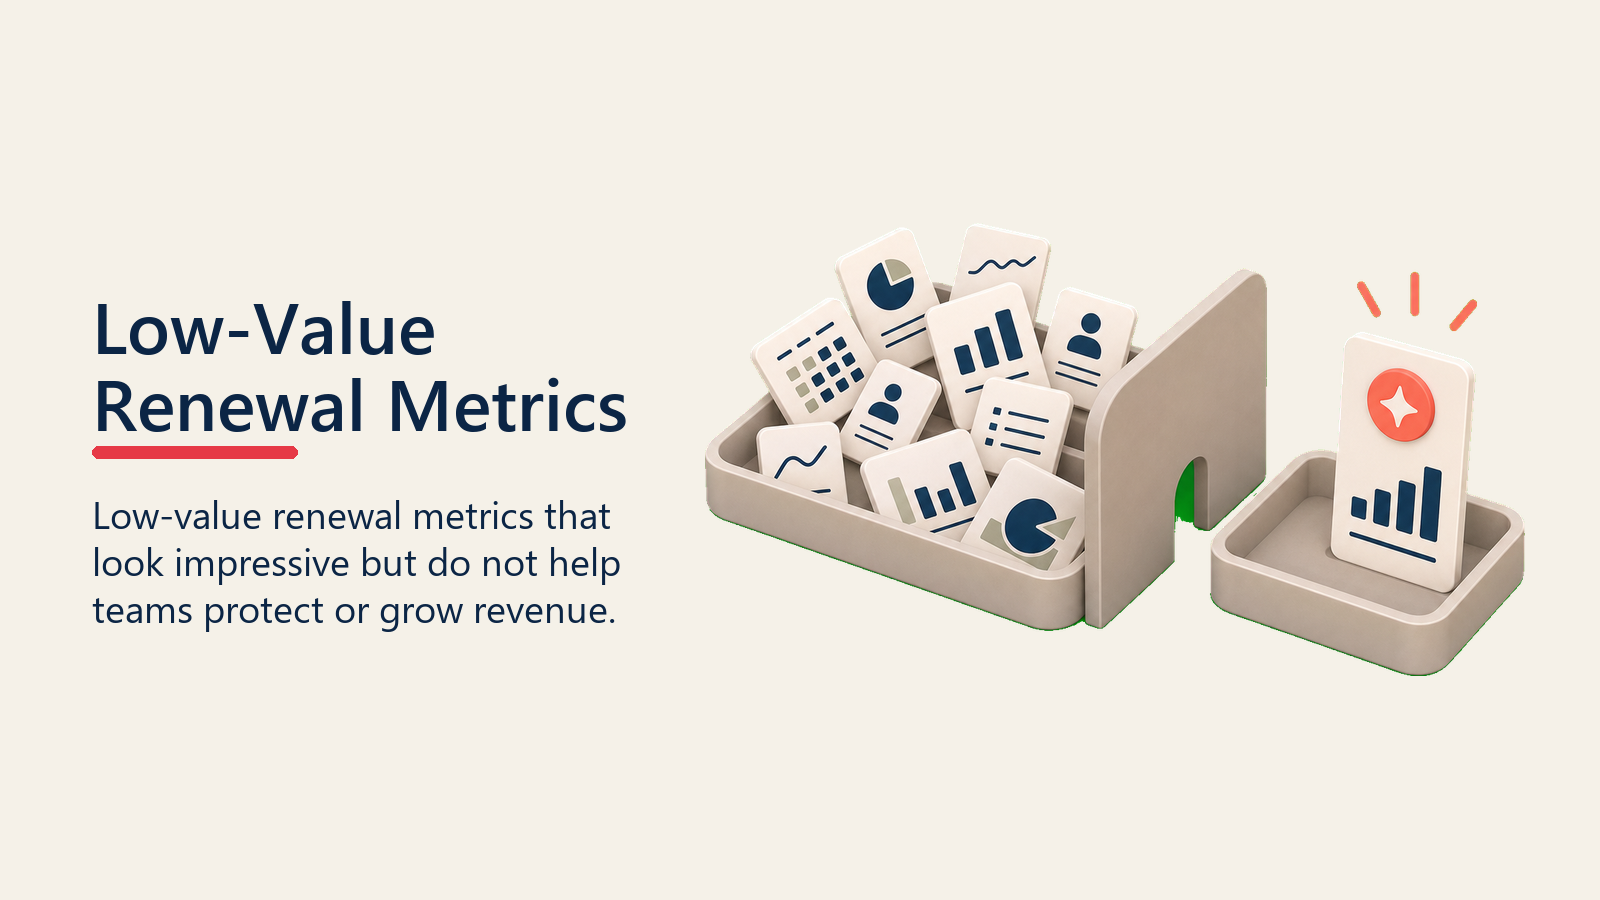
The Metrics That Don't Matter (And Why Teams Track Them Anyway)
Before you go build a renewal metrics empire, here's what you can safely ignore:
Activity metrics without outcome correlation - Number of emails sent, calls made, or meetings held. Unless you've proven these activities correlate with renewal outcomes, they're vanity metrics.
Renewal rate calculated monthly - Renewals are too lumpy for monthly trending to mean much. Quarterly is the minimum useful period.
NPS scores without action - Measuring satisfaction is fine. Obsessing over NPS while ignoring health scores, usage data, and renewal risk is measuring the wrong thing.
Pipeline coverage at the total level - Without stage-based weighting, your pipeline coverage number is meaningless. $2M in "Not Yet Engaged" opportunities doesn't equal $2M in "Negotiation" opportunities.
The best renewal metrics tell you three things: what's going to happen, why it's happening, and what to do about it. Everything else is just noise.
Related Resources:

Senior Operations & Growth Strategist
On this page
- What Gets Measured Gets Managed (But Only If You Measure the Right Things)
- The Only Three Metrics That Actually Matter for Leadership
- Pipeline Metrics (Because Renewals Don't Close Themselves)
- Process Efficiency Metrics (How Well Your Machine Actually Runs)
- Risk Metrics (Spotting Problems Before They Kill Deals)
- Early Renewal Metrics (The Secret Weapon Most Teams Ignore)
- Expansion Metrics (Because Renewals Should Grow Accounts, Not Just Keep Them)
- Leading Indicators (Predicting the Future Before It Happens)
- Segmentation Analysis (Because Averages Hide the Truth)
- Setting Benchmarks That Actually Mean Something
- Building Dashboards People Actually Use
- Using Metrics to Actually Improve Performance
- The Metrics That Don't Matter (And Why Teams Track Them Anyway)