Onboarding Metrics: Measuring and Improving the First 90 Days

Turn this article into takeaways for your work.
Each assistant summarizes the article only for you and suggests best practices for your work.
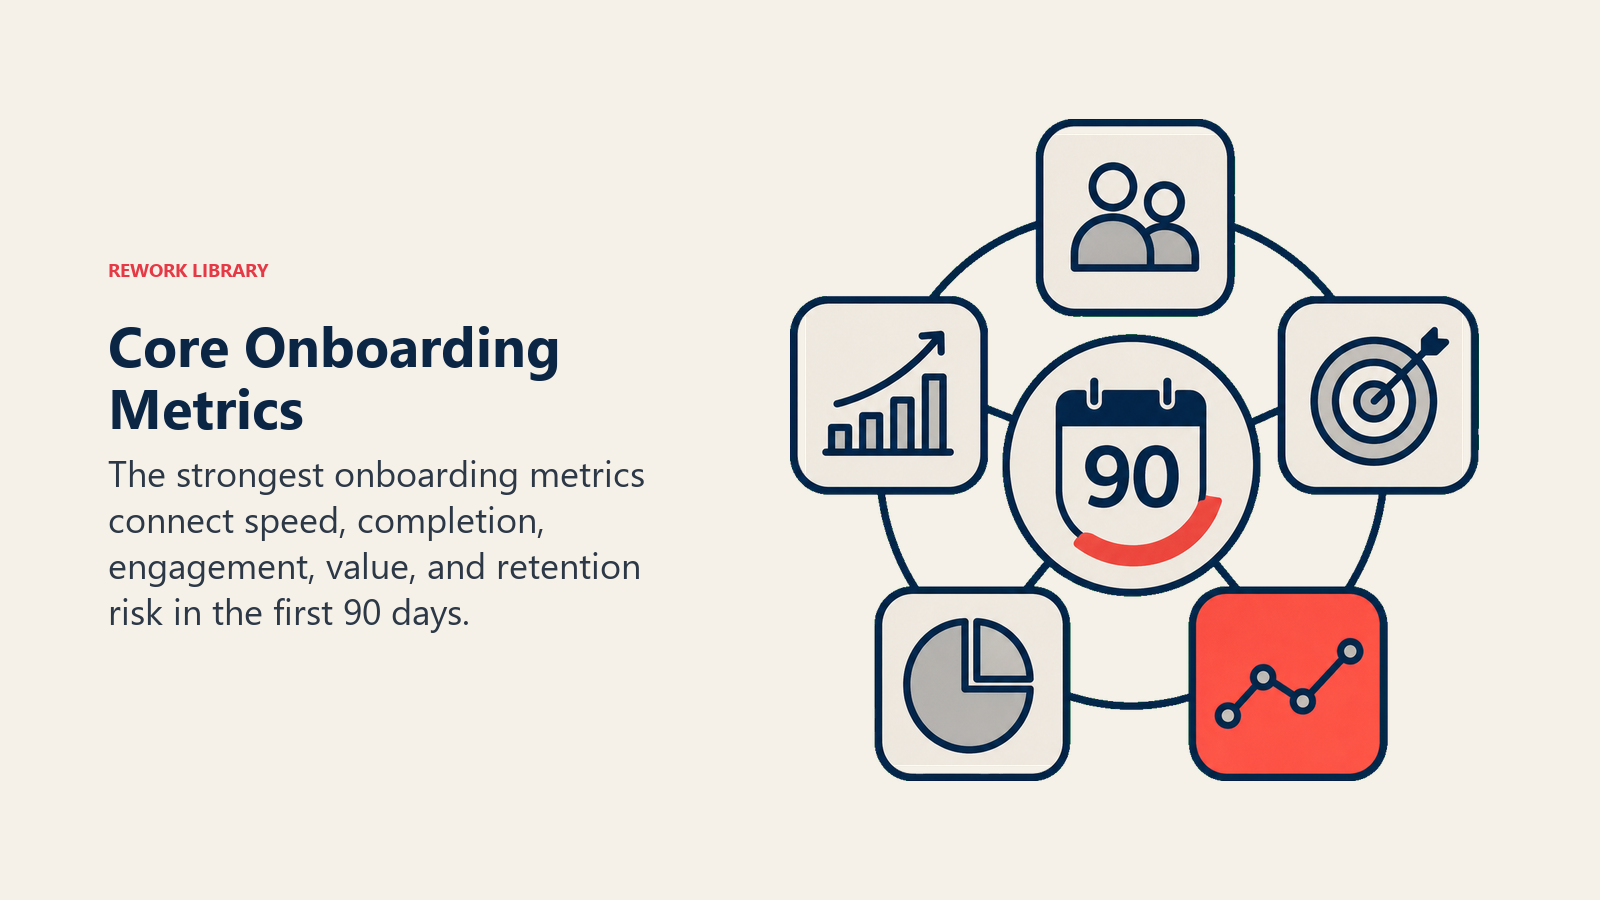
Onboarding metrics are the measures that track how well new customers reach value in their first 90 days, and they predict retention better than almost anything else. The core five are time to value, onboarding completion rate, early-stage health score, first 90-day retention, and onboarding NPS or CSAT. Watch leading indicators early, because churn is usually decided during onboarding.
A customer success leader inherited a team with 73% first-year retention and no idea why customers were churning. When she started tracking onboarding metrics, the story became clear:
Time to Value: 78 days average (industry benchmark: 45 days) Onboarding Completion Rate: 64% (never finished onboarding) Early Stage Health Score: 48% of customers flagged red/yellow in first 60 days First 90-Day Retention: Already losing 12% of customers before even reaching first renewal
The team wasn't tracking leading indicators. By the time customers churned at month 12, the outcome was determined months earlier during onboarding.
She implemented systematic metrics tracking. Within two quarters:
- Time to Value dropped to 52 days
- Completion Rate increased to 87%
- Early health scores improved dramatically
- First-year retention climbed to 89%
The lesson: You can't fix what you don't measure. Onboarding metrics aren't vanity dashboards. They're early warning systems that predict retention and guide improvement.
Core Onboarding Metrics
Time to Value (TTV)
This is the big one. TTV measures days from contract signature to first measurable business outcome. It's the strongest predictor of retention I've tracked. Fast TTV equals high retention. Every time.
Start the clock at contract signature (or trial start for product-led growth). Stop it when the customer confirms they've achieved value based on their success criteria. Track milestone dates in your CRM.
Benchmarks vary by segment:
- Enterprise: 30-60 days is world-class, 60-90 days is good, 90+ needs work
- Mid-Market: 20-45 days (world-class), 45-75 days (good), 75+ (needs work)
- SMB: 7-21 days (world-class), 21-45 days (good), 45+ (needs work)
- PLG: 1-7 days (world-class), 7-14 days (good), 14+ (needs work)
Report median TTV, not average. Averages get skewed by outliers. Also track your distribution: how many customers hit value in under 30 days versus 30-60, 60-90, or 90+? And watch the trend over time. Are you getting better or worse?
Time to Onboarding Completion
This measures process efficiency. Start at kickoff meeting, end at graduation when the customer meets all completion criteria. The key metric isn't just total time, but planned versus actual. How often do you finish on time?
Long onboarding correlates with higher churn risk. If your enterprise customers take 90+ days to complete onboarding, you're probably losing them before renewal even comes up.
Benchmarks:
- Enterprise: 60-90 days
- Mid-Market: 30-60 days
- SMB: 14-30 days
- PLG: 7-14 days
Track your on-time completion rate. What percentage finish within the planned timeline? And when things run late, dig into why. That's where you find the systemic issues.
Onboarding Completion Rate
This one's brutal but honest. What percentage of customers actually finish onboarding versus those who stall or abandon?
Customers who don't complete onboarding have dramatically higher churn. I've seen teams ignore this metric because it's uncomfortable. Don't. It tells you whether you're selecting the right customers and whether your process has too much friction.
Target 85%+ completion. If you're between 70-85%, you're doing okay but there's room for improvement. Below 70%? You've got serious problems with customer fit or your onboarding process.
The 120-day cutoff is important. If a customer hasn't completed onboarding within four months, they're effectively incomplete. They might still be using your product, but they never fully adopted it.
Analyze why incomplete customers failed. Was it their capacity? Product fit issues? Problems with your process? You'll usually find patterns by segment, CSM, or product tier.
Early Stage Health Score
This is your crystal ball. Calculate health score during the first 60-90 days based on onboarding progress and engagement. It predicts long-term success or failure better than anything else.
Build it from four components:
- Usage and engagement (product activity)
- Progress against milestones (on track vs delayed)
- Stakeholder engagement (champion and sponsor involvement)
- Value signals (early wins and positive feedback)
Score from 0-100. Green is 80-100 (high engagement, on track, positive signals). Yellow is 50-79 (moderate engagement, some delays, neutral signals). Red is below 50 (low engagement, significant delays, negative signals).
Target 70%+ green accounts with fewer than 15% red. If you're seeing less than 50% green or more than 25% red, your onboarding has fundamental issues.
This metric enables early intervention before problems compound. Red accounts at day 30 rarely turn green at day 90 without active intervention.
First 30/60/90 Day Retention
Early churn is rare, but when it happens, it screams problems. Track the percentage of customers still active at 30, 60, and 90 days post-onboarding start.
Use cohort analysis. Take all customers who started onboarding in January. How many are still active at the end of February (30 days)? End of March (60 days)? End of April (90 days)?
Benchmarks:
- 30-Day: 97%+ (early churn should be extremely rare)
- 60-Day: 94-97%
- 90-Day: 90-95%
If you're losing more than 5% of customers in the first 90 days, something's badly broken. Either onboarding has serious problems or your sales team is closing customers who shouldn't buy your product.
Onboarding NPS or CSAT
Direct feedback on your onboarding experience. Send a survey at onboarding completion.
For NPS, ask: "How likely are you to recommend our onboarding to a colleague?" (0-10 scale)
For CSAT, ask: "How satisfied are you with your onboarding experience?" (1-5 scale)
Always include open feedback: "What could we improve?"
Good NPS is 20-40, excellent is 40+. Below 20 needs serious attention. For CSAT, shoot for 4.0+ out of 5.0 (excellent), 3.5-4.0 is acceptable, below 3.5 needs work.
Here's what matters most: correlate satisfaction with retention. Does a high NPS actually predict retention? If not, customers are being polite but not really satisfied. The open feedback often tells the real story.
Activity and Engagement Metrics
Kickoff to First Login Time
Days from kickoff meeting to first customer login. This simple metric predicts onboarding momentum better than almost anything.
Fast login means engagement and urgency. Long delay means low prioritization or technical blockers.
Excellent is less than 24 hours. Good is 1-3 days. Concerning is more than 7 days.
If a customer takes more than a week to log in after kickoff, they're telling you this isn't a priority. Intervene immediately. Call the champion. Understand what's blocking them. Otherwise, you're looking at a 90-day onboarding that turns into 150 days.
User Activation Rate
What percentage of licensed users actually activate? Activation means they completed their first meaningful action in the product.
Calculate it as Activated Users divided by Total Licensed Users. Target 70-80%+ activation within 30 days. Between 50-70% is acceptable. Below 50% means your product isn't reaching end users.
Low activation has multiple causes. Maybe your champion bought licenses for their entire team, but half don't actually need the tool. Maybe the activation process is too complex. Maybe you're not doing enough to drive adoption beyond the champion.
Training Completion Rate
Track attendance for live sessions and completion for on-demand courses. Rate equals Completed divided by Required.
Training completion correlates strongly with adoption and retention. Lack of training leads to poor usage and frustration. Simple as that.
For enterprise customers with mandatory training, expect 85-95% completion. Mid-market should be 70-85%. For SMB with mostly self-serve training, 40-60% is typical.
When completion is low, figure out why. Are sessions scheduled at bad times? Is the content boring? Is it too long? Or is the customer just not prioritizing this?
Feature Activation by Day/Week
Which core features get activated and when during onboarding? Track feature activation events in your product analytics and map them to the onboarding timeline.
This shows adoption velocity and identifies features customers struggle to adopt. Compare actual activation patterns to your ideal sequence.
Ask yourself: Are customers activating features in the expected order? Which features take longest to activate? Do customers who activate features faster retain better?
This analysis often reveals surprises. Maybe customers are skipping a feature you thought was core. Maybe they're stuck on a feature that should be simple. That's where you focus improvement efforts.
Support Ticket Volume During Onboarding
Count tickets submitted during days 0-90. Categorize by type: technical, how-to, bug.
Good is fewer than 5 tickets per customer during onboarding. More than 10 tickets indicates significant friction.
High ticket volume isn't just a support burden. It's a signal. Ticket topics reveal training gaps or product issues. Look for patterns. What are the common questions? Those should be addressed in onboarding or documentation.
Customers with excessive tickets often require extra support throughout their lifecycle. That's a unit economics problem.
Milestone Tracking Metrics
Milestone Completion Timeline
Track actual versus planned completion dates for key onboarding milestones. The important ones:
Kickoff completed → Access and setup complete → Integration live → Data migration complete → Training complete → First production usage → Value achievement → Graduation
For each milestone, record planned date (from your implementation plan), actual date (when completed), and variance (days early or late).
On-time completion indicates strong project management. Delays compound. A milestone that's 5 days late usually pushes the next milestone out by 7-10 days because of scheduling conflicts and momentum loss.
On-Time vs Delayed Completion
What percentage of milestones get completed on time versus delayed? Define on-time as within 2 days of planned date. Anything more than 2 days late is delayed.
Excellent performance is 80%+ on-time. Good is 65-80%. Below 65% means your timeline estimates are consistently wrong or you're not managing projects effectively.
This metric reveals systemic bottlenecks. If 40% of customers miss the "security review complete" milestone, you know where to focus improvement efforts.
Critical Path Bottlenecks
Which milestones on the critical path most frequently cause delays? Track delay frequency by milestone and average delay duration. Analyze root causes.
Common bottlenecks I've seen:
Security reviews: 2-4 weeks typical delay. Enterprise security teams move slowly. Start this process earlier or work with legal to pre-approve standard configurations.
Data migration: Quality issues cause delays. Garbage in, garbage out. Customers often underestimate how messy their data is. Build in buffer time or do better discovery upfront.
Integration setup: API access delays. Customer IT teams take forever to provision credentials or open firewall rules. Push for this during pre-onboarding.
Training scheduling: Calendar conflicts. Everyone's busy. Book training dates during the sales process, not after contract signature.
Focus on fixing the highest-impact bottlenecks. Removing one systemic blocker can cut 10-15 days off your median TTV.
Predictive Metrics
Onboarding Health Score
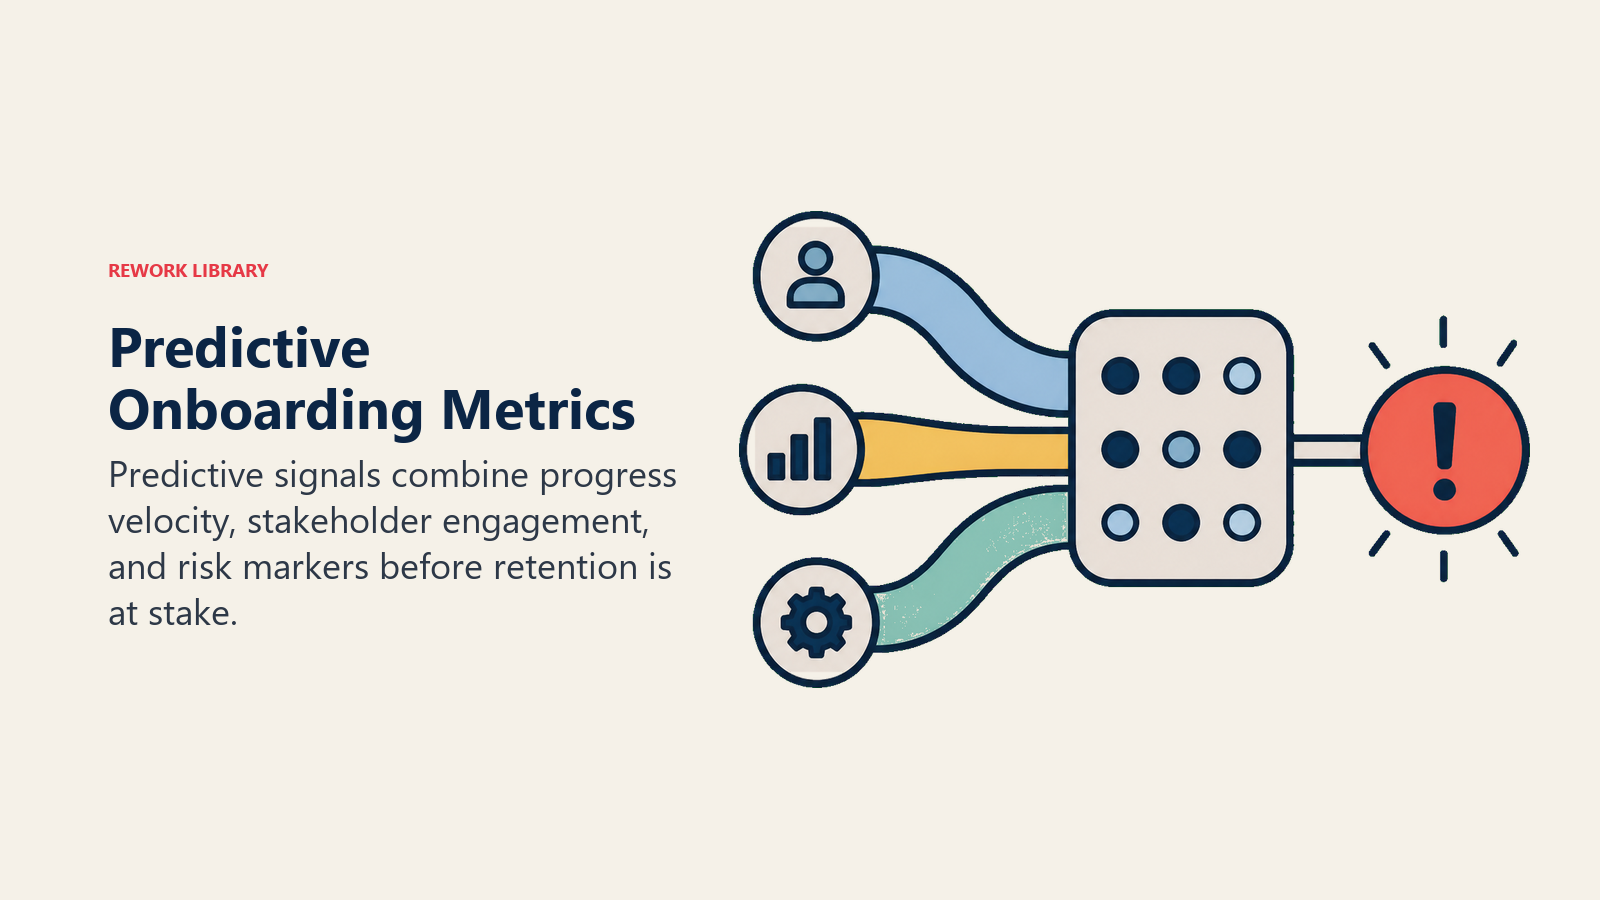
This composite score predicts onboarding success based on multiple signals. Weight the components based on what predicts retention in your business.
Example calculation:
- Progress velocity (milestones on time): 30% weight
- Engagement (usage, meeting attendance, responsiveness): 30% weight
- Value signals (early wins, positive feedback): 25% weight
- Risk signals (delays, low usage, stakeholder concerns): 15% weight (inverted)
- Total score: 0-100
Use this to flag accounts below threshold (say, 60) for intervention. Prioritize CSM attention on red and yellow accounts. And predict likelihood of successful graduation.
The beauty of a health score is it forces you to look at multiple signals together. A customer might have great usage but terrible milestone progress. Or high engagement from the champion but low activation across the broader team. The composite score catches what individual metrics miss.
At-Risk Indicators During Onboarding
Build automated alerts when these flags occur. Trigger intervention playbooks. Escalate red flag accounts to management.
Red flags:
- No login within 7 days of kickoff
- Usage declining week-over-week
- Missed 2+ scheduled meetings
- 30+ days past planned milestone
- Champion unresponsive or defensive
- Negative feedback in check-ins
- Support tickets expressing frustration
Yellow flags:
- Login but minimal usage
- Missed 1 scheduled meeting
- 10-20 days past milestone
- Slow to complete action items
- Neutral or vague feedback
Don't just track these. Act on them. Red flags need immediate executive escalation. Yellow flags need proactive outreach and support.
Correlation with Long-Term Retention
Do onboarding metrics actually predict retention? Segment customers by onboarding metric buckets and compare retention rates across segments.
Expected correlations:
- Fast TTV → Higher retention
- High completion rate → Higher retention
- Green health score → Higher retention
- High training completion → Higher retention
- Low support tickets → Higher retention
Real example from a SaaS company:
- TTV under 30 days: 96% retention
- TTV 30-60 days: 88% retention
- TTV 60-90 days: 79% retention
- TTV over 90 days: 65% retention
That's a 31 percentage point swing. TTV is clearly a strong predictor for this company. They should prioritize TTV reduction initiatives above almost everything else.
Run this analysis for all your core metrics. Identify which ones are the strongest predictors of retention in your business. Then optimize for those metrics ruthlessly.
Efficiency and Resource Metrics
CSM Time Investment Per Customer
Track hours your CSMs spend per customer during onboarding. Include meetings, emails, prep work, and documentation time.
This matters for capacity planning and identifying opportunities for automation or process improvement. If accounts are requiring 2x the expected time, figure out why. Is the process inefficient? Are these customers bad fits? Is this particular CSM less experienced?
Typical investment by segment:
- Enterprise: 40-80 hours total
- Mid-Market: 15-30 hours total
- SMB: 5-10 hours total
- Low-Touch: 1-3 hours total
Look for variance across CSMs. If one CSM consistently spends 50% more time than others, either they need coaching or they're doing something extra that should be standardized.
Cost Per Onboarding
Total cost to onboard a customer: CSM time plus tools plus training delivery costs. Multiply CSM hours by hourly cost (loaded rate including benefits and overhead). Add training delivery cost if you do live sessions. Add prorated tools and systems costs. Include implementation specialist time if applicable.
Your cost per onboarding should be less than 20% of first-year ACV. If it's higher, your unit economics don't work at scale.
Lower cost per onboarding equals better margins. But don't optimize cost at the expense of outcomes. A $500 onboarding that achieves 95% retention is better than a $200 onboarding that achieves 75% retention.
Use this metric to inform automation investment ROI. If you spend $100k to build self-service onboarding that cuts average time from 20 hours to 10 hours, you save your team 10 hours per customer. At $75/hour loaded cost, that's $750 per customer. If you onboard 200 customers per year, that's $150k in annual savings. The investment pays for itself in 8 months.
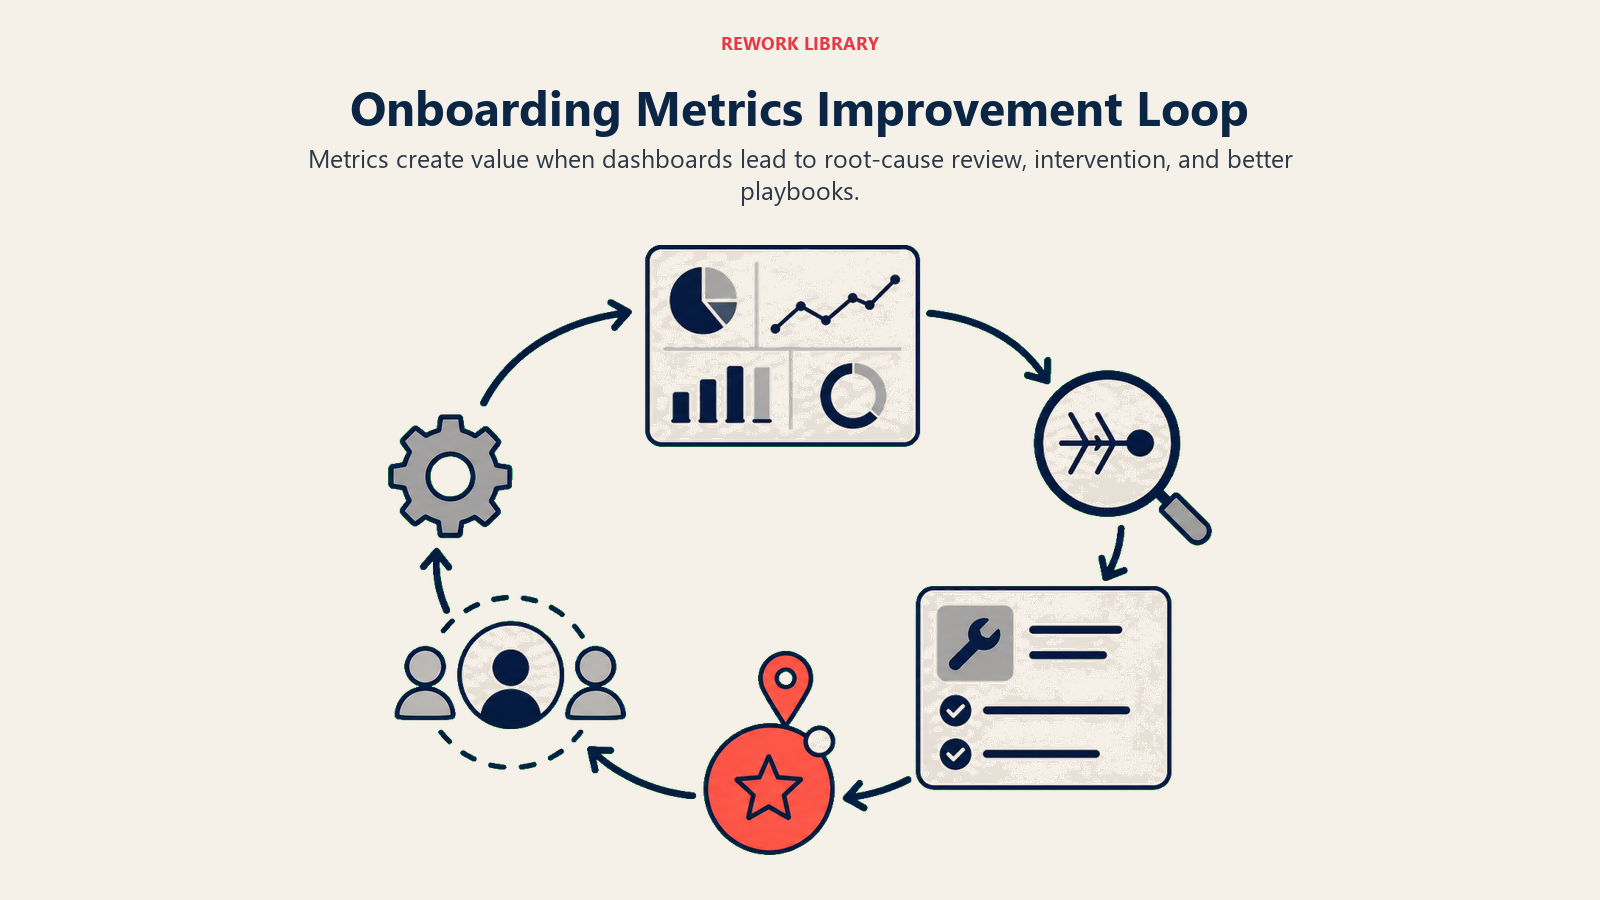
Using Metrics to Improve Onboarding
Dashboard Design and Reporting
Build three dashboards for three audiences:
Executive Dashboard (Monthly Review):
- Cohort TTV trend
- Completion rate trend
- Health score distribution
- First 90-day retention
- NPS/CSAT
Executives care about outcomes and trends. Is onboarding getting better or worse? Are we retaining customers? Are customers satisfied?
Operations Dashboard (Weekly Team Meeting):
- Active onboarding customers and their status
- At-risk accounts requiring intervention
- Milestone completion rate
- CSM capacity utilization
Operations leaders need to know what's happening right now. Who needs help? Where are the bottlenecks? Do we have capacity for new customers?
Individual CSM Dashboard (Daily Check):
- My active onboardings and health scores
- Upcoming milestones and deadlines
- Customer engagement signals
- Actions required
CSMs need tactical information. What do I need to do today? Which accounts need attention? What's coming up this week?
Root Cause Analysis of Outliers
When metrics go wrong, dig in. Don't just report the number. Understand why.
When TTV is unusually long: Interview both the customer and the CSM. Review the timeline and all delays. Identify the specific bottleneck. Was it customer capacity? Technical complexity? A problem with your process? Categorize the root cause and implement a fix to prevent recurrence.
When a customer has a low health score: Check engagement signals like usage and responsiveness. Review milestone progress. Talk directly to the customer to understand what's going on. Then develop an intervention plan. Don't just watch the score drop.
When completion rate drops: Analyze the incomplete customers. Why didn't they finish? Look for patterns by segment, CSM, or product tier. Maybe you're seeing a bunch of SMB customers who all stalled at the same milestone. That's a systemic issue. Fix the process or product, not just the individual cases.
Experimentation and Optimization
Test variations of your onboarding process:
- Variation A: Control (current process)
- Variation B: Test (process change)
- Measure: TTV, completion rate, satisfaction
- Analyze: Which performed better?
- Roll Out: Winning variation becomes new standard
Example tests to run:
- Pre-onboarding prep versus no prep
- Template-based setup versus fully custom
- Live training versus on-demand only
- Weekly check-ins versus bi-weekly
One company tested pre-onboarding prep. They sent new customers a 30-minute video and setup checklist before kickoff. Customers who completed the prep had 12 days faster TTV and 18% higher completion rates. The prep became standard.
Another company tested weekly versus bi-weekly check-ins. Weekly check-ins had slightly better outcomes (3 days faster TTV), but required 25% more CSM time. They calculated the ROI and decided it wasn't worth it except for high-value enterprise accounts.
Test, measure, decide. That's how you optimize systematically instead of based on opinions.
The Bottom Line
Onboarding metrics aren't vanity dashboards for executive presentations. They're operational intelligence that enables continuous improvement, early intervention, and predictable customer success.
Teams that systematically track and act on onboarding metrics achieve:
- 30-50% faster time to value
- 85%+ onboarding completion rates
- 15-25 percentage point higher retention
- Predictable resource needs and capacity planning
- Continuous improvement culture
Teams that fly blind or rely on gut feel experience:
- Unpredictable onboarding outcomes
- Late discovery of at-risk customers
- No visibility into what's working or broken
- Inability to prove ROI of CS investment
- Stagnant or declining retention
The framework is straightforward. Track core metrics (TTV, completion rate, health score, retention, satisfaction). Monitor activity metrics (engagement, training, usage). Watch milestone metrics (on-time completion, bottlenecks). Use predictive metrics (health score, at-risk flags, retention correlation). Measure efficiency (CSM time, cost per onboarding).
Then act on what you learn. Your retention depends on it.
Frequently Asked Questions
What are the most important onboarding metrics to track?
The five core onboarding metrics are time to value (TTV), onboarding completion rate, early-stage health score, first 30/60/90-day retention, and onboarding NPS or CSAT. TTV is the single strongest predictor of long-term retention. Support these with activity metrics like activation rate and milestone on-time completion.
What is a good time to value benchmark?
Time to value benchmarks vary by segment. Enterprise: 30 to 60 days is world-class. Mid-market: 20 to 45 days. SMB: 7 to 21 days. Product-led growth: 1 to 7 days. Report median TTV rather than average, since outliers skew the mean, and track the trend over time.
What onboarding completion rate should teams aim for?
Target 85 percent or higher onboarding completion. Between 70 and 85 percent is acceptable but has room to improve, and below 70 percent signals serious problems with customer fit or process friction. Use a 120-day cutoff: customers who haven't completed onboarding within four months are effectively incomplete. See onboarding completion criteria for definitions.
How do onboarding metrics predict churn?
Onboarding metrics are leading indicators: most churn is decided during onboarding, months before the customer actually leaves. Faster TTV, higher completion, and green early health scores correlate with materially higher retention. Tracking customer health monitoring and retention metrics together lets teams intervene before at-risk accounts churn.
Ready to implement onboarding metrics? Explore onboarding fundamentals, time to value optimization, and customer health monitoring.
Learn more:

Senior Operations & Growth Strategist
On this page
- Core Onboarding Metrics
- Time to Value (TTV)
- Time to Onboarding Completion
- Onboarding Completion Rate
- Early Stage Health Score
- First 30/60/90 Day Retention
- Onboarding NPS or CSAT
- Activity and Engagement Metrics
- Kickoff to First Login Time
- User Activation Rate
- Training Completion Rate
- Feature Activation by Day/Week
- Support Ticket Volume During Onboarding
- Milestone Tracking Metrics
- Milestone Completion Timeline
- On-Time vs Delayed Completion
- Critical Path Bottlenecks
- Predictive Metrics
- Onboarding Health Score
- At-Risk Indicators During Onboarding
- Correlation with Long-Term Retention
- Efficiency and Resource Metrics
- CSM Time Investment Per Customer
- Cost Per Onboarding
- Using Metrics to Improve Onboarding
- Dashboard Design and Reporting
- Root Cause Analysis of Outliers
- Experimentation and Optimization
- The Bottom Line
- Frequently Asked Questions
- What are the most important onboarding metrics to track?
- What is a good time to value benchmark?
- What onboarding completion rate should teams aim for?
- How do onboarding metrics predict churn?