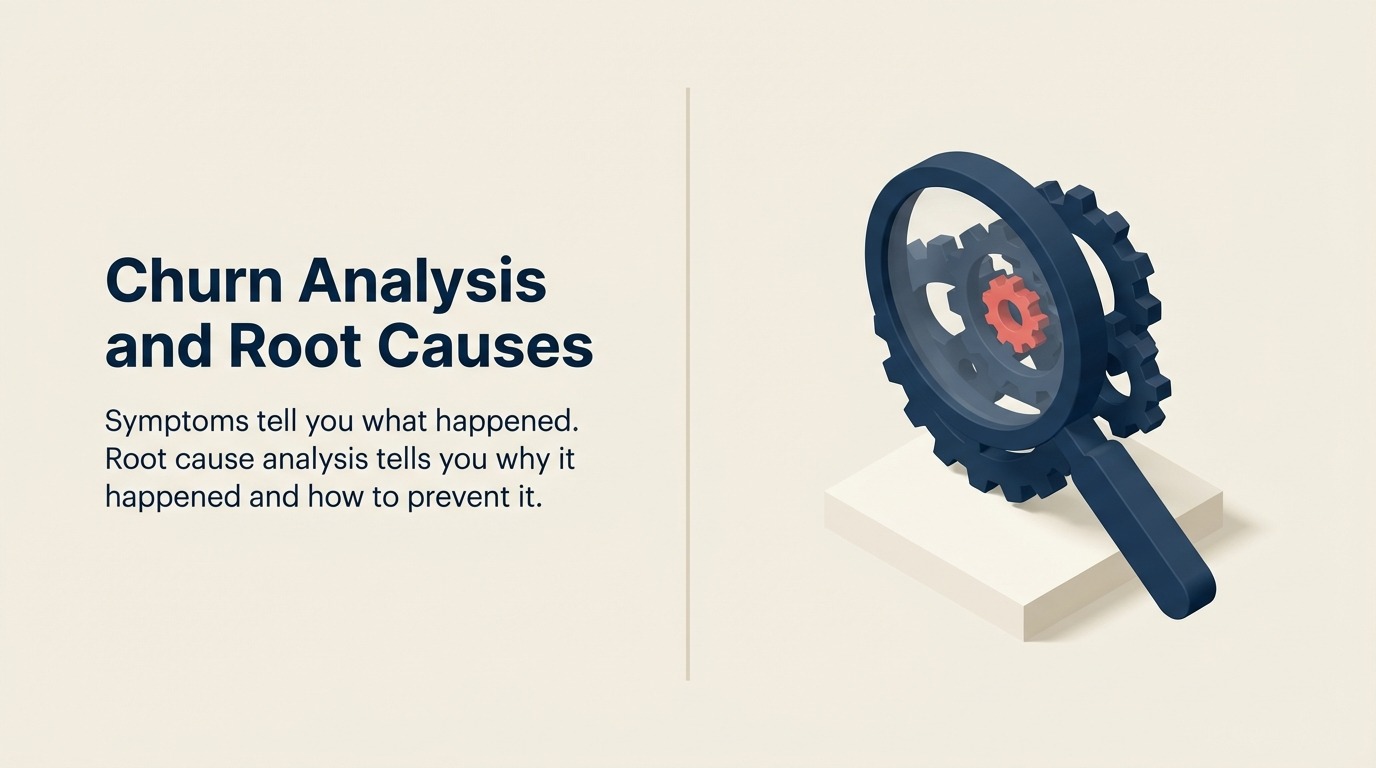
Churn Analysis and Root Causes: Understanding Why Customers Leave
Turn this article into takeaways for your work.
Each assistant summarizes the article only for you and suggests best practices for your work.
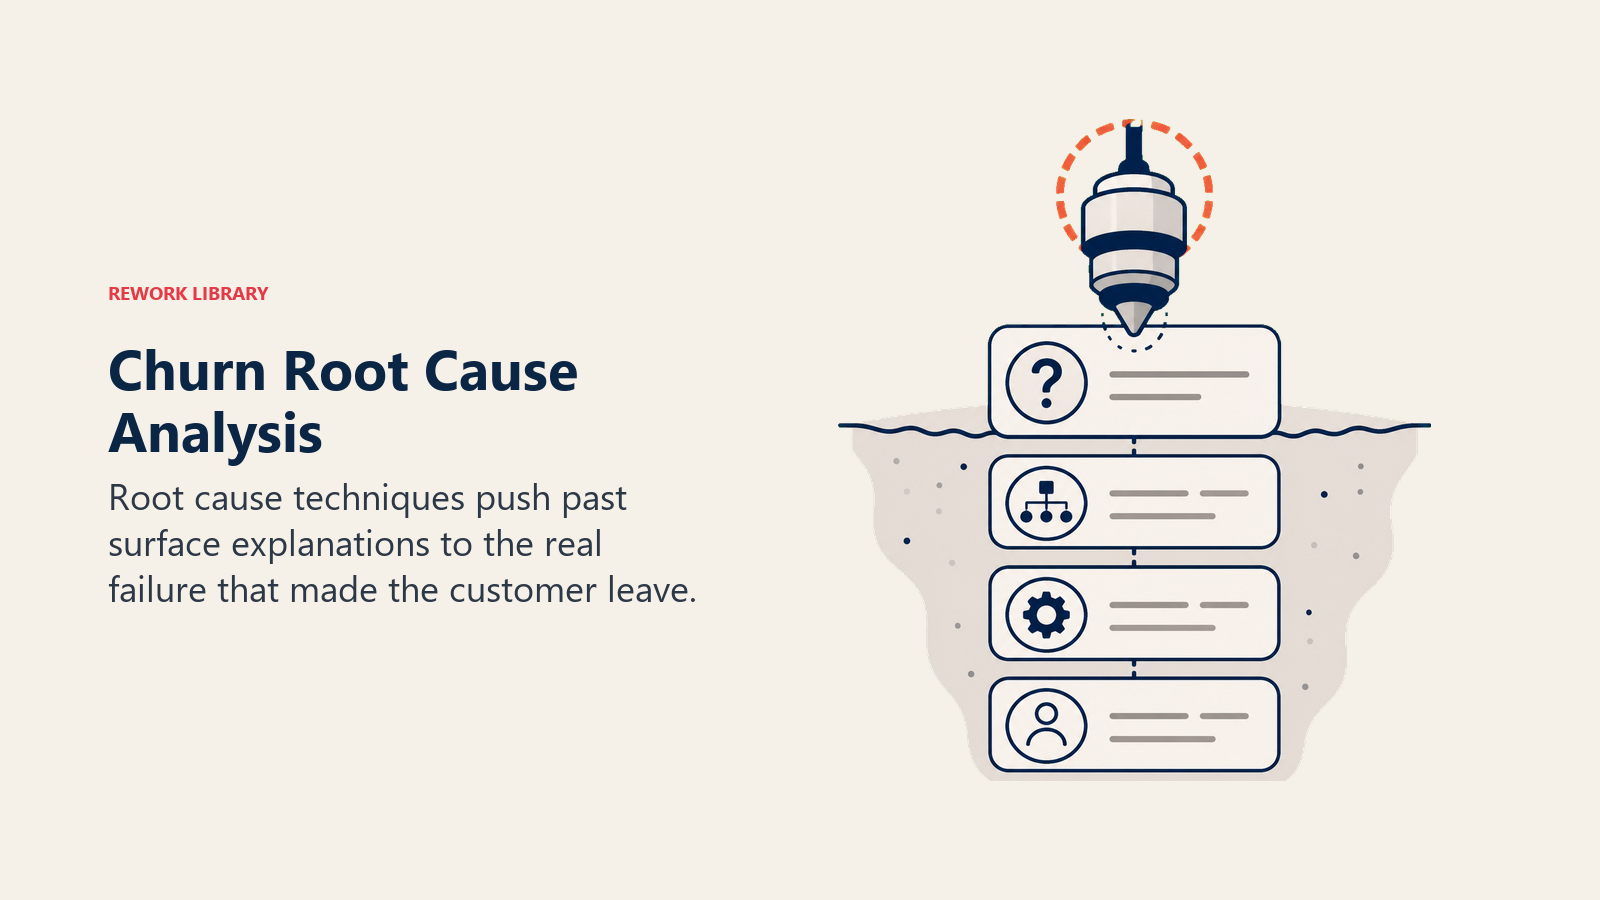
Churn analysis is the systematic process of investigating why customers leave by pulling data from multiple sources, grouping churned accounts into patterns, and using techniques like the 5 Whys to separate surface symptoms from true root causes. The goal is not a report, it's a prioritized list of fixable problems that reduce future churn.
Your churn report says customers are leaving because of "budget constraints" and "lack of usage." So you run a discount campaign and send more activation emails. Churn barely budges.
Here's the problem: you're treating symptoms instead of identifying root causes. "Budget constraints" might really mean "we didn't see enough value to justify the cost." "Lack of usage" could mean "the product was too complex to adopt" or "our internal champion left and no one else cared."
Surface-level churn reasons lead to surface-level fixes. Deep root cause analysis reveals the actual problems you need to solve. Product gaps, onboarding failures, sales misalignment, positioning issues. Those are fixable, but only if you dig deep enough to find them.
The companies that cut churn in half don't get lucky with better save tactics. They systematically analyze churn data, identify patterns, address root causes, and measure impact. It's investigative work. And it's how you build sustainable retention.
The Churn Analysis Framework: From Data to Action
Here's how churn analysis actually works.
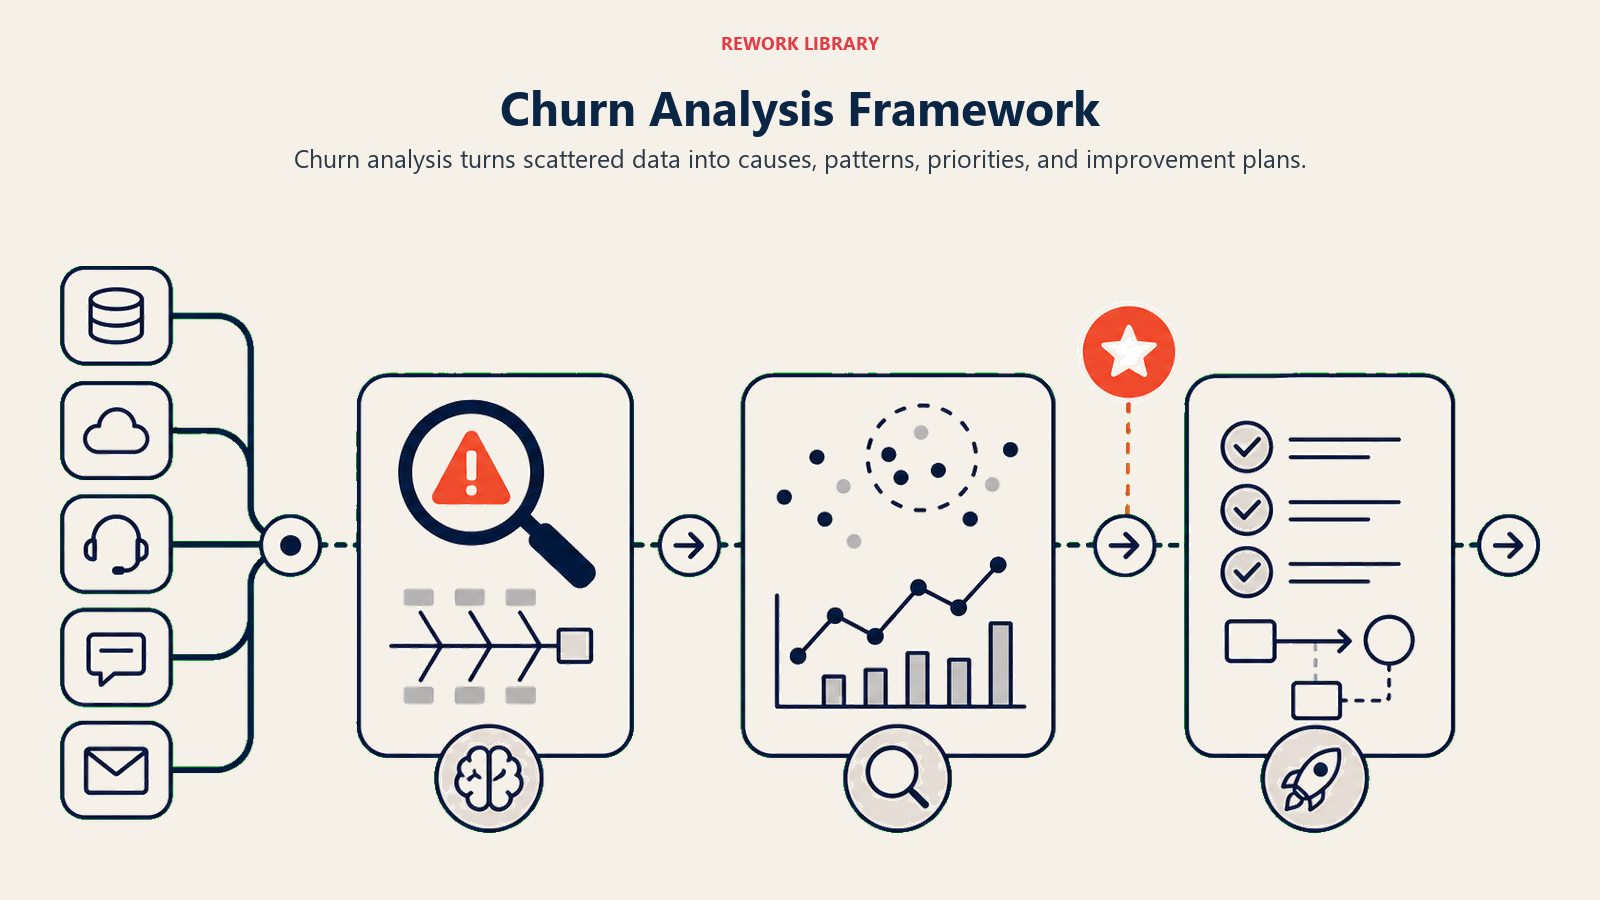
Data collection pulls information from every relevant source. Don't rely on one perspective. Pull from CRM data (customer attributes, history, interactions), product analytics (usage patterns, feature adoption, activity trends), support ticket history (issues, complaints, sentiment), exit surveys and interviews (stated reasons for leaving), CSM notes (relationship quality, concerns raised), and financial data (payment issues, price changes, expansions/contractions).
Gainsight found that companies using multi-source churn analysis identify root causes 3x more accurately than those relying only on exit surveys.
Categorization groups churned customers by observable patterns. Instead of treating all churn identically, you need segments. Stated reason (product, price, service, competition, business change). Customer segment (SMB, mid-market, enterprise). Tenure (churned in first 90 days vs year 3). Value (revenue impact). Preventability (could we have saved them?).
These categories reveal where to focus attention. If 60% of churn is preventable product issues in SMB accounts, that's very different from unpreventable business closures in enterprise.
Pattern analysis looks across categories to identify trends. Are certain customer types churning more than others? Do churn reasons differ by segment or tenure? Are churn rates increasing or decreasing over time? Do certain CSMs, sales reps, or products have higher churn?
Patterns point to systemic issues. Individual churns are anecdotes. Patterns are data.
Root cause identification uses structured techniques to go beyond surface symptoms. "Lack of usage" isn't a root cause, it's a symptom. The root cause might be poor onboarding, product complexity, or wrong customer targeting.
This is where most teams fail. They stop at symptoms because root cause investigation takes more work.
Action planning converts insights into initiatives. Say your root cause analysis reveals that 40% of SMB churn stems from integration complexity. Your action plan might include: Product builds simpler integration UI. CS creates integration-focused onboarding track. Sales better qualifies customers on technical capability. Marketing updates positioning to set realistic expectations.
Measuring impact tracks whether your interventions actually reduce churn. You need feedback loops. Did the new onboarding process reduce early churn? Did the integration improvements change retention for customers using those features?
Without measurement, you're guessing whether your fixes worked.
Data Sources: Where to Find Churn Insights
You need to pull data from across your organization.
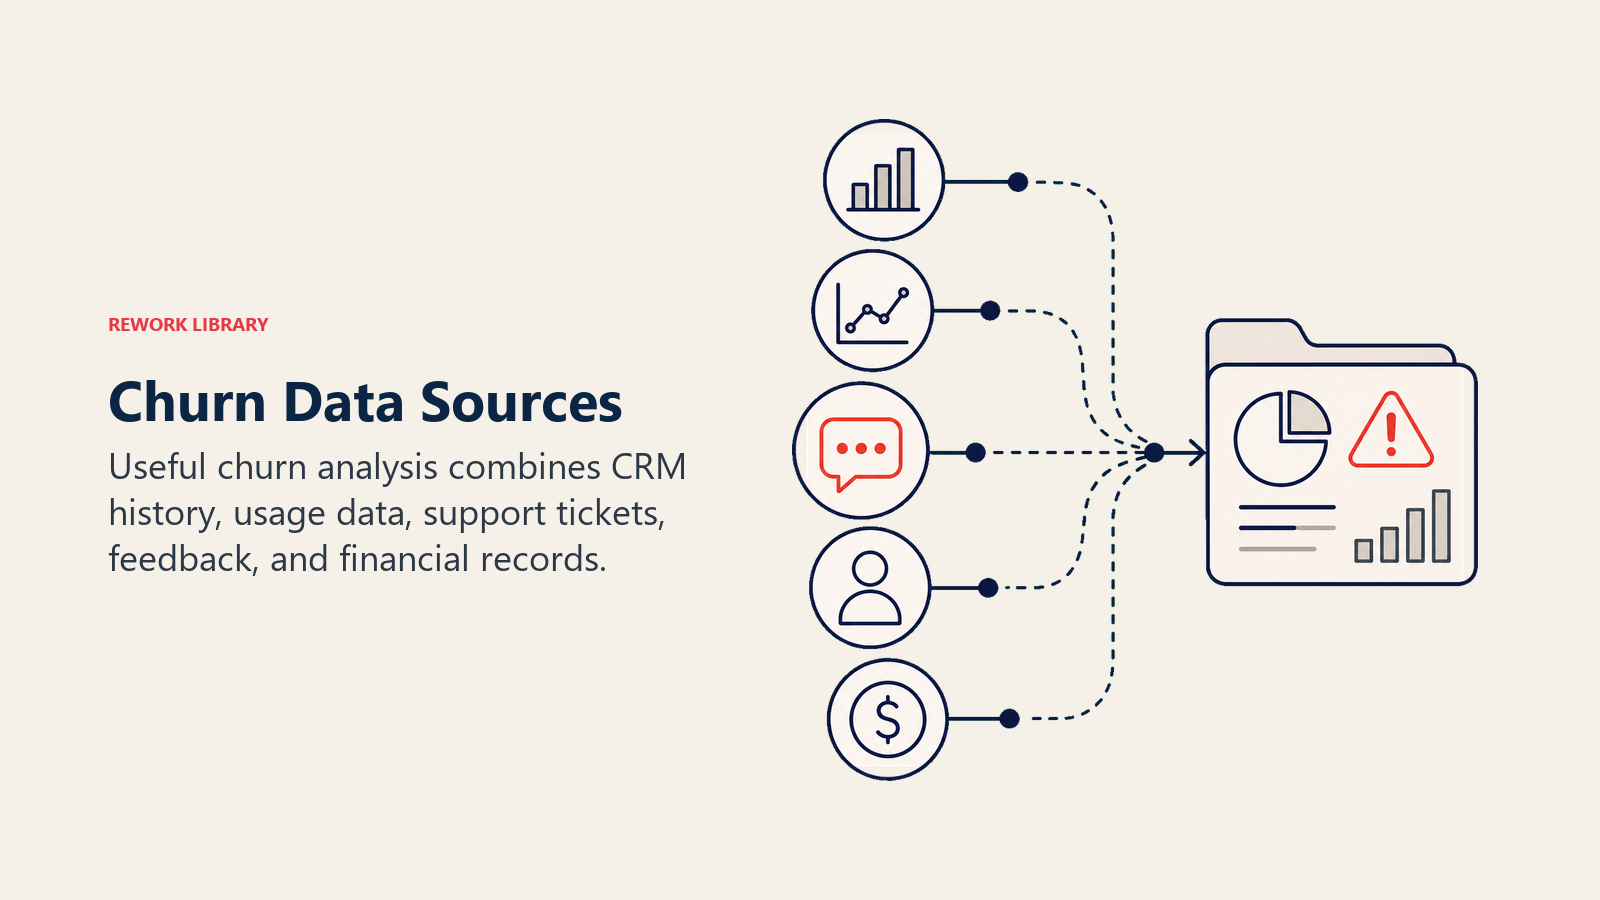
CRM records provide the foundational dataset. Customer demographics (size, industry, geography). Contract details (start date, value, plan type). Lifecycle stage and health score history. Touchpoint history (when did we last engage?). Renewal dates and outcomes.
Salesforce or HubSpot data shows you who churned, when, and basic characteristics. But it rarely tells you why.
Product usage analytics from tools like Amplitude, Mixpanel, or your own analytics reveal behavior patterns. Login frequency before churn. Feature adoption rates. Usage trends (increasing vs declining). Time to value milestones. Engagement depth.
Slack found that teams using the product daily in the first week have 90% retention vs 30% retention for those logging in only once. Usage patterns are predictive.
Support ticket data surfaces issues and frustrations. Ticket volume and frequency. Issue types and severity. Resolution time and satisfaction. Escalations and repeat issues.
Zendesk's analysis shows that customers filing 5+ tickets in the month before renewal churn at 3x the rate of those filing 0-1 tickets. Support friction predicts churn.
Exit surveys and interviews capture direct feedback. Stated reasons for cancellation. What would have changed their decision. Where they're going instead. What they valued most (and least).
Surveys give you the customer's narrative. Just remember that stated reasons often differ from actual root causes. "Too expensive" might mean "not valuable enough."
CSM observations and notes add qualitative context. Relationship quality. Stakeholder engagement. Concerns raised in conversations. Implementation challenges.
CSMs often see churn coming before it shows up in data. Their notes contain early warning signals and context that numbers miss.
Financial and billing data reveals payment-related factors. Failed payment attempts. Pricing plan changes. Discount history. Expansion/contraction patterns.
Recurly found that involuntary churn from failed payments represents 20-40% of total churn. If you're not analyzing payment failure patterns, you're missing a huge, fixable churn driver.
Categorizing Churn: Creating Useful Taxonomies
Not all churn is created equal. Good categorization creates actionable groups.
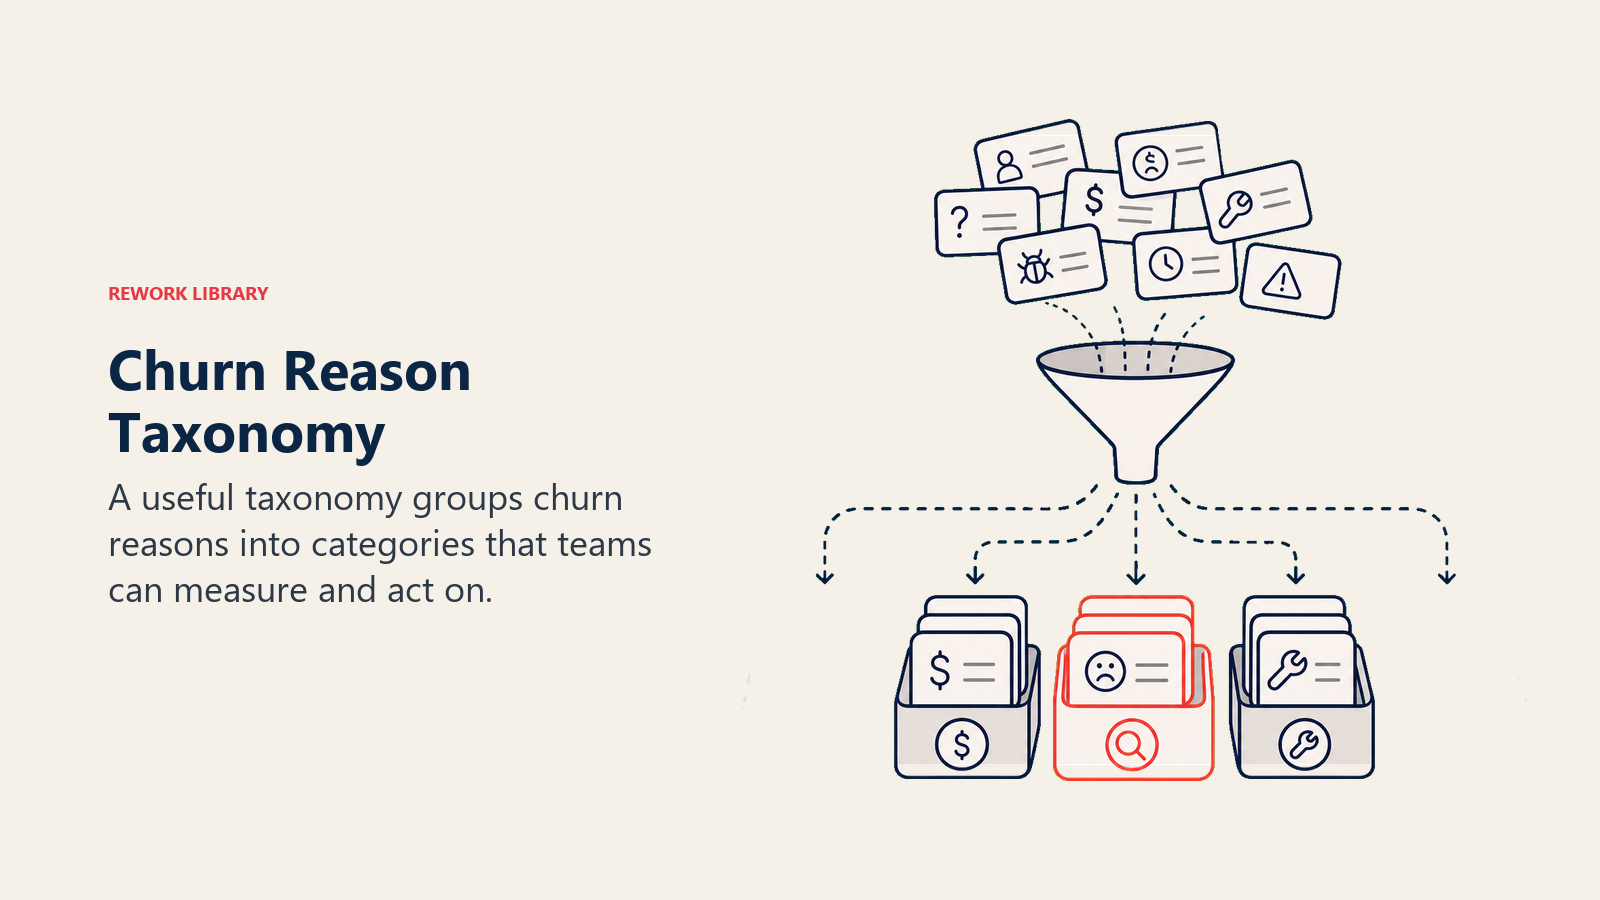
By stated reason captures what customers tell you. Product doesn't meet needs (missing features, bugs, complexity). Too expensive / budget cuts. Poor service or support. Switching to competitor. Business closed or changed direction. Champion left / internal changes. Not using it enough.
These categories help, but they're often symptoms. Dig deeper.
By segment reveals whether certain customer types churn differently. SMB vs mid-market vs enterprise. Industry vertical (SaaS, healthcare, retail). Geography (North America, EMEA, APAC). Company size (employees, revenue).
If SMB healthcare customers churn at 50% while enterprise tech customers churn at 8%, you either have very different businesses or very different problems to solve.
By tenure shows when customers leave. Early churn (0-90 days) usually means onboarding failure. Mid-term churn (90-365 days) signals value realization failure. Late churn (1+ years) typically stems from relationship failure, competitive loss, or business change.
Intercom saw that 70% of churn happened in the first 90 days. They completely rebuilt onboarding and cut total churn by 40%. Tenure analysis revealed where to focus.
By value tier differentiates high-impact vs low-impact churn. Top 20% by ARR. Middle 60%. Bottom 20%.
Losing ten $2K accounts isn't the same as losing one $200K account. Value-weighted churn analysis ensures you're solving problems that matter to revenue.
By preventability separates what you can control from what you can't. Preventable (product issue we could fix, service failure, onboarding gap). Partially preventable (budget pressure but unclear value, competitive threat). Unpreventable (company went out of business, merger/acquisition, regulatory change).
ChartMogul estimates 60-70% of typical SaaS churn is preventable. That's where to focus effort.
Root Cause Analysis Techniques: Getting to Real Answers
Surface reasons rarely reveal true causes. You need structured investigation.
The 5 Whys technique iteratively asks "why?" to get from symptom to root cause.
Customer churned because: "Not using the product enough"
- Why? "They said it was too complicated"
- Why was it too complicated? "They couldn't figure out the integration"
- Why couldn't they figure it out? "No clear documentation or guidance during onboarding"
- Why no guidance? "Our onboarding process assumes technical capability we don't validate"
- Why don't we validate? "Sales doesn't qualify on technical resources"
Root cause: Sales qualification gap and onboarding assumption mismatch. Now you know what to fix.
Fishbone diagrams (Ishikawa diagrams) map potential causes across categories. Product (bugs, missing features, complexity, performance). People (CSM changes, champion departure, support quality). Process (onboarding gaps, communication breakdowns, renewal timing). External (competition, economy, industry changes).
This structured brainstorming helps teams identify causes they might otherwise miss.
Correlation analysis looks for statistical relationships between factors and churn. Do customers with low health scores churn more? Does churn correlate with support ticket volume? Do customers missing certain onboarding milestones churn more? Does CSM-to-customer ratio correlate with retention?
ProfitWell found that customers who complete onboarding checklists have 30% lower churn. That correlation became a focus area.
Cohort comparison examines differences between groups. Churned vs retained customers, what differs? High-churn periods vs low-churn periods, what changed? Churned accounts by CSM, do certain CSMs have better retention? Product plan comparison, which plans have better retention?
If customers on annual plans churn at 10% but monthly plans churn at 40%, your pricing model is contributing to churn.
Qualitative interviews with churned customers go beyond surveys. 30-minute conversations, not 3-question forms. Open-ended questions that encourage storytelling. Probing follow-up questions. Recording and transcribing for pattern analysis.
Gong.io analyzes these conversations with AI to identify themes across hundreds of exit interviews. Patterns emerge that individual responses miss.
Common Root Cause Categories: Where Churn Actually Comes From
When you dig past surface reasons, churn tends to cluster in predictable categories.
Product gaps or bugs are tangible failures. Missing features customers need. Bugs or performance issues that create friction. Product complexity that prevents adoption. Poor user experience that frustrates users.
Asana found that customers who hit bugs in their first week churned at 2x the rate of bug-free users. Product quality directly impacts retention.
The fix: prioritize retention-critical bugs and features based on churn analysis. Not all bugs matter equally. Fix the ones causing churn.
Poor onboarding and adoption failure means customers never reach value. Unclear implementation path. Too much time to first value. Lack of training or guidance. Implementation assistance gaps.
Dropbox Business reduced early churn by 25% by redesigning onboarding to focus on three specific "activation moments." First file shared, first folder created, first team member invited. Clear activation milestones reduce onboarding churn.
Insufficient ongoing value demonstration happens even with successful onboarding. Customers achieved initial value but plateau. Can't articulate ROI to stakeholders. Don't discover advanced features. See the product as a commodity.
Customers who don't see ongoing value become vulnerable to competitor pitches or budget cuts. Regular value reporting and optimization sessions combat this.
Poor service and relationship issues damage trust. Slow support response times. Unhelpful or dismissive support interactions. CSM turnover leaving customers feeling abandoned. Feeling ignored or deprioritized.
Totango's research shows that customers rating their CSM relationship below 7/10 churn at 3x the rate of those rating 9-10. Relationships matter more than most teams realize.
Economic factors and budget pressure are real but often mask value issues. Actual budget cuts (cost reduction initiatives). Perceived lack of ROI. Price increases without value justification. Better pricing from competitors.
When customers say "too expensive," ask what they're comparing it to. Often it's not absolute cost but relative value. Strengthening value perception addresses "budget" churn.
Competitive displacement means someone else won the customer. Competitor has features you lack. Competitor offers better pricing. Competitor has better brand or market position. Competitor executed better sales/CS motions.
Losing consistently to the same competitor signals either product gaps or positioning failures. Track competitive losses to inform product and marketing strategy.
Internal champion departure removes your advocate. Key stakeholder leaves the company. Reorganization eliminates the team using your product. New leadership doesn't value the investment. Merger or acquisition changes priorities.
Customers with relationships to only one stakeholder are vulnerable. Multi-threading relationships across 3+ people dramatically improves retention.
Pattern Identification: Finding Trends in the Data
Individual churn events are interesting. Patterns across many churns are actionable.
Churn timing patterns reveal when problems occur. 35% churn in first 90 days? Onboarding issue. Spike at 12-month renewal? First-year experience doesn't cement value. Increase in Q4? Budget cycle alignment. Consistent 3% monthly regardless of tenure? Systemic value delivery issue.
Notion saw early churn clustered around "team didn't adopt" and built team onboarding features that reduced 90-day churn by 30%.
Segment susceptibility shows which customer types struggle. SMB churns at 45%, enterprise at 8%? Different engagement models needed. Healthcare vertical churns at 25%, tech at 12%? Industry-specific issues. Self-serve signups churn at 60%, sales-assisted at 20%? Qualification matters.
Build segment-specific retention strategies instead of one-size-fits-all approaches.
Product and feature correlation identifies which capabilities matter. Customers using feature X churn at 10%, those not using it churn at 35%. Customers with integration Y active have 90% retention. Customers exceeding usage threshold Z rarely churn.
Segment.io realized that customers sending data to 3+ destinations (integrations) had 95% retention vs 40% retention for those using 1-2. They built playbooks to drive multi-destination adoption, cutting churn significantly.
CSM and team performance differences reveal who's succeeding. CSM A has 95% retention, CSM B has 75% retention. Accounts onboarded by team X churn less than team Y. Customers in region A churn more than region B.
Are these differences due to customer mix or CSM effectiveness? Segment-normalize to find out. If CSM A's accounts are just bigger, that explains it. If they're handling the same account types better, learn from them.
Seasonal and temporal trends show external factors. Churn increased 40% in Q1 2023? Macroeconomic pressure. Summer months have 20% higher churn? Industry seasonality. Churn spiked after price increase? Pricing sensitivity.
External factors require different responses than internal failures.
From Analysis to Action: Building Improvement Plans
Analysis only matters if it drives change.
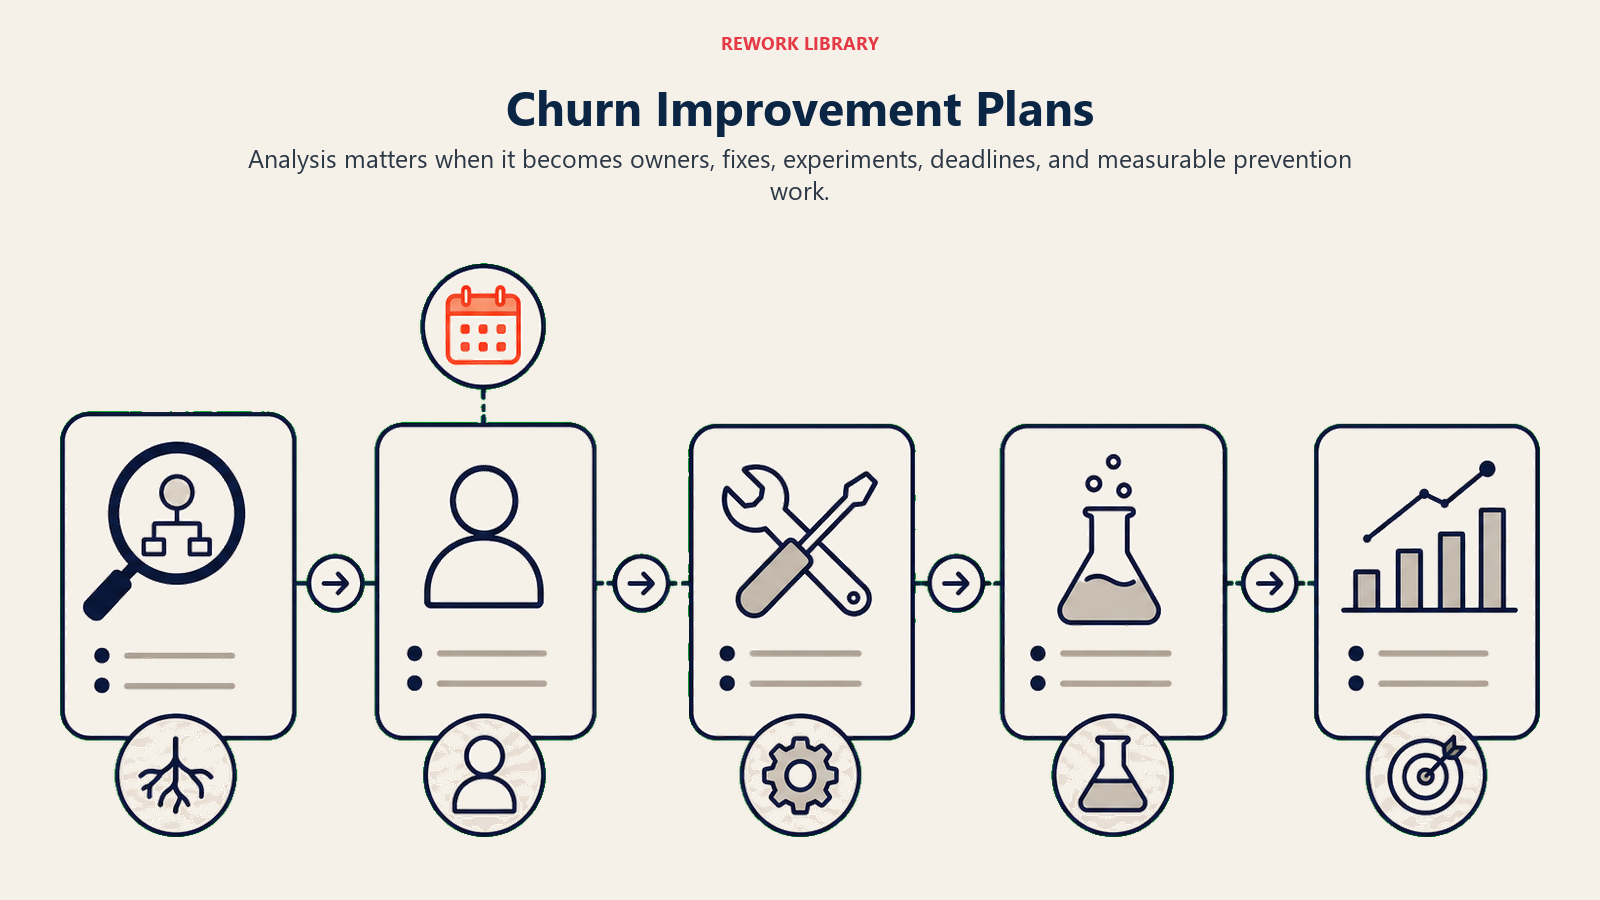
Prioritizing addressable causes focuses effort where it can make a difference.
High priority (fix immediately): Preventable causes affecting many customers. High-value customer churn drivers. Issues with clear, achievable solutions.
Medium priority (fix in 6-12 months): Partially preventable causes. Mid-value impact. Solutions requiring significant investment.
Low priority (monitor): Unpreventable causes. Low-value impact. Solutions economically infeasible.
If 30% of enterprise churn stems from missing Salesforce integration, that's high priority. If 5% of $5K accounts churn because they moved to a competitor in Australia, that's low priority.
Building improvement roadmaps translates insights into projects.
Product improvements: Feature development to close gaps. Bug fixes for retention-critical issues. UX improvements to reduce complexity. Integration builds for ecosystem compatibility.
Process improvements: Onboarding redesign for faster time-to-value. QBR structure changes for better value demonstration. Support SLA adjustments for responsiveness. Renewal process optimization.
Sales and marketing alignment: Qualification criteria to filter bad-fit prospects. Positioning changes to set accurate expectations. Target customer profile refinement.
Assigning accountability ensures follow-through. Product team owns feature and technical fixes. CS Ops owns process and playbook improvements. CS leadership owns team performance and structure. Sales leadership owns qualification and handoff. Executive team owns cross-functional initiatives and resourcing.
Without clear ownership, improvement initiatives die in "we should do something about that" purgatory.
Measuring impact closes the feedback loop. Baseline current churn rates by segment. Implement improvements. Track churn rates post-implementation. Calculate improvement (or lack thereof). Iterate based on results.
Zendesk implemented a new onboarding process for SMB customers, then tracked whether 90-day churn improved. It did, by 22%. They expanded the approach to mid-market and measured again. That's how you systematically reduce churn.
Continuous iteration makes churn analysis ongoing, not one-time. Monthly churn reviews by segment. Quarterly deep-dive root cause analysis. Annual strategic churn retrospectives. Constant feedback from churned customer interviews.
Companies that cut churn dramatically don't do it with one big initiative. They systematically analyze, improve, measure, and repeat for years.
Frequently Asked Questions
What is churn analysis? Churn analysis is the systematic study of why customers cancel or stop using a product. It combines data from your CRM, product analytics, support tickets, exit surveys, and CSM notes, then groups churned accounts into patterns and applies root cause techniques to find fixable problems rather than surface reasons.
What is the difference between a churn symptom and a root cause? A symptom is the stated reason, like "not using it enough" or "too expensive." A root cause is the underlying driver behind that symptom, such as a poor onboarding flow, product complexity, or weak sales qualification. Surface fixes target symptoms, while durable retention gains target root causes.
How do you find the root cause of churn? Use structured techniques. The 5 Whys iteratively asks "why" until you reach an actionable cause. Fishbone diagrams map causes across product, people, process, and external factors. Correlation and cohort analysis compare churned and retained customers to surface what actually differs.
What data sources should churn analysis use? Pull from at least six sources: CRM records, product usage analytics, support ticket history, exit surveys and interviews, CSM observations, and billing or payment data. Companies using multi-source analysis identify root causes far more accurately than those relying on exit surveys alone.
How much SaaS churn is actually preventable? Industry estimates put preventable churn at roughly 60-70% of total SaaS churn, driven by product gaps, onboarding failures, and service issues. Categorizing churn by preventability tells you where to focus, instead of spending effort on unpreventable losses like company closures.
Ready to transform churn data into retention improvements? Learn how to build churn prediction models that identify at-risk customers early, conduct effective exit interviews, implement save strategies, and establish voice of customer programs that surface issues before they cause churn.
Related resources:

Senior Operations & Growth Strategist
On this page
- The Churn Analysis Framework: From Data to Action
- Data Sources: Where to Find Churn Insights
- Categorizing Churn: Creating Useful Taxonomies
- Root Cause Analysis Techniques: Getting to Real Answers
- Common Root Cause Categories: Where Churn Actually Comes From
- Pattern Identification: Finding Trends in the Data
- From Analysis to Action: Building Improvement Plans
- Frequently Asked Questions