Churn Fundamentals: Understanding and Managing Customer Loss
Turn this article into takeaways for your work.
Each assistant summarizes the article only for you and suggests best practices for your work.
Managing churn means understanding why customers leave, measuring that loss accurately, and separating preventable churn from the inevitable kind. For most businesses, it is the difference between compounding growth and a leaky bucket. The fundamentals below cover churn types, economics, realistic benchmarks, and the principles that actually reduce avoidable loss.
Your company just closed $2M in new ARR this quarter. The sales team is celebrating. But when you run the actual numbers, net ARR only increased by $800K. Where did the other $1.2M go?
It churned. Your existing customers canceled, downgraded, or didn't renew at the rate you expected. And unless you understand why customers leave, how to measure that loss, and what's actually preventable versus inevitable, you'll keep running on this treadmill - constantly selling to replace lost revenue instead of building on a stable foundation.
Customer churn isn't a failure. It's a reality of every subscription business. Some customers will always leave. The question is whether you're losing 5% annually or 30%, whether you're losing your best customers or your worst fits, and whether you're learning from every loss to prevent the next one.
Defining Churn: What We're Actually Measuring
Churn sounds simple - customers who leave. But mix up the different types and you'll end up with confused analysis and wrong decisions.
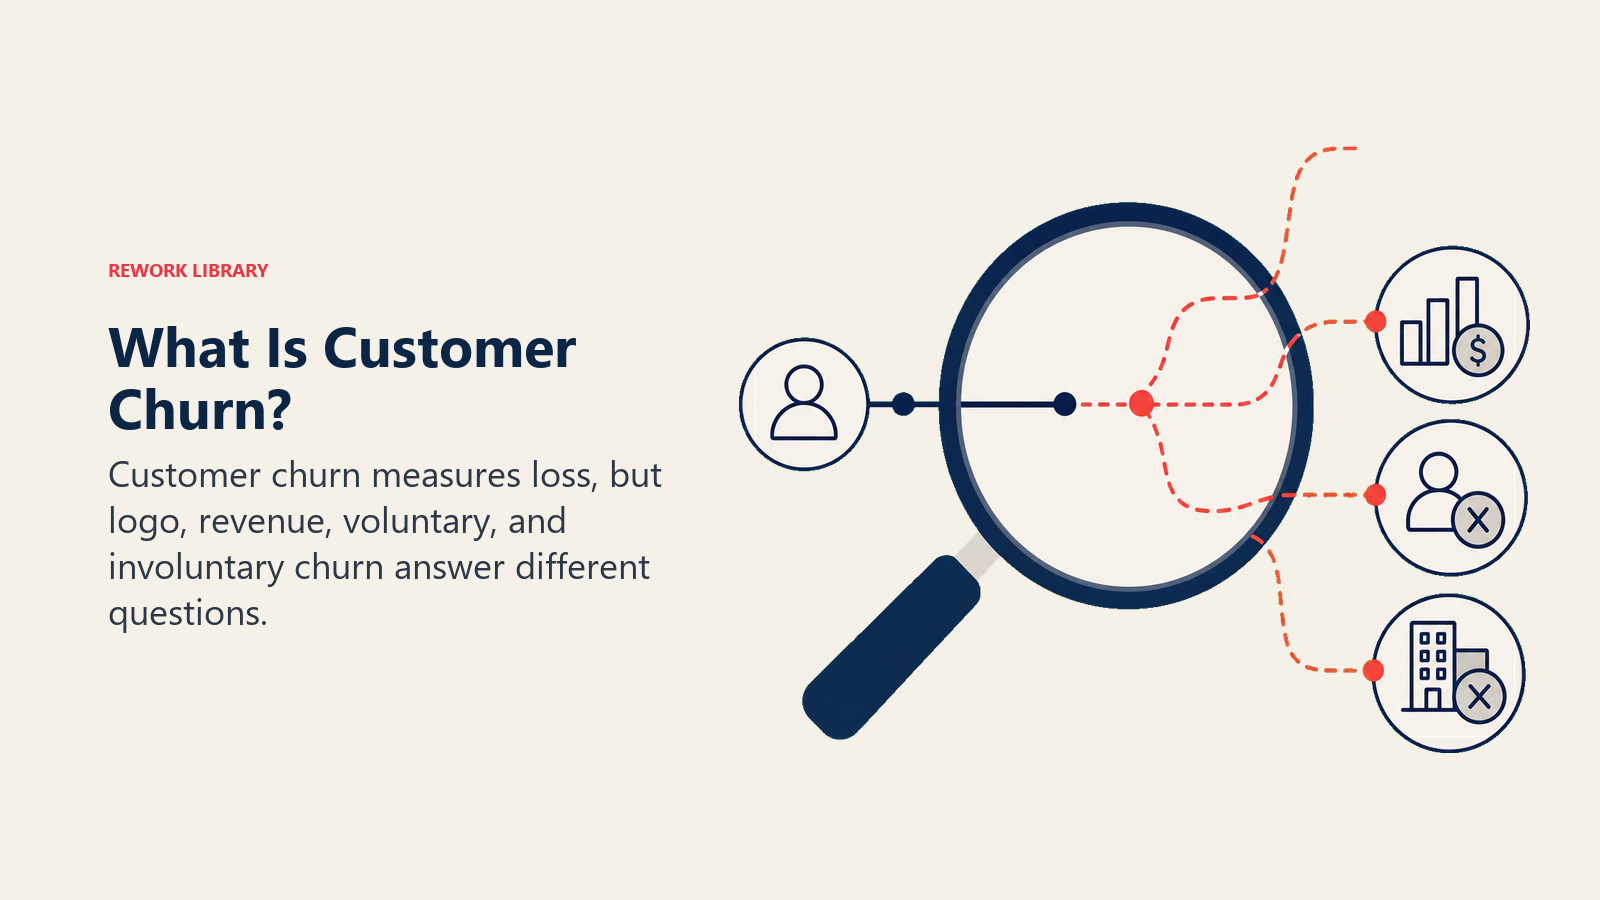
Customer churn (also called logo churn) counts how many customers cancel or don't renew. Start the month with 100 customers and end with 95? Your monthly customer churn is 5%.
This is the most common churn metric, especially for companies with relatively similar customer sizes. Problem is, it treats your $5K customer and your $500K customer identically. You can have great logo churn rates while bleeding revenue.
Revenue churn (also called dollar churn or MRR/ARR churn) measures the actual revenue lost. Start the month with $100K MRR and lose customers representing $8K? Your monthly revenue churn is 8%.
This matters more than logo churn for companies with diverse customer sizes. Losing one $100K customer is not the same as losing ten $1K customers, even though both scenarios represent "10% logo churn" if you have 100 total customers.
Gross churn measures total losses without accounting for expansion. Lost $20K in MRR from churned customers? Gross churn is $20K (or 20% if you started with $100K).
Net revenue retention (NRR) or net churn factors in expansion revenue from existing customers. Lost $20K from churn but gained $30K from expansions? Your net retention is 110% - you actually grew your base even with churn.
SaaS companies obsess over NRR because it shows whether your customer base is a growth engine or a leaky bucket. NRR above 100% means you can grow without any new customers. Below 100% means you're fighting an uphill battle.
Voluntary churn happens when customers actively choose to leave. They cancel, don't renew, or explicitly tell you they're switching to a competitor. This is the churn that stings because it represents a failure to deliver value.
Involuntary churn occurs when customers leave for reasons beyond their control - credit card expiration, failed payments, company went out of business, billing errors. Stripe estimates involuntary churn represents 20-40% of total churn for most SaaS companies.
This distinction matters because prevention strategies differ completely. Voluntary churn requires product improvement and value demonstration. Involuntary churn needs better payment recovery systems.
Good churn is a real thing. Sometimes customers leave who you're actually better off without - accounts that were never the right fit, abusive customers consuming disproportionate support, tiny accounts costing more to serve than they pay, customers using your product for purposes it wasn't designed for.
Optimizing for zero churn means keeping bad-fit customers who prevent you from serving good-fit customers well. Sometimes churn improves your business.
Bad churn is preventable loss of customers you should have kept. These are good-fit customers whose problems you could have solved, whose objections you could have addressed, whose needs you could have met. This is the churn that represents real failure.
The Economics of Churn: Why It Destroys Value
Churn isn't just a retention problem. It's an economics problem that can make otherwise good businesses unsustainable.
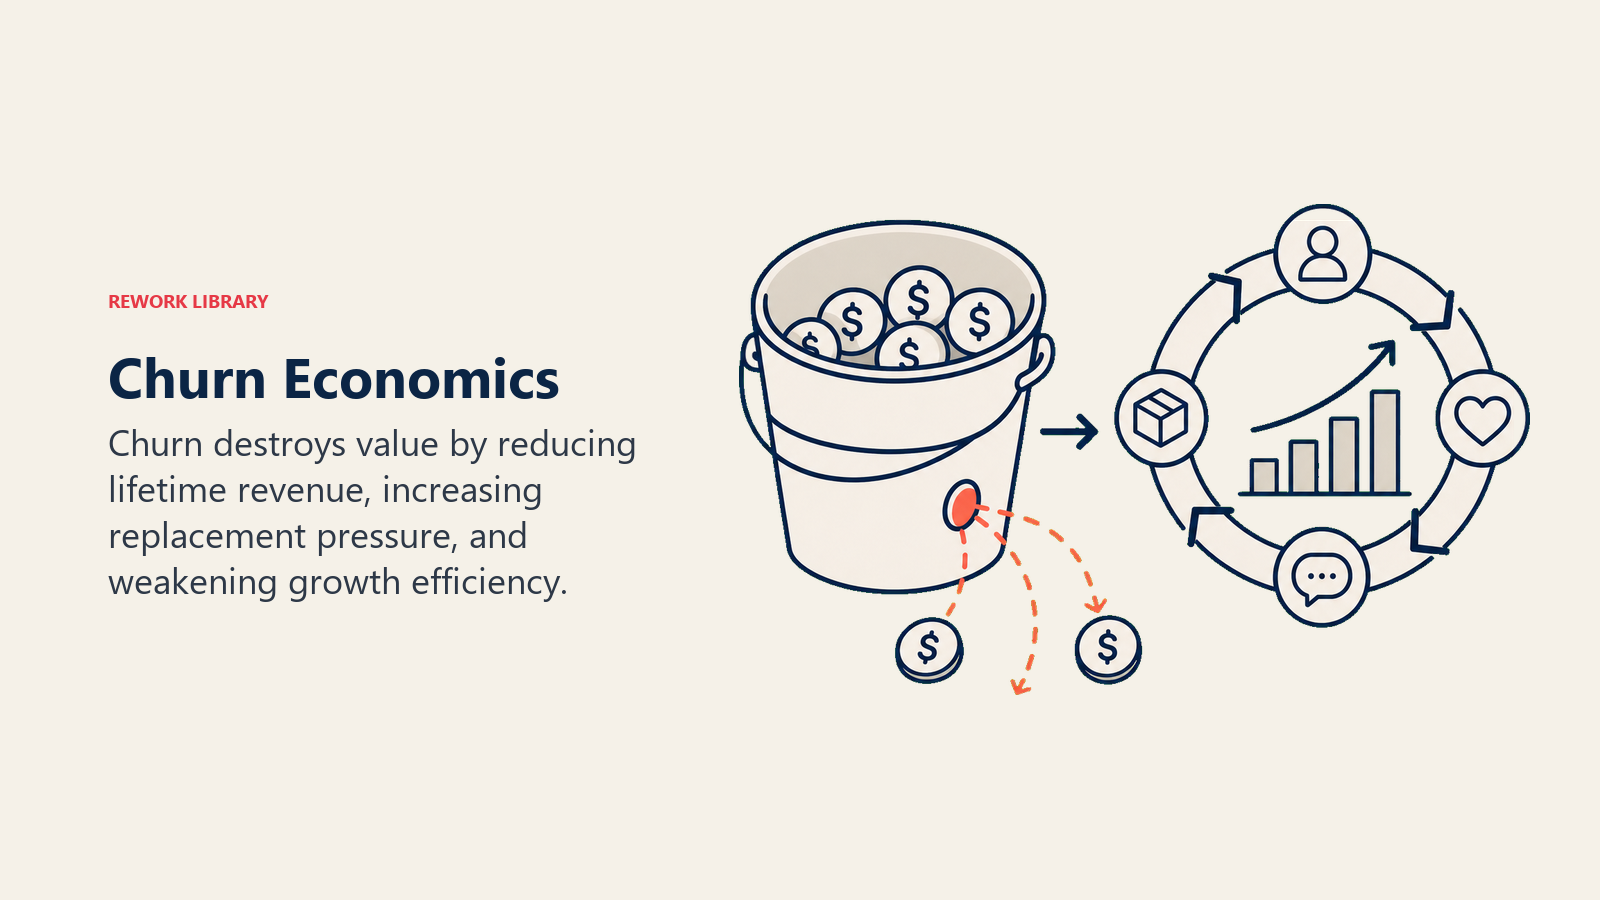
Every churned dollar must be replaced by new revenue just to stand still. Churning 20% annually? You need to grow new sales by 20% just to maintain current ARR. All your growth comes from exceeding that replacement threshold.
Companies with 5% annual churn can grow with modest new sales. Companies with 40% churn need massive sales growth just to avoid shrinking. Your churn rate effectively taxes your growth rate.
Customer acquisition cost (CAC) makes this worse. If it costs you $15K to acquire a customer who pays $10K annually and churns in year one, you've destroyed value. You're literally paying more to acquire customers than they'll ever pay you.
The common formula is that LTV (lifetime value) should be at least 3x CAC. If your LTV is $30K (3 years at $10K/year), you can afford $10K in acquisition costs. But if customers churn after one year, your LTV drops to $10K and the unit economics break.
Churn directly determines how much you can spend to acquire customers and still be profitable.
When customers who should have stayed for 5+ years churn in year two, you're losing massive lifetime value. A customer paying $50K annually over five years represents $250K in revenue (ignoring expansion). Losing them in year two costs you $150K in unrealized revenue.
Multiply that across dozens or hundreds of churned accounts and you're talking about millions in destroyed enterprise value.
Company valuation impact is direct and brutal. SaaS companies are typically valued on revenue multiples. Higher churn rates correlate with lower multiples because investors know churny businesses are risky.
A company with 5% annual churn might trade at 10x ARR. The same company with 30% churn might trade at 3x ARR. The difference in a $10M ARR company is $70M in valuation - literally tens of millions in value destroyed by high churn.
Investors treat churn as a fundamental business quality signal. Low churn indicates product-market fit, strong value delivery, and sustainable growth. High churn suggests fundamental problems that more sales won't fix.
This is why investors scrutinize cohort retention curves, NRR, and logo retention rates so carefully. They're trying to determine if you've built something customers want to keep or if you're just good at selling something they'll soon cancel.
Churn Patterns: When and Why Customers Leave
Churn isn't random. It follows predictable patterns that reveal underlying problems.
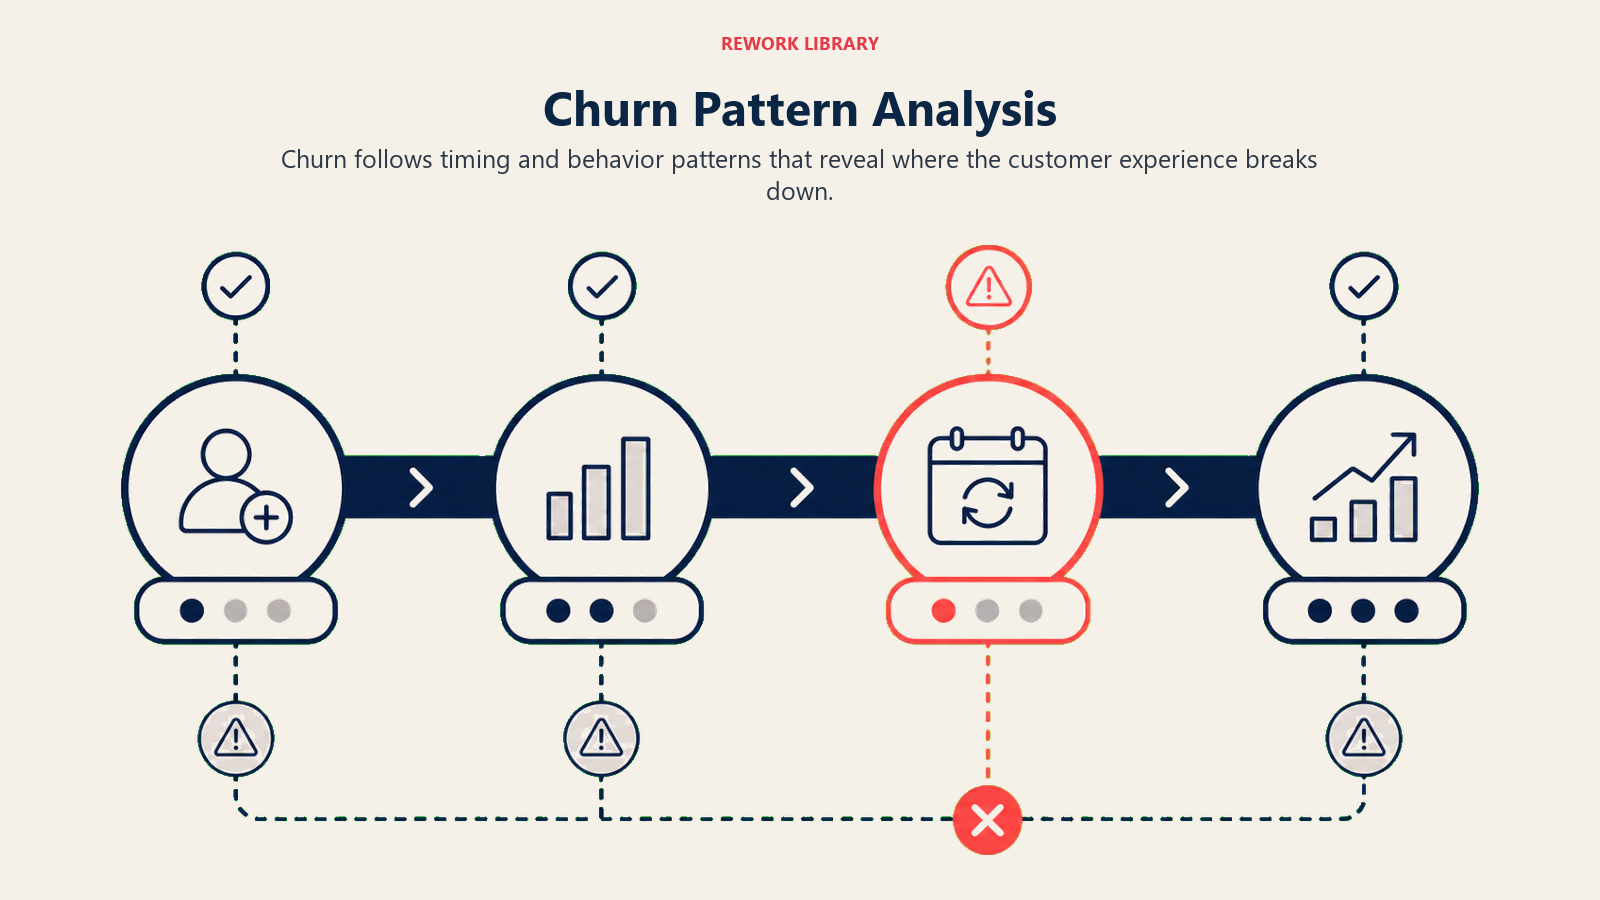
Early churn (within first 90 days) usually signals onboarding failure. Customers didn't achieve quick wins, didn't understand the product, or realized it wasn't what they expected. If 30% of customers churn in month one, your onboarding is broken.
Intercom found that users who don't reach a specific activation milestone within 14 days churn at 4x the rate of those who do. The problem isn't the product's long-term value. It's that customers never get far enough to see it.
Watch for anniversary churn - spikes at renewal dates (annual contracts) or around 12/24 month marks (monthly contracts). Customers use renewal as a forcing function to evaluate whether they're still getting value.
Seeing churn cluster at 12 months? Your first-year experience isn't cementing value strongly enough for customers to renew. You're getting them to buy but not to stay.
Economic cycle churn follows budget cycles and macroeconomic conditions. SaaS companies saw churn spike in 2020 (pandemic uncertainty) and 2022-23 (recession fears) as customers cut costs. This churn is partly external but often reveals customers who weren't deeply embedded enough to be protected.
Champion departure churn happens when your internal advocate leaves the company and their replacement doesn't understand or value your product. If your relationship is single-threaded to one person, you're vulnerable.
Companies that multi-thread relationships across multiple stakeholders are far more resistant to champion departure churn.
Some industries have seasonal patterns. Education software might churn at end of school year. Tax software churns after tax season. B2C subscriptions churn after holiday gifting periods end.
Understanding your seasonal patterns helps you staff appropriately and intervene proactively.
Not all customer types churn equally. Segment differences look something like this:
- Enterprise customers: 7-10% annual churn
- Mid-market: 15-20% annual churn
- SMB: 30-50% annual churn
Small businesses fail more often, have less stable budgets, and change needs more rapidly. Enterprise customers are stickier but more costly to acquire and serve. Your acceptable churn rate depends on which segment you serve.
Cohort degradation curves show how each customer cohort's retention changes over time. A healthy SaaS business has cohort curves that flatten after 12-18 months, meaning year two churn is much lower than year one.
Spotify's cohort curves show this clearly - most churn happens in first 90 days, then retention stabilizes. If your cohorts keep churning at 20%+ annually even in years 3-5, you have a persistent value delivery problem.
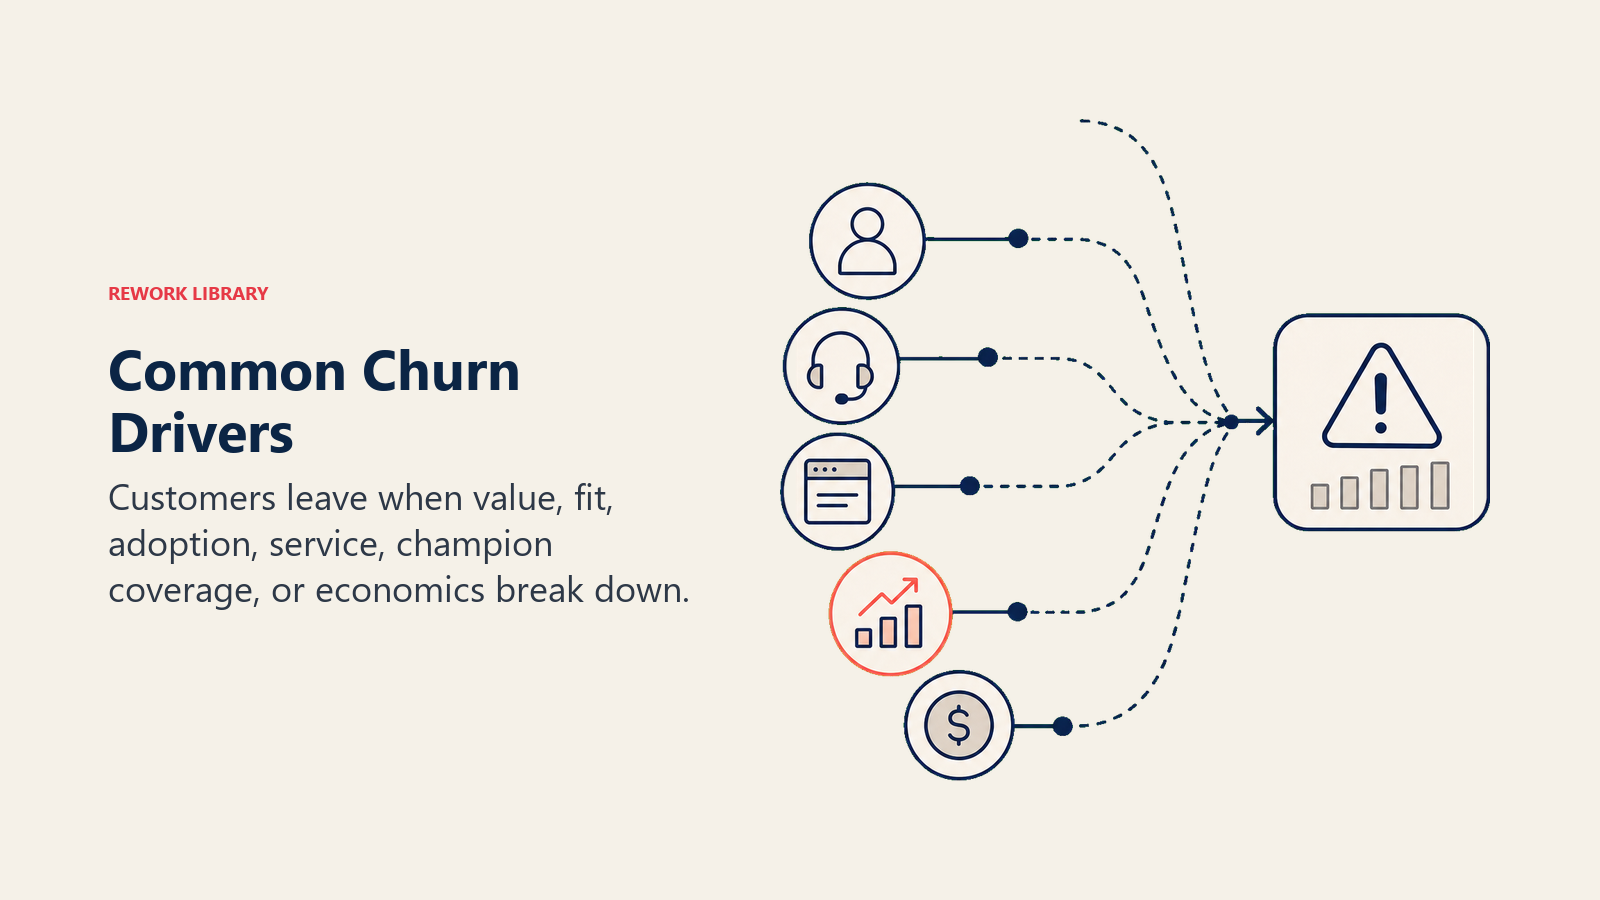
Common Churn Drivers: Why Customers Actually Leave
Lack of value realization is the #1 reason customers leave. They bought based on expected value but didn't achieve it. Maybe they couldn't figure out how to use the product, didn't have time to implement it properly, or their actual use case didn't match what you sold them.
This manifests as "not using it enough" or "didn't get the ROI" in exit interviews.
Product gaps or bugs make your product unusable for certain use cases. The customer needs feature X and you don't have it. Or feature Y is so buggy it's more frustrating than helpful.
When customers say "missing features" or "product couldn't do what we needed," this is often preventable through better product roadmap alignment with customer needs.
Poor service or support creates friction that accumulates until customers decide it's not worth it. Slow support responses, unhelpful CSMs, feeling ignored or deprioritized - these relationship failures often matter more than product gaps.
"We felt like we weren't important to them" is a common churn reason that has nothing to do with product quality.
Budget constraints or cost concerns mean the customer can't afford your product or doesn't think it's worth the price. Economic churn is real, especially in downturns. But "too expensive" often means "not valuable enough to justify the cost."
If customers are consistently churning over price, your pricing might be wrong or your value communication is failing.
Competitive displacement happens when a competitor offers something better, cheaper, or more aligned with the customer's needs. You can't prevent all competitive churn - sometimes competitors are genuinely better for certain use cases.
But if you're consistently losing to the same competitor, you have a strategic positioning problem.
Business changes include the customer's company being acquired, pivoting strategy, shutting down, or fundamentally changing direction. A customer using your marketing automation tool who pivots from B2C to enterprise B2B might not need your product anymore.
This churn is largely unpreventable but still informative about your product's flexibility and breadth.
Champion departure without relationship depth means when your internal advocate leaves, no one else values your product enough to keep it. The replacement asks "why are we paying for this?" and no one can answer convincingly.
Multi-threading relationships across multiple stakeholders prevents this. If three people champion your product, one leaving doesn't kill the account.
Acceptable Churn Rates: Setting Realistic Benchmarks
Not all churn rates are created equal. What's acceptable depends on your business model and customer segment.
For enterprise SaaS, you should be seeing:
- Excellent performance: Less than 5% annual logo churn, 95%+ NRR
- Good performance: 5-10% annual logo churn, 90-95% NRR
- Concerning: 10-15% annual churn, 85-90% NRR
- Crisis mode: More than 15% annual churn, below 85% NRR
Enterprise customers should be sticky. They have complex implementations, multiple stakeholders, and switching costs. If you're churning 20% of enterprise customers annually, something is fundamentally broken.
Mid-market looks different:
- Excellent: Less than 15% annual churn, 100%+ NRR
- Good: 15-25% annual churn, 90-100% NRR
- Concerning: 25-35% annual churn, 80-90% NRR
- Crisis: More than 35% annual churn, below 80% NRR
Mid-market has more churn than enterprise but less than SMB. Expect some customer failure and budget sensitivity but still strong retention.
SMB benchmarks are higher:
- Excellent: Less than 30% annual churn, 90%+ NRR
- Good: 30-50% annual churn, 80-90% NRR
- Concerning: 50-70% annual churn, 70-80% NRR
- Crisis: More than 70% annual churn, below 70% NRR
Small businesses fail more often, have tighter budgets, and switch more readily. 40% annual SMB churn can be fine if your CAC is low and you're growing. But 70% churn means you're in a constant replacement cycle.
Contract length matters. Monthly vs annual contracts shift these numbers significantly:
- Monthly churn of 3% equals 31% annual churn
- Monthly churn of 5% equals 46% annual churn
- Monthly churn of 7% equals 58% annual churn
If you're on monthly contracts, monthly churn below 3% is excellent. Above 7% is crisis territory.
Consumer subscription benchmarks are different entirely:
- Streaming: 30-40% annual churn (Netflix, Spotify)
- Meal kits: 60-70% annual churn
- Fitness apps: 50-60% annual churn
Consumer subscriptions fight constant churn through content refreshment, personalization, and low friction reactivation. B2B SaaS has different economics.
Here's what matters as much as absolute rates: improving over time. At 25% annual churn today but consistently improving 5% year-over-year? You're building toward sustainability. Stuck at 40% for three years? You have persistent problems.
Churn Management Philosophy: Principles for Reduction
Reducing churn requires a systematic approach, not reactive firefighting.
Prevention beats cure every time. Build products, onboarding experiences, and engagement models that prevent churn before it happens. Trying to "save" customers at renewal time is far less effective than ensuring they never reach at-risk status.
Companies that reduce churn by 50% rarely do it through better save tactics. They do it through better onboarding, proactive engagement, and continuous value delivery. This is where retention fundamentals and disciplined at-risk customer management do the heavy lifting, long before a renewal date arrives.
Look for systemic patterns, not individual explanations. Yes, every churned customer has a specific reason. But if 30% are churning due to "lack of adoption," you have a systemic onboarding or product complexity problem, not 50 individual customer failures.
Fix the system. Don't just save one account at a time.
A data-driven approach requires actually tracking and analyzing churn. Don't know your churn rate by segment, by cohort, by reason, by CSM, by product plan? You're flying blind. You can't improve what you don't measure.
Gainsight, ChurnZero, and other CS platforms exist because churn data is so critical. If you're still tracking churn in spreadsheets, you're probably under-analyzing it.
Cross-functional ownership acknowledges that churn isn't just a CS problem. Product gaps cause churn. Sales over-promising causes churn. Poor pricing causes churn. Marketing attracting wrong-fit customers causes churn.
Churn reduction requires product, sales, marketing, and CS alignment. Siloing it as "the CS team's churn problem" guarantees failure.
Treat every churned customer as a learning opportunity. Exit interviews aren't about saving the customer (though sometimes you can). They're about understanding root causes to prevent future churn.
Companies that systematically learn from churn improve faster than those that just try to reduce it without understanding it.
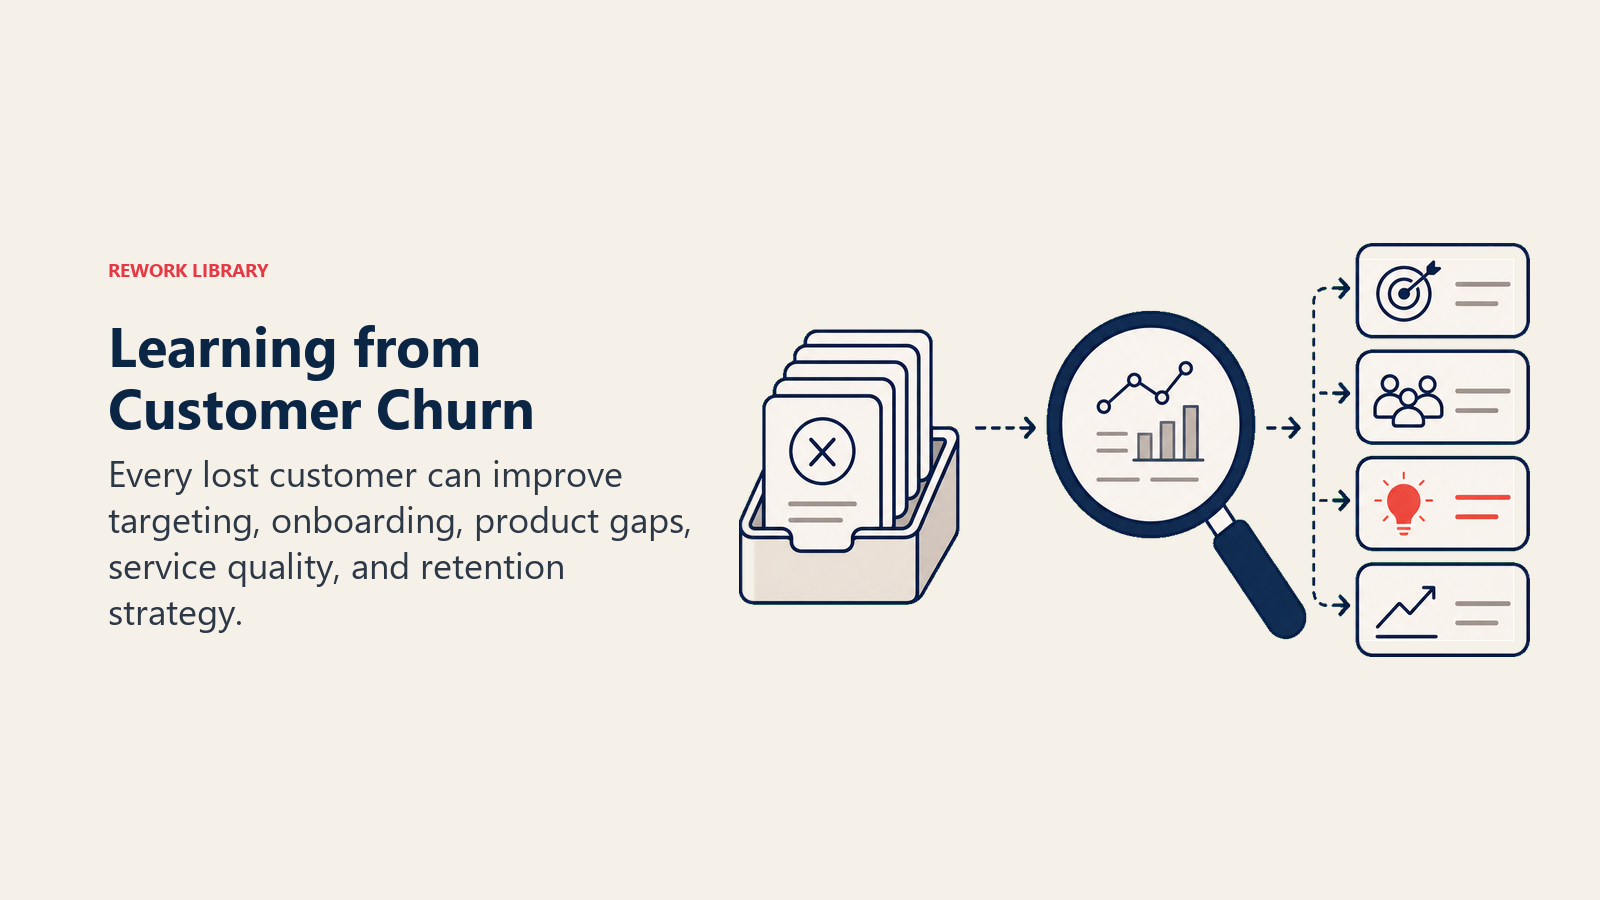
Learning from Churn: Turning Loss into Insight
Every churned customer is a data point that can improve your business.
Exit interviews or surveys capture why customers leave in their own words. Don't settle for dropdown reasons. Have actual conversations with churned customers when possible.
Ask:
- "What outcome were you hoping to achieve when you bought our product?"
- "Did you achieve it? If not, what prevented it?"
- "What would have needed to be different for you to renew?"
- "What are you doing instead now that you've canceled?"
The answers reveal product gaps, onboarding failures, pricing misalignments, and competitive threats.
Win-back analysis identifies which churned customers are worth re-engaging and which aren't. Some customers leave for temporary reasons (budget cuts, champion departure) and might return when circumstances change. Others were never good fits.
Segment churned customers by win-back potential and create targeted campaigns. HubSpot wins back 15-20% of churned customers with targeted win-back campaigns offering new features or pricing that address churn reasons.
Product feedback loops send churn insights to product teams. If 40% of churned customers cite "missing integration with Salesforce," that's a clear product roadmap signal. Don't let that feedback die in CS team notes.
Atlassian has formal processes where CS teams submit "churn-driven feature requests" that get prioritized in product planning.
Process improvement identifies broken internal processes. Customers consistently churn because they couldn't figure out implementation? Your onboarding process needs redesign. They churn because support was unresponsive? Your support structure needs fixing.
Churn analysis should trigger operational changes, not just individual account saves.
Look for patterns across cohorts:
- Customers who onboard in Q4 churn 30% more than Q1 cohorts (perhaps year-end rush means poor onboarding quality?)
- Customers from certain sales reps churn 2x industry average (over-promising during sales?)
- Customers using feature X but not feature Y churn 50% more (product design issue?)
These patterns point to specific, addressable problems.
Frequently Asked Questions
What is customer churn in business management? Churn is the rate at which customers stop paying for or using a product or service over a given period. Businesses track it as logo churn (number of customers lost) and revenue churn (dollars lost), because losing one large account is very different from losing several small ones.
What is a good churn rate? It depends on segment. Enterprise SaaS should see under 5% annual logo churn, mid-market under 15%, and SMB under 30%. Consumer subscriptions run much higher. What matters most is whether your rate is improving year over year, not just the absolute number.
What is the difference between voluntary and involuntary churn? Voluntary churn happens when customers actively choose to leave. Involuntary churn comes from failed payments, expired cards, or billing errors, and accounts for 20 to 40% of total churn for most SaaS businesses. Each needs a different fix: value delivery versus better payment recovery.
How can businesses reduce churn? Prevention beats cure. Strong onboarding, proactive engagement, and continuous value delivery prevent churn far more effectively than last-minute save tactics. Treat churn as a cross-functional issue across product, sales, marketing, and customer success, and learn from every loss through exit interviews.
Ready to reduce churn systematically? Learn how to analyze churn root causes, build churn prediction models, implement save strategies, and develop retention fundamentals that prevent churn before it happens.
Related resources:

Senior Operations & Growth Strategist
On this page
- Defining Churn: What We're Actually Measuring
- The Economics of Churn: Why It Destroys Value
- Churn Patterns: When and Why Customers Leave
- Common Churn Drivers: Why Customers Actually Leave
- Acceptable Churn Rates: Setting Realistic Benchmarks
- Churn Management Philosophy: Principles for Reduction
- Learning from Churn: Turning Loss into Insight
- Frequently Asked Questions