Best AI Infographic Tools in 2026: 12 Options Compared on Data Accuracy, Brand Kits and Cost
Turn this article into takeaways for your work.


Each assistant summarizes the article only for you and suggests best practices for your work.
The best AI infographic tool depends on one question: does the tool draw your numbers, or does it paint a picture of numbers? Napkin AI is the fastest way to turn pasted text into an editable visual. Piktochart, Venngage and Visme are the safer choices when a chart must show real data and match a brand. Canva is the default when a whole team already lives in it. And image models such as ChatGPT, Adobe Firefly, Ideogram and Recraft are best for the decorative side of an infographic, not the figures.
This guide covers 12 tools in four lanes: text-to-diagram, template-first with AI, presentation-first, and general image models. Each gets a real limitation, a commercial-use note and a price. The pricing section works through one workload: a three-person marketing team producing 20 infographics a month. If you want the wider field of design products, the best AI graphic design tools covers editors, logo tools and generators, and this page stays on infographics and data visuals.
Why Infographics Are a Different AI Problem
A poster, a social tile and a logo can be a little wrong and still work. An infographic cannot. Its job is to carry a number, a ranking or a process, and one bar drawn at the wrong height turns a persuasive asset into a liability that your sales team will quote to a prospect.
That is not a hypothetical risk. In a 2026 study presented at the AVI conference, researchers Mandy Keck and Andreas Stöckl analysed 100 infographics generated with Google's Nano Banana Pro across 20 topic categories and found that 99 of the 100 contained at least one misleading element, per their paper listing at FH Oberösterreich. A separate benchmark, IGenBench on arXiv, tested 10 text-to-image models on 600 cases across 30 infographic types. Its top model reached 0.90 accuracy on individual yes/no checks but only 0.49 when a whole infographic had to be right, and the authors name data-related dimensions as the universal bottleneck.
So the practical question is never "which tool makes the prettiest infographic." It is "where do my numbers go, and who checks them?"
Key Facts
- 99 of 100 infographics generated by a leading image model contained at least one misleading element (fabricated data, inconsistent encodings or misleading framing), per Keck and Stöckl, AVI 2026.
- The best of 10 text-to-image models scored 0.90 on question-level checks but 0.49 on whole-infographic correctness, and Data Completeness scored just 0.21, per the IGenBench paper.
- Napkin AI's free plan allows unlimited PNG and PDF export, while PPT and SVG export require a paid plan, per napkin.ai.
- Kittl's free plan is for personal use only, with no commercial rights, per Kittl's pricing FAQ.
- Recraft's free plan carries no commercial use and the images are owned by Recraft, while paid plans get full ownership, per recraft.ai/pricing.
Quick Comparison Table
| Tool | Lane | Best For | Starting Price | Key Limitation |
|---|---|---|---|---|
| Napkin AI | Text-to-diagram | Turning pasted text into editable visuals fast | Free; Plus $9/person/mo | Not a data-chart studio; SVG and PPT export are paid |
| Piktochart | Template + AI | Report-style infographics with live charts | Pro $10/member/mo | Free plan allows only 2 PNG downloads |
| Venngage | Template + AI | Marketing teams that need brand-ready layouts | Premium $10/mo | Free plan is limited to 5 designs, public sharing only |
| Visme | Template + AI | Data widgets, interactive and branded content | Starter $147/yr per person | Small AI allowance on entry tiers |
| Canva | Template + AI | Teams already standardised on Canva | Pro $144/yr; Business $250/yr per person | AI use is capped by tier |
| Gamma | Presentation-first | Long-scroll "pages" and decks with AI layout | Plus $9/seat/mo | Credit-metered; not a chart tool |
| Beautiful.ai | Presentation-first | Smart slides that stay on-brand | Pro $14.50/mo | No free plan, trial only |
| Kittl | Template + AI | Typographic, poster-style graphics | Pro $14/mo | Free plan has no commercial rights |
| ChatGPT image | Image model | Decorative art and concept illustrations | Plus $20/mo | Paints numbers as pixels |
| Adobe Firefly | Image model | Commercially safe illustration assets | Pro $19.99/mo | Credits reset monthly, no rollover |
| Ideogram | Image model | Posters with legible text | Plus $15/mo | Output is a flat image, not an editable chart |
| Recraft | Image model | Vector-style icons and illustrations | Basic $10/mo | Free output is public and non-commercial |
Two Ways AI Makes an Infographic
Before the tool-by-tool sections, it helps to separate the two architectures, because they fail in opposite ways.
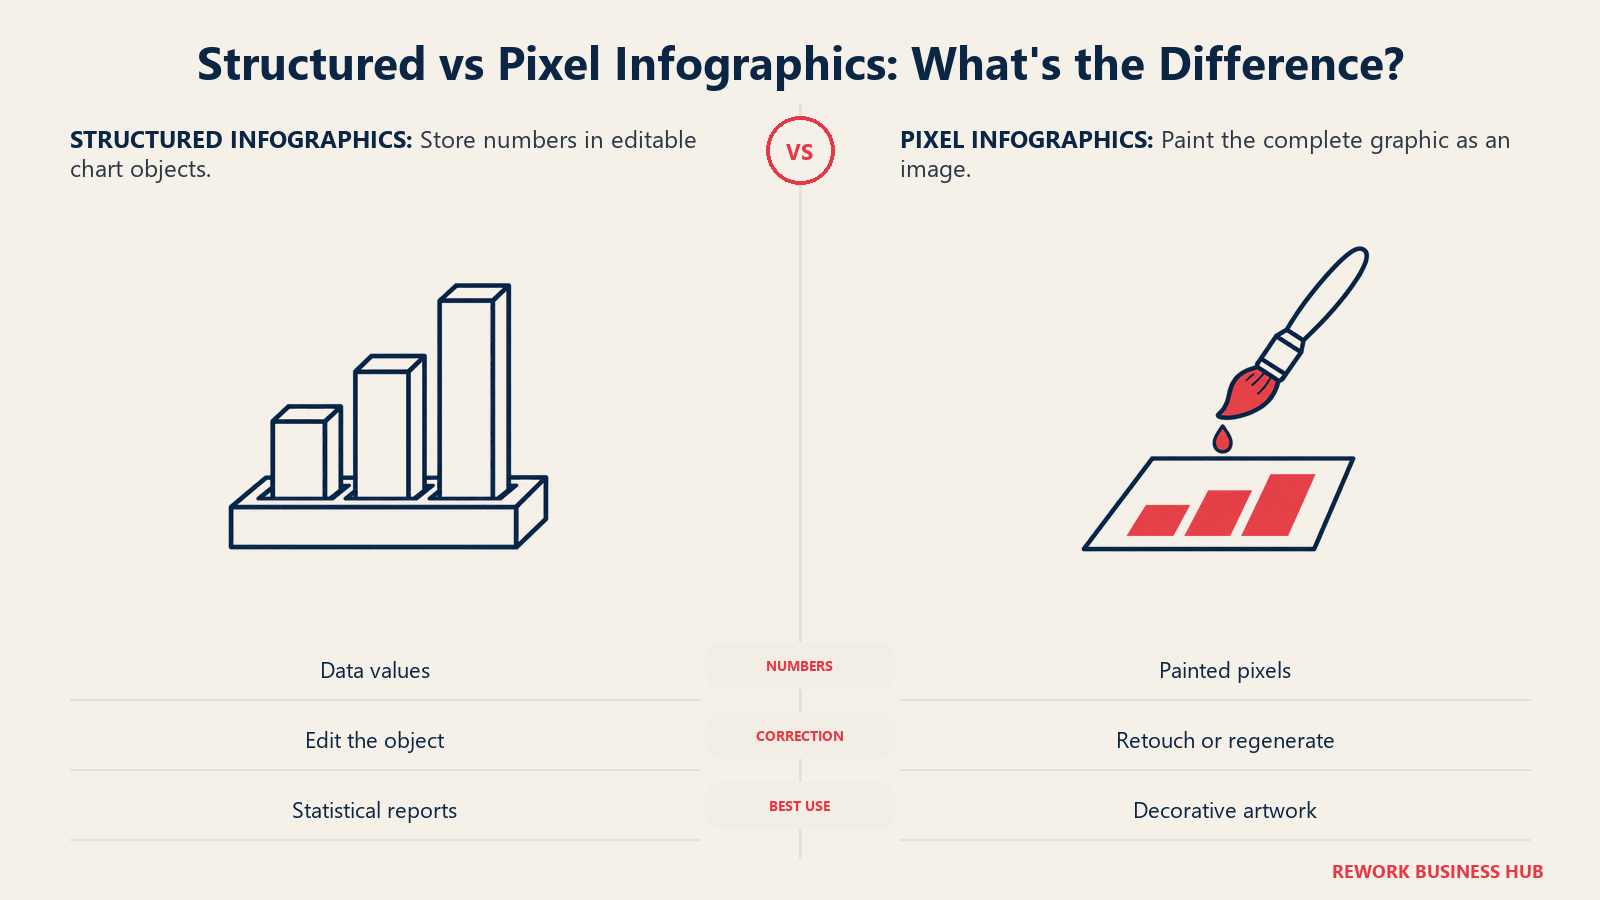
Structured generation. The tool reads your text or data, decides on a layout, and builds objects: shapes, text boxes, chart elements. Napkin, Piktochart, Venngage, Visme, Canva, Gamma and Beautiful.ai all work like this, to varying degrees. The result is editable, and a chart built from a data table keeps its numbers as data.
Pixel generation. The tool paints the whole image in one pass. ChatGPT's image generation, Firefly, Ideogram and Recraft work this way. They can render a striking layout in seconds, but a bar is just coloured pixels. Nothing checks whether it is 40% or 60% tall.
| Question | Structured generation | Pixel generation |
|---|---|---|
| Are numbers stored as data? | Usually yes, in chart or table objects | No |
| Can you fix a typo or a value? | Yes, in place | Regenerate or retouch |
| Does it match your brand colours? | Via brand kit | Via prompt, loosely |
| Failure mode | Generic, template-looking layouts | Confident, wrong numbers |
| Typical export | PNG, PDF, sometimes SVG or PPT | PNG or JPG |
For anything that carries a statistic, use structured generation and type the numbers in yourself. Use pixel generation for the hero illustration around it. The best AI image generators page ranks the pixel side if that is the part you need.
Lane 1: Text-to-Diagram
1. Napkin AI: Paste Text, Get a Visual
Napkin AI turns pasted or imported text into flowcharts, mind maps, infographics, diagrams and data charts, and it also has a slides mode that builds decks from your ideas. You paste a paragraph, pick from generated layouts, and edit. Every element is editable: colours, fonts, layouts, icons, and individual shapes can be reshaped or swapped, per napkin.ai.
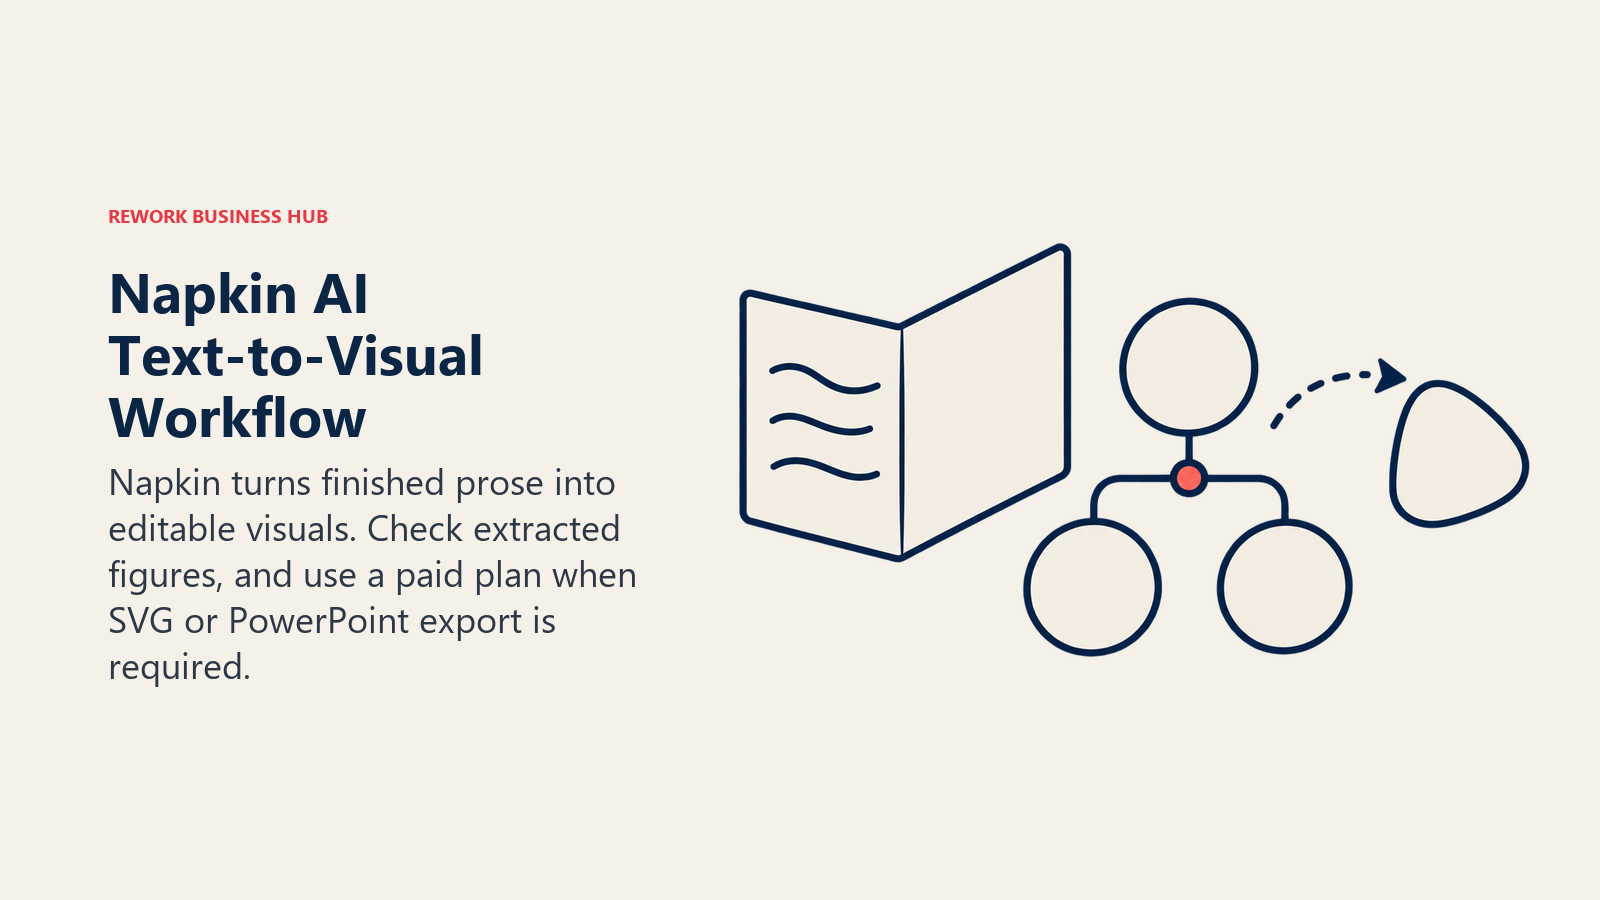
Best for: a marketer or founder who has a finished piece of writing and needs a visual summary in minutes, including process explainers and concept maps. It is the most direct answer to "text to infographic."
Limitations: it visualises concepts well and numeric charts less so, and there are no built-in integrations, so you export and import into PowerPoint, Google Slides, Keynote or Notion. Free export covers PNG and PDF without limit, but PPT and SVG need a paid plan. Check any figure it pulls from your text, since it works from the language you give it.
| Strengths | Weaknesses |
|---|---|
| Fast text-to-visual conversion | Not a dedicated data-chart builder |
| Every element is editable | No built-in integrations |
| Free plan with PNG and PDF export | SVG and PPT export are paid |
| Shared Teamspace, co-editing and comments | Custom branding is a paid feature |
Pricing: Free: 500 AI credits per week, Napkin branding, PNG and PDF export. Plus: $12 monthly or $9 per person/month billed yearly, 10,000 credits a month, removes branding. Pro: $30 monthly or $22 per person/month billed yearly, 30,000 credits. Enterprise: contact sales. Roughly one credit per word. Source: napkin.ai/pricing.
Commercial use: confirm output ownership before paid work. Read Napkin's terms of service before using visuals in paid client work.
Lane 2: Template-First Tools With AI
These tools start from a layout library and use AI to fill, restyle or draft. They are the safest lane for numbers, because charts are objects fed by a data table.
2. Piktochart: Report-Style Infographics
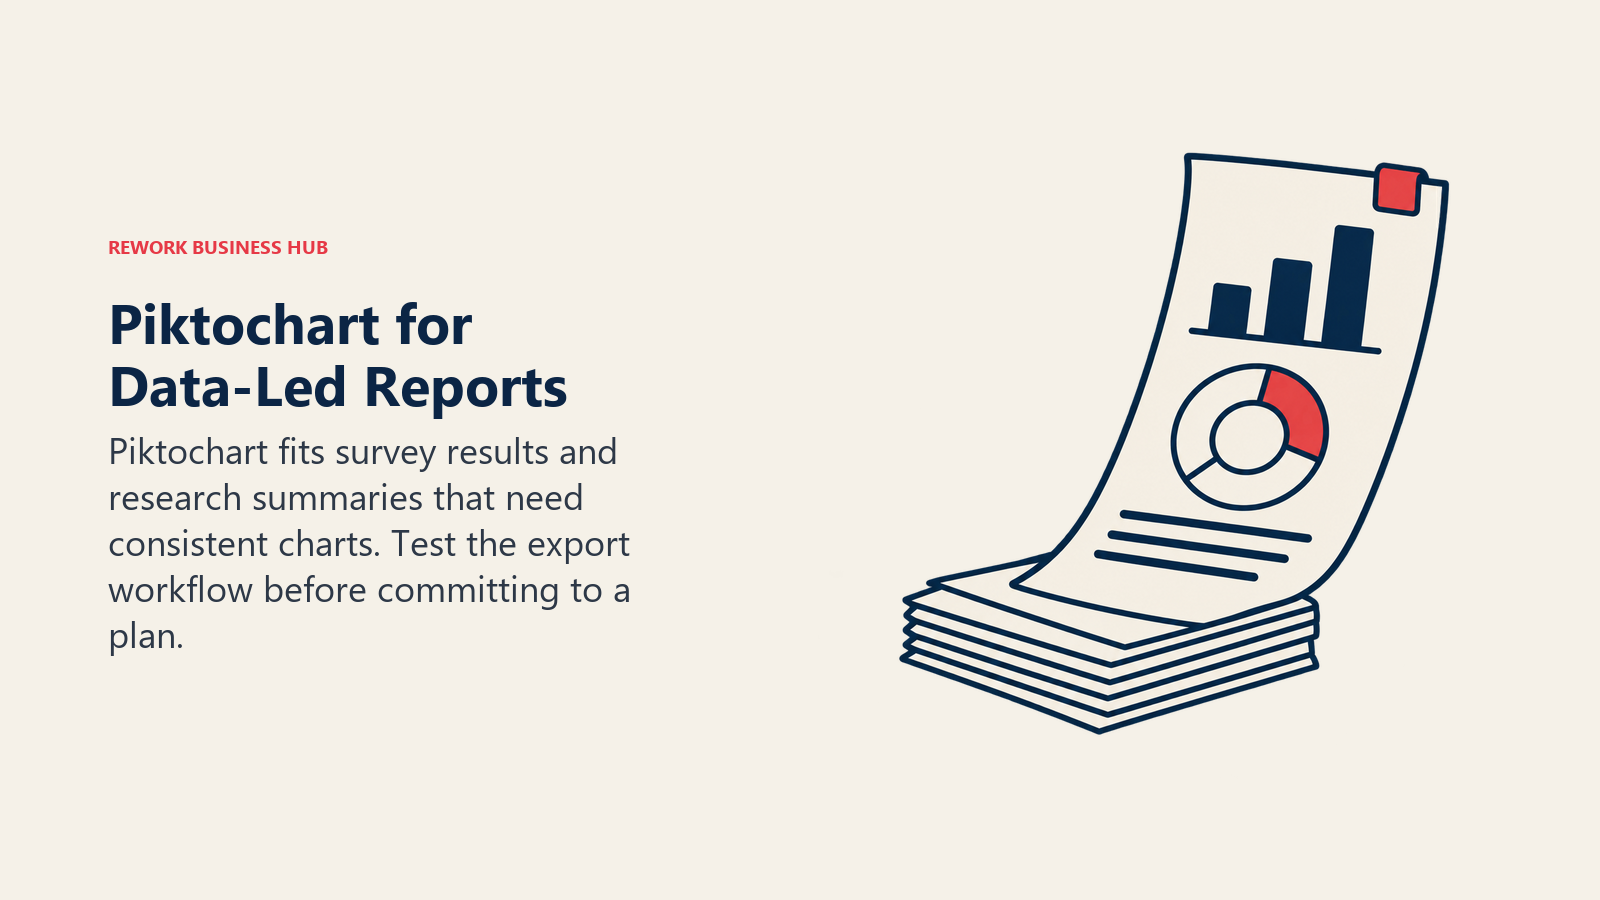
Piktochart is a long-standing infographic maker with AI assistance for drafting content and layout. Its sweet spot is report and survey-results infographics, where a dozen stats need a consistent visual treatment.
Already on Piktochart and ready to leave? See the Piktochart alternatives guide.
Best for: teams that turn survey data, annual reports or research summaries into shareable visuals. Limitations: the free plan allows only 2 PNG downloads, so you cannot meaningfully trial an export workflow without paying, and AI credit consumption per action is not published on the pricing page.
| Strengths | Weaknesses |
|---|---|
| Built for report-style infographics | Free plan allows 2 PNG downloads |
| Per-member team pricing | AI credits are pooled and finite |
| Education and nonprofit plans exist | Commercial terms need a separate read |
Pricing: Free: 2 PNG downloads, 60 AI credits, 1 GB. Pro: $15 monthly or $10 per member/month billed annually, 500 AI credits. Business: $20 monthly or $17 per member/month billed annually, 1,000 AI credits. Enterprise: custom, 101+ members. Education $39 per member/year; nonprofit $60 per member/year. Source: piktochart.com/pricing.
Commercial use: confirm in the vendor's terms of service before client work.
3. Venngage: Marketing-Ready Layouts With Daily AI Credits
Venngage pairs a large template catalogue with an AI designer and is aimed squarely at marketing and communications teams. Its credit model is unusual: AI credits are allotted daily rather than monthly, which suits steady production and punishes a one-day burst.
Already on Venngage and ready to leave? See the Venngage alternatives guide.
Best for: content teams that publish infographics weekly and want consistent branded output without a designer. Limitations: the free plan is five designs with public sharing only, and the jump from Premium to Business is large if you only need team features.
| Strengths | Weaknesses |
|---|---|
| Daily AI credits suit steady output | Daily limits cap a one-day burst |
| Large template library | Free plan: 5 designs, public sharing |
| Enterprise tier for 10+ members | Enterprise starts at $499/mo |
Pricing: Free: 5 designs, public sharing only, 80 daily AI credits at signup. Premium: $19 monthly or $10/month billed yearly, 160 daily AI credits. Business: $49 monthly or $24/month billed yearly per user, 1,600 daily AI credits. Enterprise: from $499/month, minimum 10 members. Source: venngage.com/pricing.
Commercial use: confirm in the vendor's terms of service before client work.
4. Visme: Data Widgets and Interactive Output
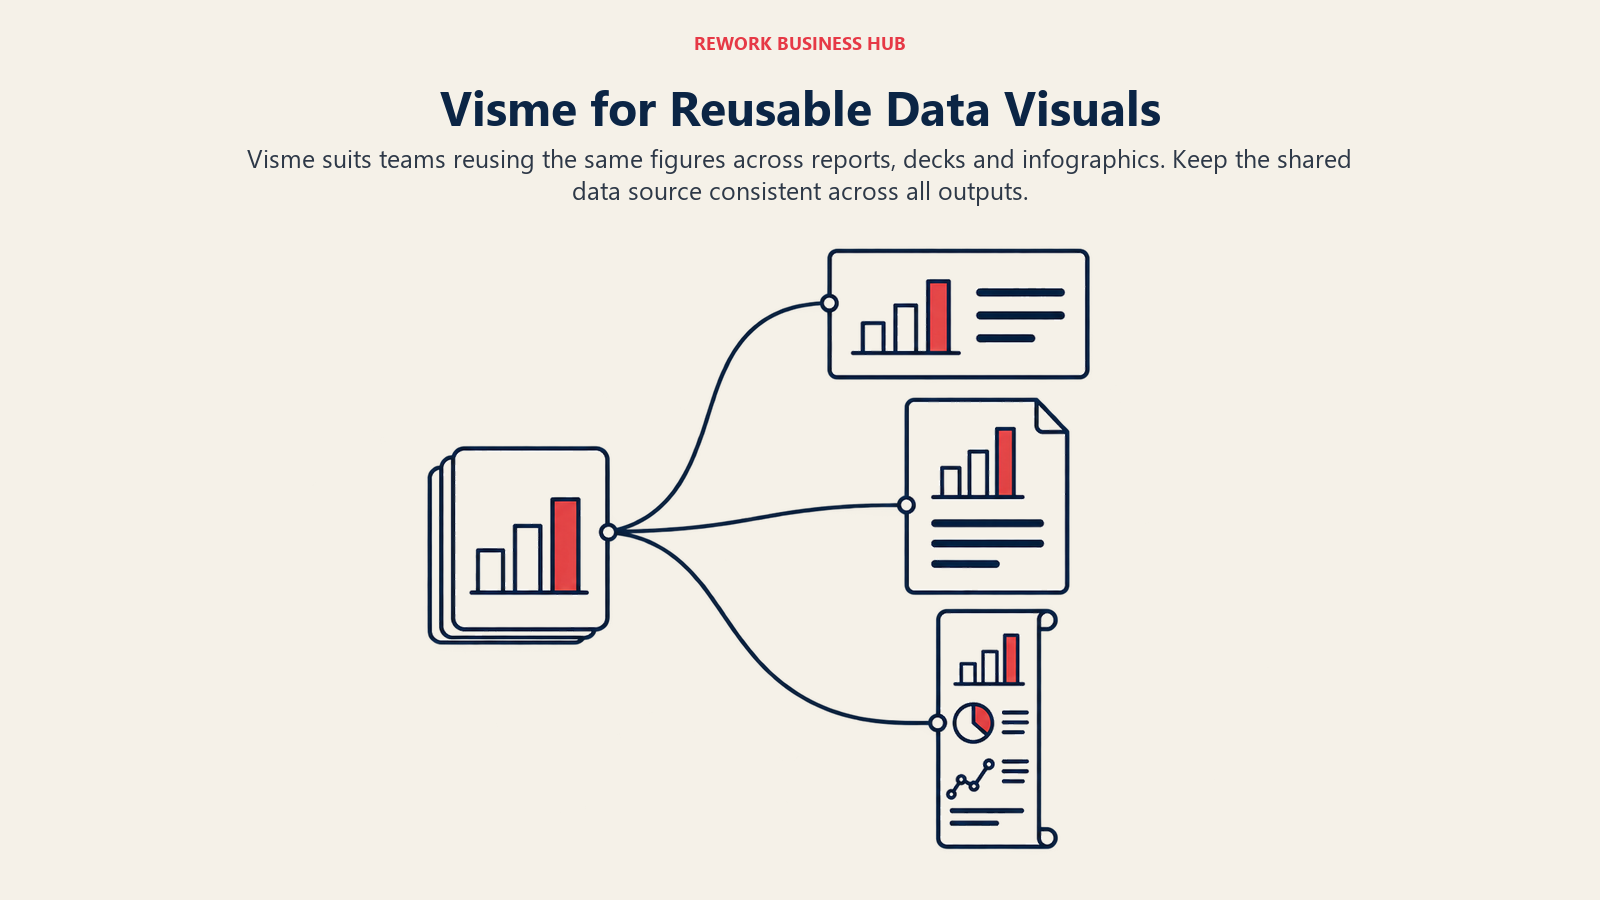
Visme leans furthest toward data. It combines infographic templates with charts, maps and data widgets that can be driven from a spreadsheet, plus presentations and documents under one roof, so a marketing team can reuse a stat across a deck and a one-pager.
Already on Visme and ready to leave? See the Visme alternatives guide.
Best for: teams where the same numbers appear in several formats and need to stay in sync. Limitations: the AI credit allowance is small on lower tiers (10 a month on the free Basic plan, 200 on Starter), and team pricing is stepped, with 6 or more users moving to custom quotes.
| Strengths | Weaknesses |
|---|---|
| Charts and widgets fed by data | Small AI allowance on entry tiers |
| One workspace for decks, docs and infographics | 6+ users need a custom quote |
| Team plans with set seat counts | Commercial terms need a separate read |
Pricing: Basic: free, 10 AI credits a month. Starter: $29 monthly or $147/year per person, 200 AI credits. Business: $59 monthly or $297/year per person, 500 AI credits. Team: 3 users $119/month or $864/year; 5 users $159/month or $1,440/year; 6+ custom. Enterprise: custom, from 10 users, unlimited AI credits. Source: visme.co/pricing.
Commercial use: confirm in the vendor's terms of service before client work.
5. Canva: The Default for Teams Already Inside It
Canva's infographic templates are broad and its Magic tools generate layouts and images inside the same editor your team already uses for social posts and decks. The plan now called Business (formerly Teams) is the team tier. For the full field around it, see the best Canva alternatives.
Best for: a marketing team that wants one editor for everything, with the lowest training overhead. Limitations: Canva charts are decent but its infographic depth is lighter than Piktochart or Visme, and AI use is capped: Free gets up to 20 Standard or Premium AI uses, Pro gets 10x Free, Business 20x Free, with an AI Pass add-on costing extra.
| Strengths | Weaknesses |
|---|---|
| Familiar editor, low training cost | AI usage is capped per tier |
| One tool for social, decks and print | Less data-specific than Visme |
| Business tier for teams | Monthly prices vary; annual shown |
Pricing: Free: $0. Pro: $144 per year for one person. Business: $250 per year per person. Enterprise: contact sales. Source: canva.com/pricing.
Commercial use: confirm in Canva's content license terms.
6. Kittl: Typography-Led Graphics
Kittl is a design tool built around type, with AI tokens for image and text effects. It suits graphics where the typography is the infographic, such as a bold stat poster, more than dense multi-chart pages.
Best for: stat-led posters and social graphics with strong lettering. Limitations: the free tier is personal use only, so commercial teams must pay from day one. Pro and Expert include a Commercial License up to 500,000 copies, with an Enhanced License on the top tier.
| Strengths | Weaknesses |
|---|---|
| Strong typographic tools | Not built for dense data pages |
| Clear commercial-license tiers | Free plan: no commercial rights |
| AI tokens for image effects | Prices vary by region |
Pricing (US): Pro $19 monthly or $14/month billed annually, 2,000 AI tokens. Expert $49 monthly or $39/month annually, 12,000 tokens. Max $85 monthly or $65/month annually, 30,000 tokens. Free: 100 AI tokens. Source: kittl.com/pricing.
Commercial use: Free is personal use only. Pro and Expert carry a Commercial License up to 500,000 copies.
Lane 3: Presentation-First Tools
7. Gamma: Scrollable Pages With AI Layout
Gamma generates decks, documents and web-style pages from a prompt, and its card layouts make a fair "infographic-lite" for narrative summaries. It is not a chart engine, so treat it as a layout tool for stories with a few numbers. For decks specifically, the best AI presentation tools compares the field, and the alternatives view will be at best Gamma alternatives.
Best for: a one-page summary or leave-behind where the text is the point. Limitations: credit-metered, and the free tier gives 400 one-time credits that do not refill, with Gamma branding and 10 slides per prompt.
| Strengths | Weaknesses |
|---|---|
| Fast prompt-to-page generation | No dedicated chart engine |
| Unused credits roll over up to 2x | Free credits are one-time only |
| Seat-based team pricing | Business price not published |
Pricing (billed annually, per seat): Plus $9/month ($108 per seat per year), 1,000 credits a month. Pro $18/month ($216 per seat per year), 4,000 credits. Ultra $90/month ($1,080 per year), 20,000 credits. Business: 10,000 credits per seat. Source: gamma.app/pricing.
Commercial use: confirm in Gamma's terms.
8. Beautiful.ai: Smart Slides That Stay On-Brand
Beautiful.ai builds slides whose layouts adjust automatically as you add content, which makes it good for a branded, chart-friendly "infographic as slide" workflow, exported to PDF or image for sharing.
Best for: teams that live in slides and want infographic-style pages that cannot be broken by a stray drag. Limitations: there is no free plan, only a 14-day trial, and the Team card's seat wording is ambiguous: the card says it includes 3 users while the FAQ describes per-user pricing, so confirm before buying.
| Strengths | Weaknesses |
|---|---|
| Layouts self-adjust | No free plan |
| Unlimited AI generation on paid plans | Team seat wording is inconsistent |
| Good for brand-consistent slide systems | Slide-shaped, not poster-shaped |
Pricing: Pro: $14.50/month billed annually; a monthly single-presentation option is $45/month. Team: $40 per user/month annually or $50 monthly, 2 to 20 seats. Source: beautiful.ai/pricing.
Commercial use: confirm in the vendor's terms of service before client work.
Lane 4: General Image Models
These four can produce striking infographic-style art. Treat them as illustrators, not chart builders. The studies above are about exactly this class of tool. For a wider view, the best AI image generators and the best AI tools for photo generation cover the pixel side in full.
9. ChatGPT Image Generation: Convenient, Unreliable With Numbers
ChatGPT can generate an infographic image from a prompt in one chat, including text layout, which makes it the lowest-friction experiment. It is also the clearest example of the problem: figures are rendered as part of the picture.
Best for: concept illustrations, header art and quick brainstorms. Limitations: every number needs manual verification and any correction means a new generation. Free users get "limited image creation" per the plan page.
| Strengths | Weaknesses |
|---|---|
| One chat, no design skills | Numbers painted as pixels |
| Good for concept art | Edits mean regenerating |
| Already paid for by many teams | Flat PNG output, no brand kit |
Pricing (monthly): Free: limited image creation. Go: $8/month, more image creation (may include ads). Plus: $20/month, more complex and accurate image creation. Pro: from $100/month, unlimited and faster image creation. Source: chatgpt.com/pricing.
Commercial use: confirm in OpenAI's terms of use.
10. Adobe Firefly: Commercially Safe Art for Larger Brands
Firefly generates images, vectors, video and audio, and Adobe states that outputs from Firefly AI models are safe for commercial use. IP indemnification goes only to eligible enterprise customers. For alternatives, see the sibling piece on best Adobe Firefly alternatives.
Best for: brands with legal review that want assets built on Adobe's commercial-use position, then assembled in Illustrator or InDesign. Limitations: it generates assets, not data charts, and credits reset monthly with no rollover.
| Strengths | Weaknesses |
|---|---|
| Stated commercial-use position | Indemnity only for enterprise |
| Unlimited standard image and vector generation on paid plans | Credits reset monthly |
| Fits Adobe workflows | No data-chart generation |
Pricing (US, individual, labelled monthly): Standard $9.99 (2,000 credits), Pro $19.99 (4,000), Pro Plus $49.99 (10,000), Premium $199.99 (50,000 plus unlimited Firefly Video Model). Teams per license, labelled "Annual, billed monthly": Pro $19.99, Pro Plus $49.99, Premium $199.99. Source: adobe.com/products/firefly/plans.html.
Commercial use: per Adobe, outputs from Firefly models are safe for commercial use; partner-model outputs are the user's call.
11. Ideogram: Posters With Legible Text
Ideogram is known for rendering text inside images, which matters for infographic-style posters. Alternatives are covered in best Ideogram alternatives.
Best for: poster-style graphics with headlines and short labels. Limitations: the output is still a flat image, and the numbers in it are still painted. There is no free plan in the pricing table, and the FAQ says there are no free trials.
| Strengths | Weaknesses |
|---|---|
| Strong text rendering | Flat image output |
| Unlimited slow credits on paid plans | No free trial |
| Any use allowed, including commercial | Credits are metered |
Pricing: Plus: $20 monthly or $15/month billed annually ($180), 2,400 priority credits. Pro: $60 monthly or $42/month ($504/yr), 7,500 credits. Team: $30 monthly or $20 per user/month ($240/yr), 3,600 credits per user. Pay as you go: 1 cent per credit. Source: ideogram.ai/pricing.
Commercial use: Ideogram claims no ownership and allows any use including commercial, without limiting this by plan.
12. Recraft: Vector-Style Illustration
Recraft produces vector-style imagery and icons, useful for icon sets and spot illustrations that sit inside an infographic built elsewhere.
Best for: icon and illustration assets that will be placed into Visme, Canva or Illustrator. Limitations: free images are public and carry no commercial rights, and credits are metered.
| Strengths | Weaknesses |
|---|---|
| Vector-style icons and illustrations | Not a chart or layout tool |
| Paid plans give full ownership | Free: public, non-commercial, owned by Recraft |
| Ownership survives cancellation | Credits limit volume |
Pricing (billed annually): Basic $10/month ($120/year, 1,000 credits a month). Pro $16/month ($192, 2,000 credits). Teams $18 per seat/month, 2,000 credits per seat. Free: 3 generations per style per day. Source: recraft.ai/pricing.
Commercial use: Free: no commercial use. Paid plans get full ownership and commercial rights, which survive cancellation.
Data Accuracy: What Each Tool Does With Your Numbers
| Tool | How numbers are handled | Risk level | Your check |
|---|---|---|---|
| Napkin AI | Text becomes editable visuals | Medium | Compare every figure to source text |
| Piktochart | Charts from data you enter | Low | Check the data table |
| Venngage | Charts from data you enter | Low | Check the data table |
| Visme | Charts and widgets from data | Low | Check the data table |
| Canva | Charts from data you enter | Low | Check the data table |
| Gamma | AI-written text on cards | Medium | Verify every stat in the draft |
| Beautiful.ai | Charts from data you enter | Low | Check the data table |
| Kittl | Typography, no data layer | Not applicable | Type values yourself |
| ChatGPT image | Numbers painted into pixels | High | Check every digit and bar |
| Adobe Firefly | Art only | Not applicable | Keep numbers out of the prompt |
| Ideogram | Numbers painted into pixels | High | Check every digit and bar |
| Recraft | Art only | Not applicable | Keep numbers out of the prompt |
The rule that follows: let AI draft the story and the layout, type the data yourself, and have a second person check the final export against the source sheet. One extra minute of review is cheaper than a retraction.
Editable Output, Export Formats and Brand Kits
Export format decides what happens at version two. A flat PNG means the next edit is a rebuild. An editable file means the next edit is a typo fix.
| Tool | Editable after generation | Export notes |
|---|---|---|
| Napkin AI | Yes, every element | PNG and PDF free; PPT and SVG paid |
| Piktochart | Yes | Free plan limited to 2 PNG downloads |
| Venngage | Yes | Free sharing is public only |
| Visme | Yes | Includes interactive and document output |
| Canva | Yes | Standard editor exports |
| Gamma | Yes, as cards | Page and deck formats |
| Beautiful.ai | Yes, within smart layouts | Slide exports |
| Kittl | Yes | Design exports |
| ChatGPT image | No, regenerate | Flat image |
| Adobe Firefly | Partly, via Adobe apps | Assets for Adobe tools |
| Ideogram | No, regenerate | Flat image |
| Recraft | Vector-style assets | Placed into other editors |
Brand kits are where team time is saved or lost. The structured tools let you store colours, fonts and logos once; the image models only follow your brand if you describe it in every prompt. Which pricing tier unlocks the brand kit varies by vendor and is not always on the pricing page, so ask the sales page or the plan comparison before you buy. For logo and identity assets that feed a kit, see the best AI logo generators.
Commercial Use and Ownership at a Glance
For infographics sold to clients or published in paid campaigns, rights matter as much as price.
| Tool | Free-tier commercial rights | Paid-tier position |
|---|---|---|
| Napkin AI | Confirm with vendor | Confirm with vendor |
| Piktochart | Confirm with vendor | Confirm with vendor |
| Venngage | Confirm with vendor | Confirm with vendor |
| Visme | Confirm with vendor | Confirm with vendor |
| Canva | Confirm with vendor | Confirm with vendor |
| Gamma | Confirm with vendor | Confirm with vendor |
| Kittl | No, personal use only | Commercial License up to 500,000 copies on Pro and Expert |
| Adobe Firefly | Outputs described as safe for commercial use | Indemnification for eligible enterprise customers only |
| Ideogram | Any use allowed, no plan limit | Same |
| Recraft | No, and Recraft owns the images | Full ownership and commercial rights, survive cancellation |
"Confirm with vendor" is not a warning. It means the answer lives in the terms of service, and a team that sells client work should read that document before choosing, not after.
A Review Routine That Catches Bad Numbers
Every team that adopts one of these tools ends up inventing a review habit, usually after the first embarrassing error. It is cheaper to design it up front. The routine below takes about five minutes per infographic and works with any tool in this guide.
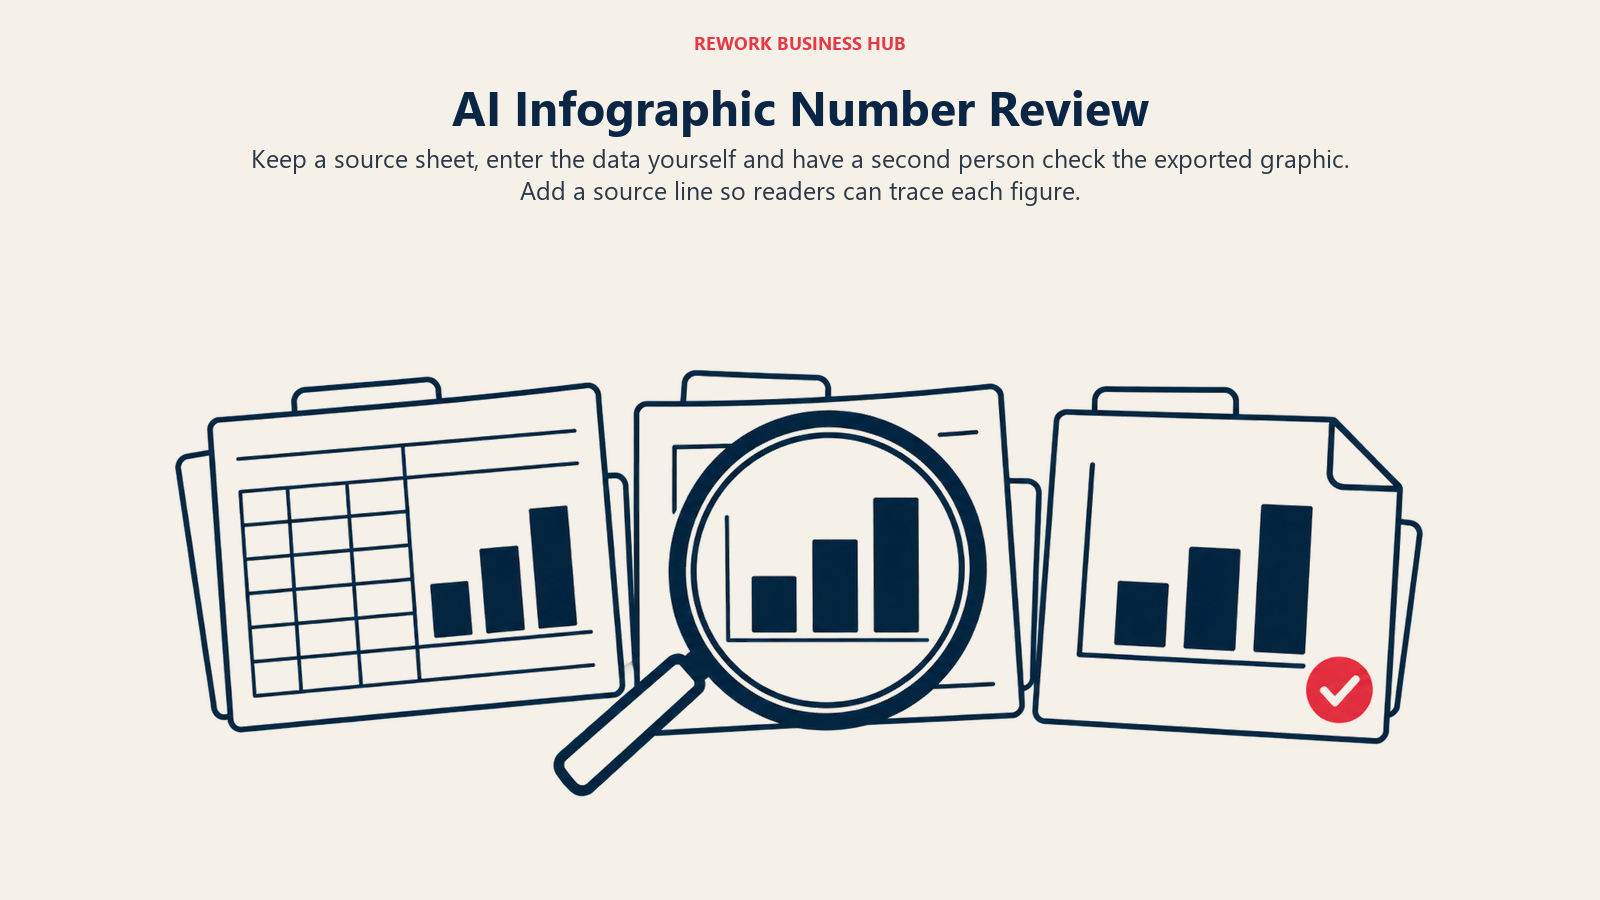
First, keep a source sheet. A single spreadsheet row per statistic, with the figure, the publisher and the link, lives next to the design file. Second, build or type the data yourself. If the tool offers to "fill in" statistics, switch that off or delete them and replace them with figures from the sheet. Third, have someone who did not make the graphic check each number against the sheet, reading the exported file and not the editor view, because exports occasionally differ from what you saw on screen. Fourth, put the source in the graphic itself, in small type at the foot, so a reader can trace it and an editor who borrows your visual can cite it.
Teams that publish for search should also remember that an infographic is only half the asset. The text around it, ideally a short summary with the key figures written as plain sentences, is what search engines and answer engines can actually read. A graphic that holds the only copy of a statistic is invisible to both.
For agencies, the routine has a commercial side. Put the review step in the statement of work, and record which tool and plan produced each deliverable. If a client later asks about rights, you can answer from the vendor's published terms instead of from memory, and for tools where the pricing page says nothing about ownership, you will already have read the terms.
What 20 Infographics a Month Really Costs
Take a marketing team of three producing 20 infographics a month, a mix of data-led report graphics and illustrated explainers. Using each vendor's annual-billed price per person where one is published:
| Option | Plan | Billing basis | Team of 3, per year |
|---|---|---|---|
| Napkin AI | Plus, $9/person/mo | Billed yearly | $324 |
| Piktochart | Pro, $10/member/mo | Billed annually | $360 |
| Canva | Pro, $144/person/yr | Yearly | $432 |
| Canva | Business, $250/person/yr | Yearly | $750 |
| Gamma | Pro, $216/seat/yr | Billed annually | $648 |
| Visme | Team, 3 users | Annual | $864 |
| Venngage | Business, $24/user/mo | Billed yearly | $864 |
| Ideogram | Team, $240/user/yr | Annual | $720 |
| Beautiful.ai | Team, $40/user/mo | Annual | $1,440 |
Two caveats. First, ChatGPT Plus at $20/month per person is monthly-only on the plan page, so three seats is $720 a year at that rate, though many teams already pay for it. Second, credits matter more than seats: Napkin's roughly one credit per word means a 150-word infographic uses about 150 of a person's 10,000 monthly credits, so 20 a month fits easily. Gamma's Plus plan gives 1,000 credits and Pro 4,000, so heavy generation can run through an allowance quickly.
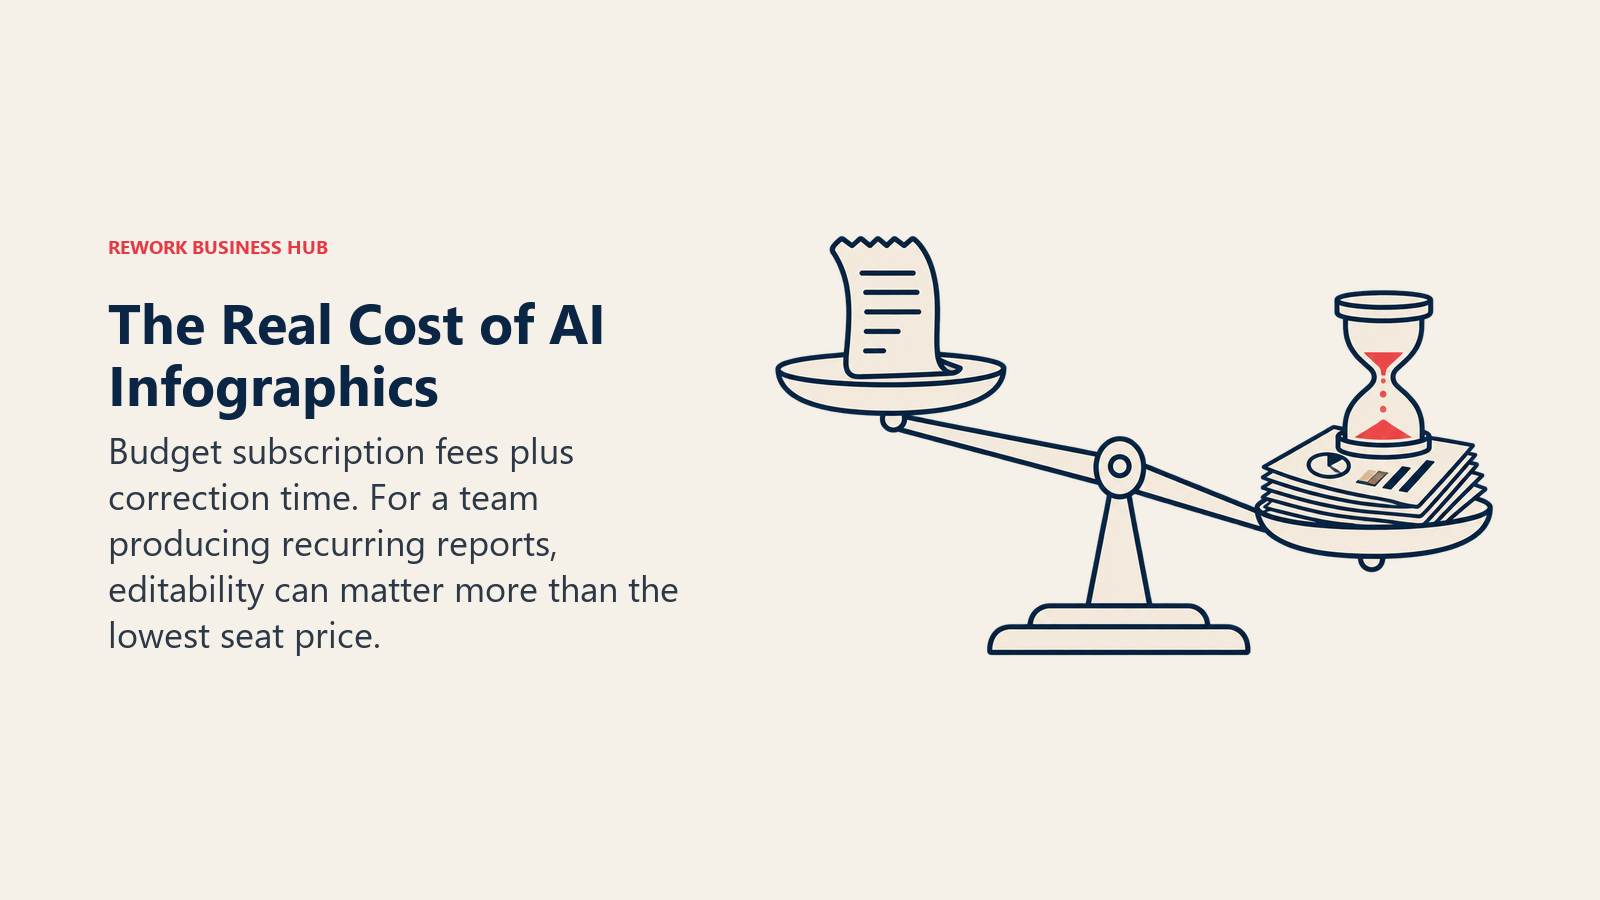
The ranking flips once you add the checking step. The cheapest per-seat tool is not the cheapest if its output is a flat image that a designer has to rebuild for every revision. A realistic cost line is the subscription plus the minutes spent on correction.
| Scenario | Likely best pick | Why |
|---|---|---|
| Fast concept visuals from finished text | Napkin AI | Lowest cost, quick, editable |
| Weekly report-style infographics | Piktochart or Venngage | Data-fed charts and templates |
| Same stats across deck, one-pager and graphic | Visme | One workspace for all three |
| Team already on Canva | Canva Business | No new tool to train |
| Stat posters with strong type | Kittl Pro | Typographic control and a stated commercial license |
| Illustrations around the infographic | Firefly or Recraft | Rights clarity and vector-style output |
How to Choose: Decision Framework
| If you need... | Pick | Watch for |
|---|---|---|
| The fastest text-to-visual workflow | Napkin AI | Verify extracted numbers |
| Charts that stay true to your data | Visme, Piktochart or Venngage | Credit and download limits |
| One editor for the whole team | Canva Business | AI usage caps |
| A narrative page, not a dense chart | Gamma | Credit burn and no chart engine |
| Slides that double as infographics | Beautiful.ai | Seat wording on the Team plan |
| Clear commercial rights for client work | Firefly, Ideogram or Recraft (paid) | Read the terms for each |
| Stat posters with bold type | Kittl | Free tier is personal-only |
| Experiments and header art | ChatGPT image | Never trust the numbers |
A sensible stack for most teams is two tools: one structured tool where the numbers live, and one image model for the artwork around them. Pair Napkin or Visme with Firefly or Recraft, set the brand kit once, and write a one-line review rule: no infographic ships until a second person has checked every figure against the source.
Mistakes to Avoid
- Trusting a generated chart because it looks right. The studies above show that looking right and being right are different things.
- Choosing on seat price alone. Credit allowances and export limits decide the real cost.
- Skipping the terms. A free plan with no commercial rights is a legal problem the day an asset reaches a client.
- Using flat images for recurring reports. If it will be updated quarterly, it needs to be editable.
- Forgetting the source line. Every infographic should name where its numbers came from, in the graphic itself.
What to Do Next
Run a two-week pilot with one structured tool and one image model. Make the same five infographics in both, have a second person check every number, and compare the editing time at revision. Keep the tool that is fastest to correct, not the one that looks best on the first draft. If decks are a bigger part of your output, continue with the best AI tools for slide decks, for reporting visuals see AI reporting and visualization, and if the job is product or packaging visuals rather than data, see the best AI mockup generators.

Principal Product Marketing Strategist
On this page
- Why Infographics Are a Different AI Problem
- Key Facts
- Quick Comparison Table
- Two Ways AI Makes an Infographic
- Lane 1: Text-to-Diagram
- 1. Napkin AI: Paste Text, Get a Visual
- Lane 2: Template-First Tools With AI
- 2. Piktochart: Report-Style Infographics
- 3. Venngage: Marketing-Ready Layouts With Daily AI Credits
- 4. Visme: Data Widgets and Interactive Output
- 5. Canva: The Default for Teams Already Inside It
- 6. Kittl: Typography-Led Graphics
- Lane 3: Presentation-First Tools
- 7. Gamma: Scrollable Pages With AI Layout
- 8. Beautiful.ai: Smart Slides That Stay On-Brand
- Lane 4: General Image Models
- 9. ChatGPT Image Generation: Convenient, Unreliable With Numbers
- 10. Adobe Firefly: Commercially Safe Art for Larger Brands
- 11. Ideogram: Posters With Legible Text
- 12. Recraft: Vector-Style Illustration
- Data Accuracy: What Each Tool Does With Your Numbers
- Editable Output, Export Formats and Brand Kits
- Commercial Use and Ownership at a Glance
- A Review Routine That Catches Bad Numbers
- What 20 Infographics a Month Really Costs
- How to Choose: Decision Framework
- Mistakes to Avoid
- What to Do Next