Bahasa Indonesia
Strategi Penetrasi Pasar: Definisi dan Contoh
Turn this article into takeaways for your work.
Each assistant summarizes the article only for you and suggests best practices for your work.
Strategi penetrasi pasar adalah cara perusahaan menumbuhkan pangsa mereka di pasar yang sudah mereka masuki, menggunakan produk yang sudah mereka jual. Ini berada di kuadran berisiko paling rendah dari Ansoff Matrix, yang menjadikannya titik awal default bagi kebanyakan rencana pertumbuhan.
Apa itu strategi penetrasi pasar?
Strategi penetrasi pasar adalah rencana untuk menjual lebih banyak produk atau layanan Anda saat ini kepada basis pelanggan Anda saat ini dan untuk memenangkan pelanggan dari pesaing. Anda tidak menemukan produk baru, dan Anda tidak memasuki pasar yang tidak dikenal. Anda bersaing lebih keras di arena yang sudah Anda kenal.
Tujuannya langsung: tingkatkan persentase Anda dari total pasar yang tersedia. Anda melakukan itu melalui langkah harga, investasi promosi, distribusi yang lebih baik, atau membuat pelanggan yang ada membeli lebih sering.
Fakta Penting
- Mempertahankan pelanggan yang ada 5 hingga 7 kali lebih murah daripada mendapatkan yang baru (Bain & Company, 2023)
- Penetration pricing diadopsi oleh 80% merek consumer packaged goods selama fase masuk pasar (Nielsen, 2022)
- Perusahaan yang secara sistematis melacak pangsa pasar tumbuh pendapatan 2,3x lebih cepat daripada yang tidak (McKinsey, 2021)
Penetrasi pasar adalah salah satu dari empat opsi pertumbuhan dalam Ansoff Matrix. Memahami di mana posisinya relatif terhadap tiga kuadran lainnya membantu Anda memilih pendekatan yang tepat untuk tahap dan toleransi risiko Anda.
Penetrasi pasar dalam Ansoff Matrix
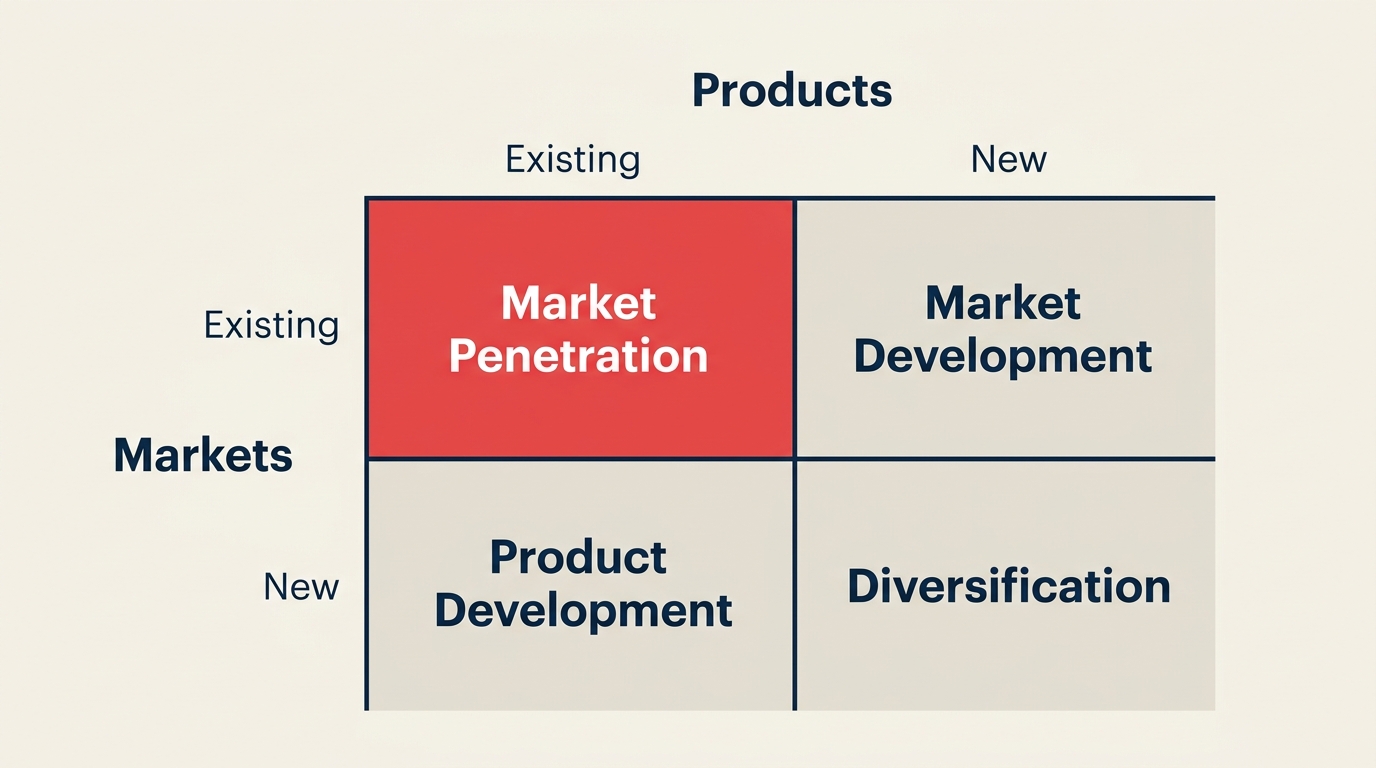
Ansoff Matrix (juga disebut Product/Market Expansion Grid) memetakan empat strategi di dua dimensi: apakah produk Anda ada atau baru, dan apakah pasar Anda ada atau baru.
| Strategi | Produk | Pasar | Tingkat risiko |
|---|---|---|---|
| Penetrasi pasar | Ada | Ada | Rendah |
| Pengembangan pasar | Ada | Baru | Sedang |
| Pengembangan produk | Baru | Ada | Sedang |
| Diversifikasi | Baru | Baru | Tinggi |
Penetrasi pasar adalah kuadran paling aman karena Anda sudah memahami pelanggan, dinamika kompetitif, dan produknya. Tidak ada biaya R&D untuk produk dan tidak ada kurva belajar untuk pasar. Risiko utamanya adalah kompresi margin jika Anda bersaing atas harga, dan pembalasan dari pesaing yang memperhatikan Anda merebut pangsa mereka.
Untuk melihat lebih dalam bagaimana keempat strategi dibandingkan dan kapan menggunakan masing-masing, lihat Strategi Generik Porter dan Competitive Advantage.
Taktik penetrasi pasar
Ada lima tuas inti. Sebagian besar perusahaan menggunakan beberapa sekaligus.
1. Penetration pricing
Tetapkan harga lebih rendah dari pesaing untuk memenangkan pelanggan yang saat ini membeli di tempat lain, atau untuk mempercepat adopsi di antara pembeli yang sensitif terhadap harga. Contoh klasiknya adalah pendatang baru yang mengalahkan pemain mapan. Risikonya: memulai perang harga yang menghancurkan margin di seluruh kategori.
Pendekatan yang berkaitan erat adalah cost leadership strategy, di mana Anda menekan biaya begitu rendah sehingga keunggulan harga Anda berkelanjutan jangka panjang, bukan sekadar taktik jangka pendek.
2. Peningkatan promosi
Tingkatkan pengeluaran marketing, tingkatkan tingkat konversi, atau jalankan promosi yang mendorong percobaan. Ini paling efektif ketika brand awareness rendah relatif terhadap kualitas produk. Tujuannya adalah mempersempit kesenjangan antara "orang yang akan membeli ini" dan "orang yang telah membeli ini."
3. Ekspansi distribusi
Jual melalui lebih banyak saluran. Jika Anda saat ini hanya online, tambahkan ritel. Jika Anda ada di tiga kota, berkembang ke sepuluh. Jika Anda menjual langsung, tambahkan reseller. Setiap titik sentuh distribusi baru memberi sebagian pasar yang sebelumnya tidak dapat dengan mudah membeli dari Anda alasan untuk berkonversi.
4. Peningkatan tingkat penggunaan
Buat pelanggan Anda yang ada membeli lebih sering atau dalam jumlah lebih besar. Upsell berlangganan, penawaran bundel, dan program loyalitas semuanya melayani tujuan ini. Model pisau cukur dan tinta printer (harga awal rendah, pendapatan konsumabel tinggi) adalah versi kanonik dari taktik ini.
5. Memenangkan pelanggan pesaing
Targetkan pengguna pesaing secara langsung dengan insentif perpindahan, konten perbandingan head-to-head, atau dukungan migrasi gratis. Perusahaan perangkat lunak B2B melakukan ini secara konsisten. Kuncinya adalah mengetahui mengapa pelanggan memilih pesaing dan membuat argumen yang kredibel untuk berpindah.
Formula tingkat penetrasi pasar
Tingkat penetrasi pasar mengukur seberapa banyak pasar yang tersedia yang benar-benar Anda miliki. Formulanya sederhana:
Tingkat penetrasi pasar = (Volume penjualan Anda / Total volume penjualan pasar) x 100
Misalnya, jika produk Anda terjual 200.000 unit tahun lalu dan total penjualan pasar adalah 2.500.000 unit, tingkat penetrasi Anda adalah:
(200.000 / 2.500.000) x 100 = 8%
Angka 8% tersebut memberi tahu Anda dua hal. Pertama, masih ada 92% pasar yang tidak Anda miliki. Kedua, jika strategi Anda adalah penetrasi pasar, target Anda adalah menggerakkan angka itu ke atas selama 12 hingga 24 bulan ke depan.
Beberapa catatan praktis tentang formula ini:
- "Total pasar" dapat berarti Total Addressable Market (TAM) atau Serviceable Addressable Market (SAM) yang lebih realistis. Konsisten dari tahun ke tahun agar tren Anda bermakna.
- Lacak ini setiap kuartal. Tingkat penetrasi yang naik mengkonfirmasi taktik Anda berhasil. Tingkat yang datar atau turun di pasar yang berkembang berarti Anda kehilangan pangsa relatif meskipun pendapatan naik.
- Bandingkan terhadap tahap siklus hidup produk. Tingkat 5% di tahun pertama kuat untuk produk baru; 5% yang sama di tahun kesepuluh di pasar yang matang menandakan masalah. Siklus hidup produk membentuk seperti apa tingkat penetrasi yang "baik" itu sebenarnya.
Manfaat dan risiko
Manfaat
- Risiko eksekusi rendah. Anda bekerja dengan pelanggan yang dikenal, produk yang dikenal, dan set kompetitif yang dikenal. Ada lebih sedikit ketidakpastian daripada di kuadran Ansoff lainnya.
- Umpan balik cepat. Data penjualan di pasar yang ada bersifat langsung. Jika sebuah taktik tidak menggerakkan pangsa, Anda tahu dalam satu kuartal.
- Skala ekonomi. Volume lebih banyak melalui basis biaya tetap yang sama meningkatkan ekonomi unit. Ini bertambah seiring waktu.
- Efek jaringan. Dalam kategori di mana word-of-mouth penting, basis pelanggan yang berkembang mempercepat pertumbuhan masa depan tanpa pengeluaran marketing yang proporsional.
Risiko
- Tekanan margin. Penetration pricing dan promosi berat menggerogoti gross margin. Jika Anda tidak dapat memulihkannya melalui volume atau retensi jangka panjang, matematikanya tidak berhasil.
- Pembalasan pesaing. Secara terbuka mengincar pelanggan pesaing mengundang respons. Pemain mapan besar dapat bertahan dalam perang harga lebih lama dari penantang.
- Kejenuhan pasar. Di pasar yang matang, penetrasi memiliki batas. Hanya ada begitu banyak pelanggan yang bisa dimenangkan. Pada titik tertentu, strategi harus bergeser ke pengembangan pasar atau pengembangan produk.
- Pertukaran pemosisian merek. Bersaing secara agresif atas harga dapat melemahkan merek premium. Begitu pelanggan mengasosiasikan Anda dengan diskon, repricing ke atas menjadi sulit.
Cara membangun strategi penetrasi pasar
Langkah 1: Hitung tingkat penetrasi Anda saat ini
Sebelum Anda menetapkan target, Anda memerlukan baseline. Gunakan formula di atas. Jika Anda tidak memiliki data total pasar yang andal, gunakan laporan industri, asosiasi perdagangan, atau estimasi analis. Data yang tidak sempurna masih lebih baik dari tidak ada data.
Langkah 2: Identifikasi di mana pangsa sedang hilang
Segmentasikan pasar Anda berdasarkan geografi, jenis pelanggan, saluran, atau lini produk. Temukan segmen di mana tingkat penetrasi Anda paling rendah relatif terhadap kinerja Anda di tempat lain. Itulah segmen di mana investasi tambahan akan menghasilkan imbal hasil tertinggi.
Langkah 3: Pilih taktik utama Anda
Pilih satu atau dua tuas dari bagian taktik di atas. Mencoba menjalankan semua lima secara bersamaan memecah upaya dan membuat atribusi menjadi tidak mungkin. Penetration pricing dan ekspansi distribusi sering kali menjadi titik awal terbaik bagi perusahaan dengan keunggulan biaya yang jelas. Promosi dan peningkatan tingkat penggunaan bekerja lebih baik ketika produk inti sudah memiliki retensi yang kuat.
Langkah 4: Tetapkan target yang terukur
"Tumbuhkan pangsa pasar" bukan target. "Tingkatkan tingkat penetrasi pasar dari 8% menjadi 12% di segmen tim perangkat lunak pada Q4" adalah target. Ikat target pada segmen tertentu, taktik tertentu, dan kerangka waktu tertentu.
Langkah 5: Pantau dan sesuaikan setiap kuartal
Lacak tingkat penetrasi, customer acquisition cost, churn, dan respons kompetitif setiap kuartal. Jika taktik Anda berhasil, skalakan. Jika tidak, ubah sebelum Anda menghabiskan satu kuartal lagi untuk sesuatu yang tidak menggerakkan angka.
Contoh penetrasi pasar
| Perusahaan | Industri | Taktik | Hasil |
|---|---|---|---|
| Netflix | Streaming video | Penetapan harga agresif saat peluncuran di bawah biaya langganan kabel | Tumbuh hingga penetrasi rumah tangga AS 40% dalam satu dekade |
| Spotify | Streaming musik | Tier gratis dengan iklan untuk memenangkan pengguna dari pembajakan dan radio | Mencapai 600 juta+ pengguna, mengonversi sebagian besar ke berbayar |
| Dollar Shave Club | Consumer goods | Penetapan harga direct-to-consumer 80% di bawah merek incumbent | Merebut 10% pasar pisau cukur pria AS dalam waktu kurang dari lima tahun |
| Slack | Perangkat lunak B2B | Tier gratis yang menargetkan tim individual, melewati pengadaan IT | Menembus enterprise besar dari bawah ke atas |
| IKEA | Ritel furnitur | Model flat-pack yang memotong harga 30 hingga 50% versus furnitur yang sudah dirakit | Membangun posisi dominan dalam furnitur rumah perakitan mandiri secara global |
| Grab | Ride-hailing (Asia Tenggara) | Tarif bersubsidi di pasar awal untuk mengalahkan Uber | Memenangkan pangsa dominan di enam negara Asia Tenggara |
Masing-masing perusahaan ini memilih satu atau dua taktik inti (penetapan harga, distribusi, atau ekspansi penggunaan) dan mengeksekusinya secara konsisten setidaknya selama dua tahun. Konsistensi lebih penting daripada memilih taktik yang "tepat."
Penetrasi pasar sering berpasangan secara alami dengan first mover advantage ketika Anda memasuki segmen lebih awal, dan dengan focus strategy ketika Anda memusatkan daya tembak pada segmen pelanggan tertentu daripada seluruh pasar.
Pertanyaan yang sering diajukan
Apakah penetrasi pasar strategi pertumbuhan berisiko paling rendah?
Ya, relatif terhadap tiga kuadran Ansoff lainnya. Karena Anda bekerja dengan produk yang ada di pasar yang sudah Anda pahami, risiko eksekusi lebih rendah daripada pengembangan produk, pengembangan pasar, atau diversifikasi. Namun "risiko lebih rendah" tidak berarti "tanpa risiko." Penetapan harga agresif dapat memicu pembalasan pesaing, dan pengeluaran promosi berat dapat menguras margin jika tidak berkonversi menjadi keuntungan pangsa yang bertahan.
Bagaimana cara menghitung tingkat penetrasi pasar?
Bagi volume penjualan Anda dengan total volume penjualan pasar dan kalikan dengan 100. Jika Anda menjual 500.000 unit di pasar di mana 5.000.000 unit terjual secara total, tingkat penetrasi Anda adalah 10%. Lacak ini setiap kuartal terhadap definisi pasar yang sama setiap kali untuk data tren yang bermakna.
Kapan Anda harus berhenti mengejar penetrasi pasar dan beralih strategi?
Dua sinyal menunjukkan saatnya beralih. Pertama, ketika tingkat penetrasi Anda mendekati kejenuhan pasar (sekitar 50% ke atas di sebagian besar kategori konsumen, lebih rendah di B2B). Kedua, ketika biaya memenangkan pangsa tambahan melebihi lifetime value pelanggan tersebut. Pada saat itu, Ansoff Matrix menunjuk ke pengembangan pasar (geografi baru, segmen baru) atau pengembangan produk sebagai alternatif dengan imbal hasil lebih tinggi.
Apa perbedaan antara penetrasi pasar dan pengembangan pasar?
Penetrasi pasar menjual produk Anda yang ada kepada pelanggan yang ada dan kepada pelanggan pesaing di pasar yang sama. Pengembangan pasar membawa produk Anda yang ada ke pasar baru (negara baru, segmen pelanggan baru, vertikal baru). Pengembangan pasar membawa risiko lebih tinggi karena Anda kehilangan keunggulan kandang dari pasar yang sudah Anda pahami.
Bisakah merek premium menggunakan taktik penetrasi pasar tanpa merusak pemosisiannya?
Ya, tetapi memerlukan kehati-hatian. Merek premium biasanya menghindari pemotongan harga, sebaliknya menggunakan ekspansi distribusi, taktik tingkat penggunaan, dan program loyalitas yang tidak memberi sinyal diskon. Apple, misalnya, menembus pasar yang ada dengan menambahkan form factor dan aksesori baru daripada memotong harga iPhone.
Memilih strategi penetrasi pasar sejatinya adalah taruhan bahwa pasar yang Anda masuki memiliki lebih banyak ruang daripada yang saat ini Anda tangkap. Sebagian besar pasar memilikinya. Perusahaan yang mengeksekusi penetrasi secara konsisten, melacak tingkatnya dengan jujur, dan menyesuaikan taktik ketika data bergeser adalah mereka yang akhirnya memiliki keunggulan pangsa yang tahan lama.
Bacaan terkait
- Matriks Ansoff: Empat Strategi Pertumbuhan Dijelaskan
- Strategi Diversifikasi: Kapan Memasuki Pasar Baru
- Keunggulan Kompetitif: Definisi dan Jenis
- Strategi Kepemimpinan Biaya: Cara Kerjanya dan Kapan Menggunakannya
- Strategi Generik Porter
- Siklus Hidup Produk: Tahapan dan Implikasi Strategi
- Keunggulan Penggerak Pertama
- Strategi Fokus

Senior Operations & Growth Strategist
On this page
- Apa itu strategi penetrasi pasar?
- Penetrasi pasar dalam Ansoff Matrix
- Taktik penetrasi pasar
- Formula tingkat penetrasi pasar
- Manfaat dan risiko
- Cara membangun strategi penetrasi pasar
- Langkah 1: Hitung tingkat penetrasi Anda saat ini
- Langkah 2: Identifikasi di mana pangsa sedang hilang
- Langkah 3: Pilih taktik utama Anda
- Langkah 4: Tetapkan target yang terukur
- Langkah 5: Pantau dan sesuaikan setiap kuartal
- Contoh penetrasi pasar
- Pertanyaan yang sering diajukan
- Bacaan terkait