Bahasa Indonesia
Value Proposition Canvas: Cara Memetakan Kesesuaian Pelanggan (Dengan Contoh)
Turn this article into takeaways for your work.
Each assistant summarizes the article only for you and suggests best practices for your work.
Value proposition canvas adalah salah satu alat yang terdengar jelas sampai Anda benar-benar menggunakannya dan menyadari bahwa Anda telah membangun hal yang salah. Sebagian besar produk tidak gagal karena eksekusi yang buruk. Mereka gagal karena tim jatuh cinta dengan solusi mereka sendiri sebelum memahami pekerjaan yang sebenarnya ingin diselesaikan pelanggan.
Apa itu value proposition canvas?
Value proposition canvas adalah alat strategi dan produk yang dibuat oleh Dr. Alexander Osterwalder, Yves Pigneur, Greg Bernarda, dan Alan Smith, yang diperkenalkan dalam buku mereka tahun 2014 Value Proposition Design (Wiley). Ini adalah cara terstruktur untuk memastikan apa yang Anda bangun benar-benar sesuai dengan apa yang dibutuhkan pelanggan Anda.
Canvas ini berfungsi sebagai pembesaran pada dua blok spesifik dari Business Model Canvas (BMC): blok Value Propositions dan blok Customer Segments. Di mana BMC memberi Anda tampilan makro dari seluruh model bisnis Anda, value proposition canvas memungkinkan Anda masuk satu level lebih dalam ke hubungan paling kritis dalam model tersebut: kecocokan antara penawaran Anda dan pelanggan Anda.
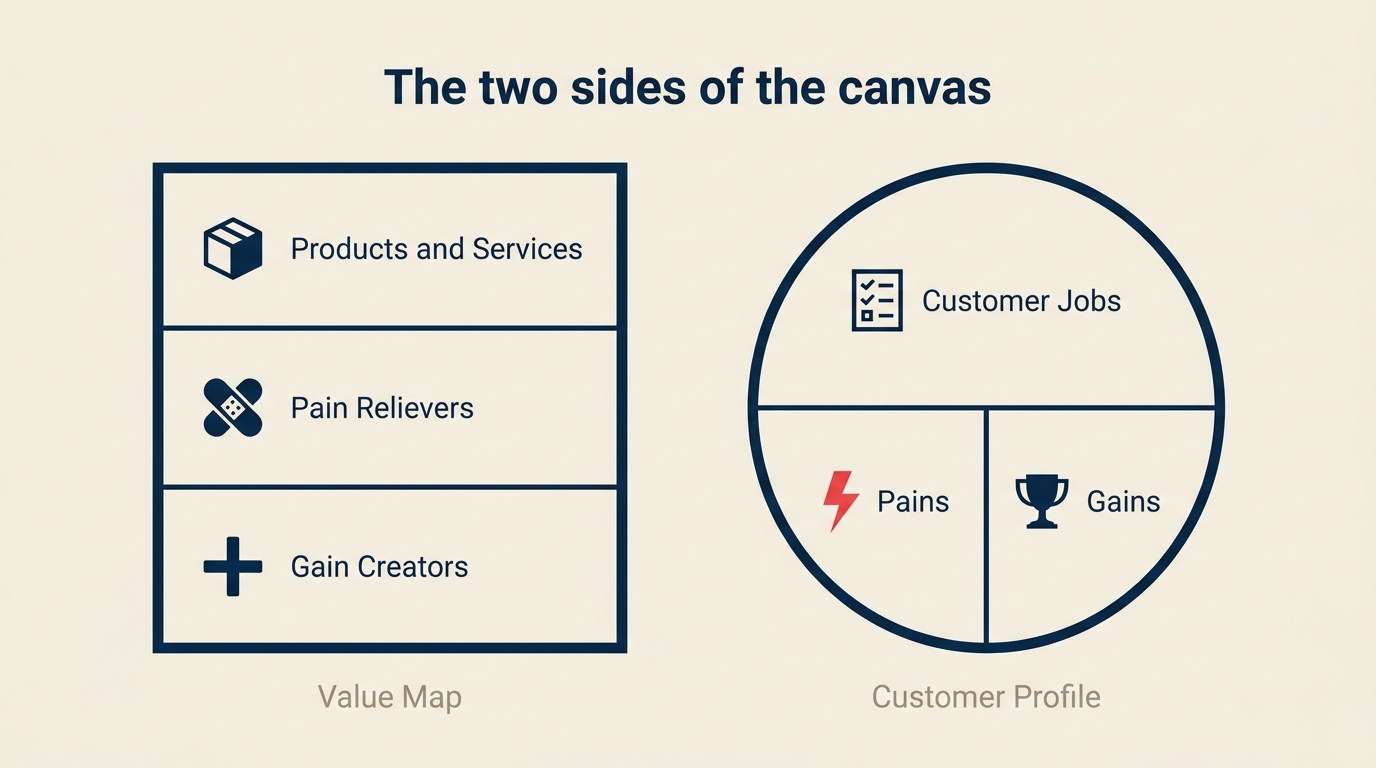
Canvas memiliki dua bagian:
- Customer Profile (diwakili sebagai lingkaran di sebelah kanan) menggambarkan dunia pelanggan.
- Value Map (diwakili sebagai kotak di sebelah kiri) menggambarkan apa yang dilakukan produk atau layanan Anda.
Ketika kedua sisi sejajar, Anda telah menemukan Fit. Ketika tidak, Anda telah menemukan kesenjangan yang perlu diperbaiki sebelum menghabiskan satu rupiah pun lagi untuk pertumbuhan.
Fakta Utama
- Alexander Osterwalder, Yves Pigneur, Greg Bernarda, dan Alan Smith memperkenalkan value proposition canvas dalam Value Proposition Design (Wiley, 2014), pendamping karya sebelumnya Business Model Generation. Buku ini tetap menjadi sumber utama yang diterbitkan untuk metodologi kerangka ini.
- Analisis CB Insights tahun 2024 tentang post-mortem startup menemukan bahwa "tidak ada kebutuhan pasar" menempati peringkat pertama sebagai alasan startup gagal, dikutip oleh 42% pendiri yang gagal. Value proposition canvas dirancang khusus untuk mengungkap ketidaksesuaian ini sebelum menjadi fatal.
- Penelitian jobs-to-be-done Clayton Christensen, yang diterbitkan dalam Competing Against Luck (HarperBusiness, 2016), menemukan bahwa pelanggan tidak membeli produk tetapi "menyewa" mereka untuk menyelesaikan suatu pekerjaan. Memulai dengan customer jobs daripada fitur produk adalah wawasan struktural yang menjadi fondasi canvas ini.
Dua sisi canvas
Customer Profile (lingkaran): Jobs, Pains, Gains
Customer profile selalu diisi terlebih dahulu. Ini memiliki tiga bagian.
Customer Jobs adalah tugas fungsional, sosial, dan emosional yang ingin diselesaikan pelanggan Anda. Pekerjaan fungsional mungkin "kirimkan proyek tepat waktu." Pekerjaan sosial mungkin "terlihat kompeten di hadapan dewan saya." Pekerjaan emosional mungkin "merasa tidak kewalahan pada hari Senin." Jobs bukan fitur produk Anda. Ini adalah alasan seseorang bangun dengan masalah yang perlu diselesaikan.
Pains adalah hambatan, frustrasi, dan risiko yang menghalangi penyelesaian pekerjaan-pekerjaan tersebut. Ini bisa berupa hasil negatif ("kami melewatkan tenggat waktu lagi"), pemblokir ("saya tidak bisa mendapatkan status tanpa mengejar lima orang"), atau ketakutan ("saya akan kehilangan klien jika ini terlewat"). Jadilah spesifik. "Ini rumit" bukan sebuah pain. "Rapat status memakan tiga jam setiap minggu dan masih membuat semua orang bingung" adalah sebuah pain.
Gains adalah hasil dan manfaat yang ingin dicapai pelanggan, diurutkan berdasarkan seberapa besar mereka menghargainya. Beberapa gains bersifat diharapkan (proyek terkirim). Yang lain diinginkan (tim tetap tenang di bawah tekanan). Beberapa adalah kejutan yang menyenangkan (alat menandai risiko sebelum ada yang memperhatikannya). Tidak semua gains sama pentingnya, dan peringkat tersebut penting untuk apa yang Anda prioritaskan.
Value Map (kotak): Products & Services, Pain Relievers, Gain Creators
Products & Services hanyalah inventaris apa yang Anda tawarkan. Ini adalah daftar, bukan promosi penjualan. Sertakan produk inti, fitur pendukung, dan layanan apa pun yang mengelilinginya.
Pain Relievers menggambarkan dengan tepat bagaimana produk dan layanan Anda mengurangi atau menghilangkan pains spesifik yang telah Anda cantumkan dalam customer profile. Ini bukan "kami membuat segalanya lebih mudah." Ini adalah "ringkasan status otomatis kami menghilangkan pain rapat status tiga jam per minggu."
Gain Creators menggambarkan bagaimana produk dan layanan Anda menghasilkan gains spesifik yang diinginkan pelanggan. Sekali lagi, spesifisitas penting. Bukan "meningkatkan efisiensi" tetapi "pemimpin operasi melaporkan pengurangan 40% dalam eskalasi selama kuartal pertama setelah peluncuran."
Apa arti "Fit" sebenarnya
Fit terjadi ketika Pain Relievers cocok dengan Pains, dan Gain Creators cocok dengan Gains. Bukan secara hipotetis. Bukan dalam teori. Dalam realitas yang divalidasi. Anda mendapatkan fit ketika pelanggan mengenali pekerjaan, pains, dan gains mereka dalam deskripsi Anda tentang apa yang Anda lakukan, dan ketika produk Anda benar-benar memberikan hal-hal yang paling mereka pedulikan. Fit bukan sebuah momen. Ini sesuatu yang Anda pertahankan seiring berkembangnya dunia pelanggan.
Bagaimana value proposition canvas berhubungan dengan business model canvas
Business Model Canvas adalah alat tingkat makro. Ini memetakan sembilan blok bangunan dari seluruh model bisnis: mitra utama, aktivitas utama, sumber daya utama, proposisi nilai, hubungan pelanggan, saluran, segmen pelanggan, struktur biaya, dan aliran pendapatan. Ini adalah tampilan dari ketinggian 30.000 kaki.
Value proposition canvas langsung memperbesar dua dari sembilan blok tersebut: Value Propositions dan Customer Segments. Anggap BMC sebagai cetak biru untuk seluruh rumah dan VPC sebagai gambar arsitektur untuk ruangan tempat sebagian besar pelanggan Anda sebenarnya tinggal. Anda membutuhkan keduanya. VPC tanpa BMC dapat menghasilkan produk dengan fit yang baik tetapi bisnis yang tidak layak. BMC tanpa VPC sering menutupi proposisi nilai yang lemah dengan slide yang terlihat mengesankan.
Cara membangun value proposition canvas dalam 6 langkah
Langkah 1: Pilih satu segmen pelanggan
Canvas hanya bekerja pada satu segmen pelanggan sekaligus. Jika Anda mencoba memetakan beberapa segmen secara bersamaan, Anda akan mendapatkan profil umum yang tidak menggambarkan siapa pun dengan baik. Sebuah perusahaan perangkat lunak B2B mungkin memiliki dua segmen yang berbeda: direktur operasi yang menyetujui pembelian dan manajer proyek yang menggunakannya setiap hari. Orang-orang ini memiliki jobs, pains, dan gains yang berbeda. Bangun canvas terpisah untuk masing-masing.
Langkah 2: Daftarkan customer jobs (3 hingga 6)
Wawancarai pelanggan nyata atau gunakan penelitian yang sudah ada. Tuliskan pekerjaan fungsional yang ingin mereka selesaikan, persepsi sosial yang ingin mereka kelola, dan keadaan emosional yang ingin mereka capai atau hindari. Urutkan berdasarkan kepentingan bagi pelanggan, bukan berdasarkan relevansi dengan produk Anda. Anda akan menyadari diri Anda menyaring terlalu awal jika Anda mulai dengan produk Anda dalam pikiran.
Langkah 3: Daftarkan pains (3 hingga 6)
Untuk setiap pekerjaan utama, tuliskan apa yang menghalangi. Apa yang terlalu lambat, terlalu mahal, terlalu tidak andal, atau terlalu berisiko? Hasil apa yang mereka khawatirkan? Solusi saat ini apa yang membuat frustrasi mereka? Jadilah spesifik. Pains yang samar menghasilkan pain relievers yang samar. Gunakan kata-kata pelanggan sendiri jika memungkinkan. Urutkan pains dari parah hingga sedang.
Langkah 4: Daftarkan gains (3 hingga 6)
Tuliskan hasil dan manfaat yang akan dianggap berharga oleh pelanggan. Pisahkan apa yang mereka harapkan sebagai dasar (table stakes) dari apa yang mereka inginkan (diferensiator) dari apa yang benar-benar akan mengejutkan dan menyenangkan mereka. Sekali lagi, urutkan. Gains yang paling berharga harus mendorong keputusan desain Anda.
Langkah 5: Petakan produk dan layanan Anda ke pain relievers dan gain creators
Sekarang beralih ke kotak Value Map. Untuk setiap pain yang Anda cantumkan, tuliskan pain reliever spesifik yang disampaikan produk Anda. Untuk setiap gain, tuliskan gain creator spesifik. Tidak setiap pain membutuhkan pain reliever dan tidak setiap gain membutuhkan gain creator. Anda mencari yang di mana Anda memiliki cerita yang dapat dipercaya dan spesifik, bukan cermin lengkap dari customer profile.
Langkah 6: Nilai fit dan identifikasi kesenjangan
Lihat berapa persentase pains teratas dan gains teratas pelanggan yang benar-benar ditangani oleh produk Anda. Di mana kesenjangannya? Di mana Anda memiliki pain reliever atau gain creator yang memetakan ke sesuatu yang sebenarnya tidak terlalu dipedulikan pelanggan? Kesenjangan adalah product roadmap Anda. Ketidaksesuaian adalah fitur yang harus diprioritaskan lebih rendah. Dokumentasikan ini secara jujur. Canvas yang setengah benar lebih buruk dari tidak ada canvas sama sekali.
Contoh yang dikerjakan: perangkat lunak proyek B2B fiktif untuk tim operasi
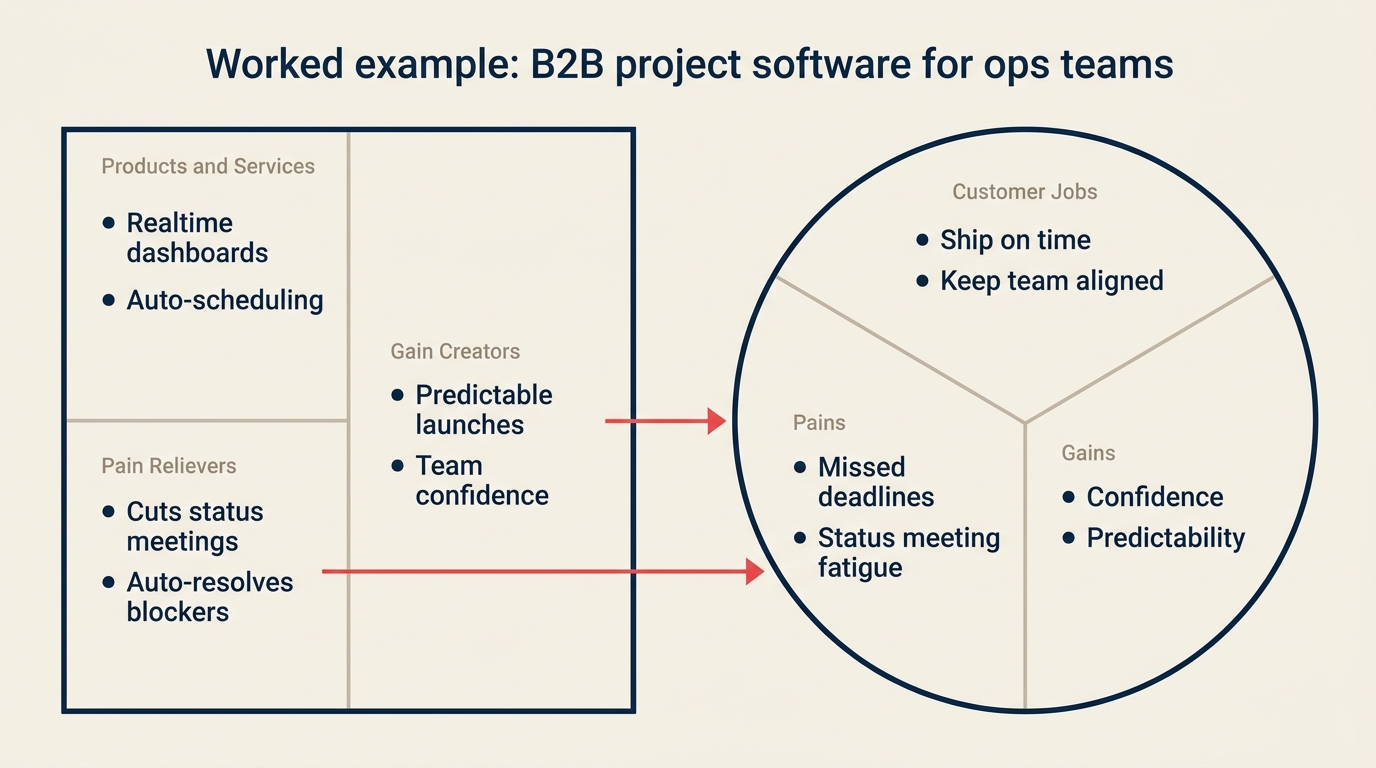
Berikut tampilan canvas yang diisi untuk alat manajemen proyek B2B fiktif yang menargetkan direktur operasi di perusahaan mid-market (50-500 karyawan). Contoh menggunakan produk yang akan kita sebut "Clearpath."
| Sisi Pelanggan | Sisi Nilai |
|---|---|
| Job: Kirimkan proyek tepat waktu di seluruh tim yang tersebar | Produk: Dashboard proyek realtime dengan pelacakan ketergantungan |
| Job: Beri informasi kepada kepemimpinan tanpa panggilan status mingguan | Produk: Ringkasan status otomatis, dikirim harian kepada pemangku kepentingan |
| Pain: Tenggat waktu yang terlewat karena pemblokir yang tidak terlihat | Pain Reliever: Menandai tugas yang berisiko secara otomatis 5 hari sebelum terlambat |
| Pain: Kelelahan rapat status (3+ jam/minggu) | Pain Reliever: Ringkasan menggantikan panggilan status Senin yang sudah tetap |
| Pain: Budaya saling menyalahkan ketika proyek terlambat | Pain Reliever: Visibilitas bersama menghilangkan alasan "saya tidak tahu" |
| Gain: Tanggal peluncuran yang dapat diprediksi | Gain Creator: Perkiraan Monte Carlo menunjukkan % probabilitas pengiriman tepat waktu |
| Gain: Kepercayaan diri tim di bawah tekanan | Gain Creator: Pemblokir diteruskan secara otomatis ke pemilik yang tepat, tidak dibiarkan menumpuk |
| Gain: Terlihat kompeten di hadapan dewan | Gain Creator: Laporan siap-dewan dengan satu klik dari data proyek langsung |
Tabel menunjukkan fit nyata di empat tempat: pain reliever penandaan pemblokir secara langsung mengatasi pain tenggat waktu yang terlewat, produk ringkasan secara langsung menghilangkan pain kelelahan rapat, fitur Monte Carlo menciptakan gain "prediktabilitas", dan laporan dewan menciptakan gain sosial "terlihat kompeten". Inilah fitur yang harus ditonjolkan dalam pemosisian. Semua hal lain di roadmap adalah sekunder sampai fit divalidasi dalam skala.
3 tingkat customer fit (dan cara mengujinya)
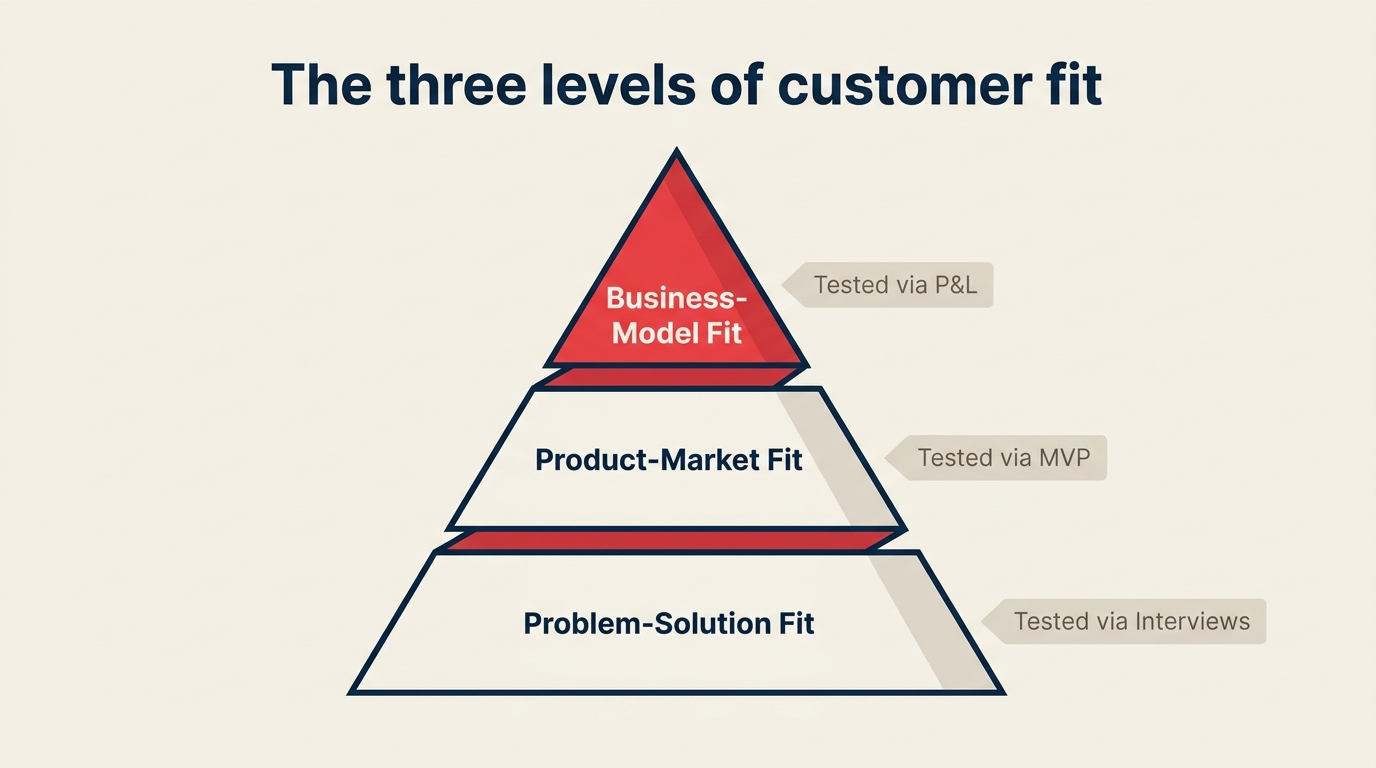
Fit bukanlah biner. Osterwalder dan Pigneur menggambarkan tiga tingkat yang berbeda, masing-masing membutuhkan bukti berbeda untuk dikonfirmasi. Mencampuradukkan tingkat-tingkat ini adalah salah satu alasan paling umum tim menskalakan secara prematur.
Problem-solution fit
Ini adalah tahap paling awal. Anda memiliki bukti bahwa masalah nyata ada dan bahwa solusi yang Anda usulkan masuk akal secara konseptual bagi orang nyata. Ujinya bersifat kualitatif: wawancara pelanggan, uji landing page, panduan prototipe. Anda tidak membuktikan bahwa produk berfungsi. Anda membuktikan bahwa pelanggan cukup peduli dengan pain untuk menginginkan solusi dan bahwa pendekatan yang Anda usulkan beresonansi. Sebagian besar tim bergegas melalui tahap ini. Analisis SWOT adalah pelengkap yang berguna di sini: petakan apakah pains pelanggan selaras dengan kelemahan pasar nyata yang tidak ditangani pesaing dengan baik.
Product-market fit
Di sini Anda memiliki bukti bahwa produk yang berfungsi sebenarnya memecahkan masalah bagi sejumlah pelanggan nyata yang bermakna. Ujinya bersifat perilaku: kurva retensi mendatar, Net Promoter Score (NPS) melampaui ambang batas (sering dikutip sebagai 40+ pada "seberapa kecewa Anda jika produk ini hilang?"), dan data kohort menunjukkan pelanggan kembali daripada churn. Sean Ellis menciptakan "aturan 40%" untuk product-market fit pada 2010, dan ini tetap menjadi tolok ukur yang banyak digunakan dalam B2B SaaS. Ini adalah tahap di mana value proposition canvas diuji tekanan oleh data nyata. Kesenjangan yang Anda tutupi dalam contoh yang dikerjakan menjadi terlihat dalam wawancara churn.
Business-model fit
Di sinilah banyak produk yang sebenarnya menjanjikan terhenti. Business-model fit berarti proposisi nilai Anda menghasilkan pendapatan yang melebihi biaya untuk menyampaikannya pada skala penuh, secara berkelanjutan. Ujinya bersifat finansial: unit economics, customer acquisition cost (CAC) versus lifetime value (LTV), dan apakah model penetapan harga Anda benar-benar menangkap cukup nilai yang Anda ciptakan. Produk dengan problem-solution fit yang kuat dan product-market fit yang kuat masih bisa gagal di sini jika gerak go-to-market terlalu mahal atau penetapan harga meninggalkan terlalu banyak nilai di atas meja. Business Model Canvas adalah alat yang tepat untuk dikerjakan pada tahap ini. Jika pekerjaan Ansoff Matrix Anda mengarah pada ekspansi, konfirmasi business-model fit di segmen inti terlebih dahulu sebelum menskalakan ke segmen yang berdekatan.
Kesalahan umum saat menggunakan value proposition canvas
- Menulis jobs yang aspiratif daripada jobs yang nyata. "Menjadi pemimpin pasar" bukan customer job. "Kurangi time-to-close sebesar 20% kuartal ini agar saya memenuhi target VP saya" adalah job yang nyata. Wawancarai pelanggan. Jangan menciptakan dunia mereka dari ruang konferensi.
- Mencampuradukkan pains dengan ketidakhadiran gains. "Mereka menginginkan pelaporan yang lebih cepat" adalah gain yang diinginkan, bukan pain. Pain adalah "mereka membuang dua jam setiap Jumat secara manual mengekspor data dari tiga sistem." Jaga kategori tetap bersih atau pain relievers Anda akan samar.
- Mendaftarkan fitur sebagai pain relievers. "Dashboard berbasis AI" adalah fitur. "Mengurangi waktu pelaporan manual dari 2 jam menjadi 8 menit" adalah pain reliever. Canvas harus berbicara dalam bahasa pelanggan, bukan bahasa tim rekayasa.
- Membangun satu canvas untuk beberapa segmen. CTO enterprise dan pendiri startup keduanya "membutuhkan manajemen proyek," tetapi jobs, pains, dan gains mereka sama sekali berbeda. Gabungkan mereka dan Anda akan merancang produk yang tidak memuaskan keduanya.
- Memperlakukan canvas sebagai artefak satu kali. Konteks pelanggan berubah. Pain yang mendominasi pada 2022 mungkin sudah diselesaikan pada 2026 karena pesaing mengatasinya. Tinjau ulang canvas setidaknya setiap tahun dan setiap kali Anda melihat perubahan bermakna dalam pola churn atau menang-kalah.
Value proposition canvas vs lean canvas vs business model canvas
Ketiga alat saling melengkapi tetapi menjawab pertanyaan yang berbeda. Mengetahui kapan menggunakan mana mencegah pengulangan yang mahal.
| Alat | Dibuat oleh | Terbaik untuk | Granularitas | Kapan menggunakan |
|---|---|---|---|---|
| Value Proposition Canvas | Osterwalder, Pigneur, Bernarda, Smith (2014) | Memvalidasi customer-product fit sebelum membangun | Customer jobs / pains / gains vs. fitur produk | Sebelum product-market fit; saat memposisikan ulang produk yang ada |
| Lean Canvas | Ash Maurya (2010, diadaptasi dari BMC) | Startup tahap awal yang memetakan asumsi problem-solution | Masalah, solusi, UVP, keunggulan tidak adil, saluran, biaya, pendapatan | Pra-produk, ketika kecepatan pengujian asumsi paling penting |
| Business Model Canvas | Osterwalder dan Pigneur (2010) | Memetakan model bisnis lengkap di sembilan blok bangunan | Tampilan makro seluruh perusahaan tentang penciptaan dan penangkapan nilai | Saat mengevaluasi model bisnis penuh, pasca product-market fit, atau selama pivot strategis |
Untuk perbandingan lebih mendalam tentang alat strategi yang saling melengkapi, analisis PESTEL menangani pemindaian lingkungan makro, Porter's Five Forces menangani struktur industri, dan BCG Matrix menangani alokasi portofolio setelah Anda memiliki beberapa produk di pasar. Value proposition canvas berada lebih awal dalam rantai, sebelum keputusan alokasi tersebut diperlukan.
Pertanyaan yang sering diajukan
Apa perbedaan antara value proposition canvas dan business model canvas?
Business Model Canvas adalah tampilan seluruh perusahaan. Ini memetakan sembilan blok bangunan: mitra utama, aktivitas, sumber daya, proposisi nilai, hubungan pelanggan, saluran, segmen pelanggan, struktur biaya, dan aliran pendapatan. Value proposition canvas adalah pembesaran hanya pada dua dari sembilan blok tersebut: Value Propositions dan Customer Segments. Gunakan BMC untuk memahami seluruh model bisnis Anda dan VPC untuk masuk mendalam tentang apakah produk Anda benar-benar memecahkan masalah nyata bagi segmen pelanggan tertentu. Keduanya dirancang untuk digunakan bersama, bukan sebagai alternatif.
Apakah saya mengisi sisi pelanggan atau sisi produk terlebih dahulu?
Selalu mulai dengan Customer Profile. Isi jobs, pains, dan gains berdasarkan penelitian pelanggan nyata sebelum Anda menyentuh Value Map. Seluruh tujuan canvas adalah mencegah Anda merancang dari asumsi Anda sendiri. Jika Anda memulai dengan fitur produk Anda dan kemudian mencoba memetakan pelanggan ke dalamnya, Anda akan merasionalisasi fit daripada menemukannya. Customer profile adalah batasan. Value map adalah respons Anda terhadap batasan tersebut.
Berapa banyak canvas yang harus saya miliki untuk satu produk?
Satu canvas per segmen pelanggan. Jika produk Anda benar-benar melayani dua segmen yang berbeda (misalnya, direktur HR dan manajer departemen), bangun dua canvas terpisah. Jobs, pains, dan gains mereka akan cukup berbeda sehingga canvas yang digabungkan akan menghasilkan gambaran yang kabur dan tidak akurat. Tidak ada aturan yang membatasi jumlah canvas per produk. Batasan praktisnya adalah kedalaman penelitian pelanggan yang dapat Anda lakukan per segmen.
Apakah value proposition canvas masih relevan di tahun 2026?
Ya. Masalah mendasar yang dipecahkannya belum berubah: pembangun masih memiliki kecenderungan struktural untuk melebih-lebihkan ide mereka sendiri dan berinvestasi kurang dalam pemahaman pelanggan. Justru munculnya alat AI generatif yang dapat menghasilkan konsep produk dengan cepat membuat canvas menjadi lebih penting, bukan kurang. Menghasilkan ide lebih cepat menciptakan lebih banyak peluang untuk membangun hal yang salah dengan lebih cepat. Canvas adalah disiplin yang membuat ideasi tetap membumi pada apa yang benar-benar dibutuhkan pelanggan. Kerangka critical success factors (CSF) dan SMART business objectives cocok dipadukan dengan canvas: setelah Anda mengonfirmasi fit, CSF dan tujuan SMART membantu Anda mengoperasionalkan pengiriman terhadap customer jobs yang Anda komitmenkan.
Value proposition canvas bekerja karena tidak nyaman. Ini memaksa Anda untuk menuliskan apa yang benar-benar diinginkan pelanggan, bukan apa yang Anda harapkan mereka inginkan, dan kemudian memegang produk Anda di hadapan daftar tersebut dengan jujur. Tim yang menggunakannya dengan ketat sebelum membangun cenderung membangun lebih sedikit dan menjual lebih banyak. Itulah satu-satunya metrik yang penting.

Senior Operations & Growth Strategist
On this page
- Apa itu value proposition canvas?
- Dua sisi canvas
- Customer Profile (lingkaran): Jobs, Pains, Gains
- Value Map (kotak): Products & Services, Pain Relievers, Gain Creators
- Apa arti "Fit" sebenarnya
- Bagaimana value proposition canvas berhubungan dengan business model canvas
- Cara membangun value proposition canvas dalam 6 langkah
- Langkah 1: Pilih satu segmen pelanggan
- Langkah 2: Daftarkan customer jobs (3 hingga 6)
- Langkah 3: Daftarkan pains (3 hingga 6)
- Langkah 4: Daftarkan gains (3 hingga 6)
- Langkah 5: Petakan produk dan layanan Anda ke pain relievers dan gain creators
- Langkah 6: Nilai fit dan identifikasi kesenjangan
- Contoh yang dikerjakan: perangkat lunak proyek B2B fiktif untuk tim operasi
- 3 tingkat customer fit (dan cara mengujinya)
- Problem-solution fit
- Product-market fit
- Business-model fit
- Kesalahan umum saat menggunakan value proposition canvas
- Value proposition canvas vs lean canvas vs business model canvas
- Pertanyaan yang sering diajukan
- Apa perbedaan antara value proposition canvas dan business model canvas?
- Apakah saya mengisi sisi pelanggan atau sisi produk terlebih dahulu?
- Berapa banyak canvas yang harus saya miliki untuk satu produk?
- Apakah value proposition canvas masih relevan di tahun 2026?