Objection Mining: Wogegen Käufer wirklich Einwände erheben
Turn this article into takeaways for your work.
Each assistant summarizes the article only for you and suggests best practices for your work.
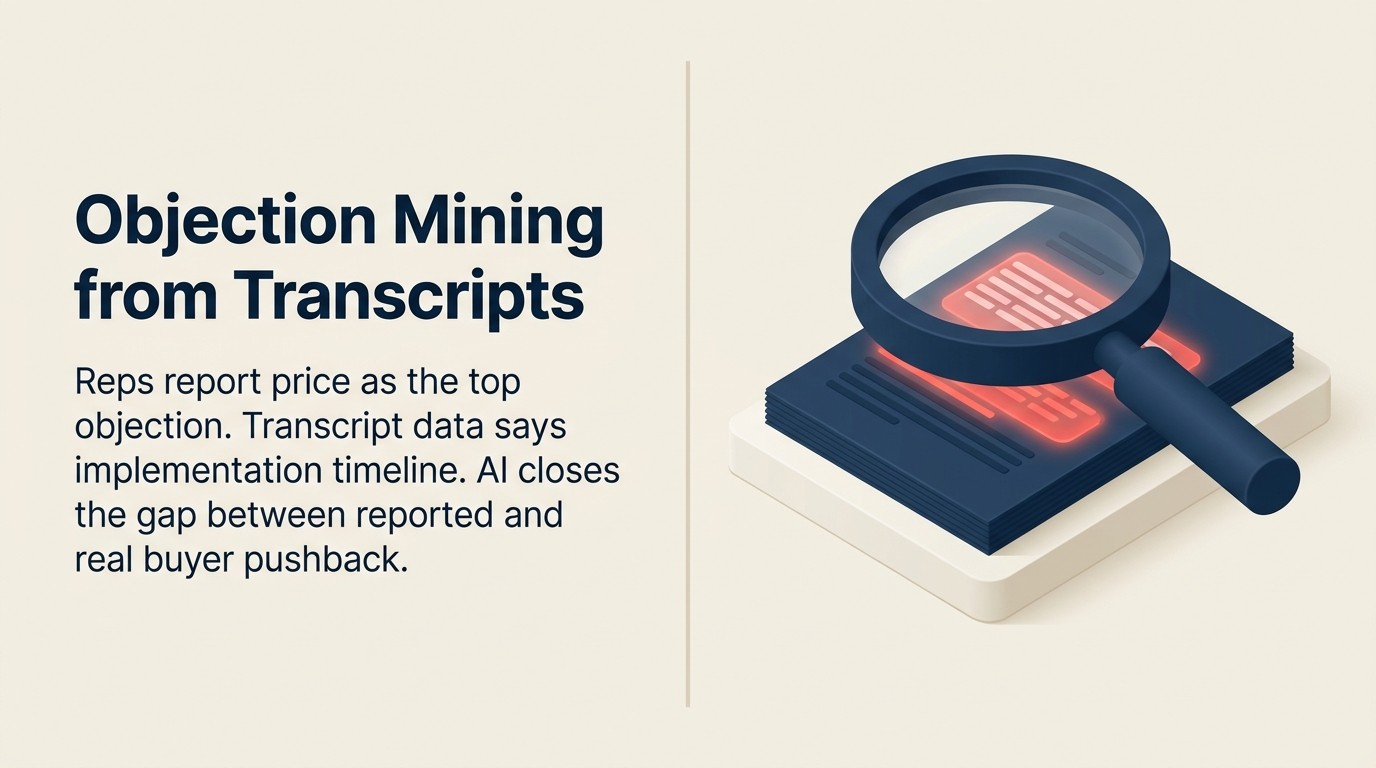
Ihre Reps sagen, der häufigste Einwand ist der Preis. Ihre Transkript-Daten sagen, es ist die Implementierungsdauer.
Diese beiden Dinge sollten nicht unterschiedlich sein. Aber bei fast jedem Revenue Operations (RevOps)-Audit, das Conversation Intelligence nutzt, sind sie es. Die Lücke zwischen dem, was Sales-Reps als häufigste Einwände berichten, und dem, was Käufer tatsächlich in Calls sagen, liegt typischerweise zwischen 30 und 50%. HBR-Forschungen zu B2B-Käuferverhalten fanden, dass B2B-Kaufentscheidungen jetzt einem flüssigeren, selbstgesteuerten Prozess folgen, bei dem Käufer bereits starke Präferenzen gebildet haben, bevor sie mit Reps in Kontakt treten, was bedeutet, dass die Einwände, die sie während eines Sales Calls äußern, oft nur die Spitze eines Eisbergs unausgesprochener Bedenken sind. Diese Lücke ist nicht klein. Sie bedeutet, dass Ihre Battle Cards, E-Mail-Templates, Demo-Flows und Onboarding-Pitches alle auf ein Problem kalibriert sind, das nicht das echte Problem ist.
Objection Mining behebt das. Es nutzt die Analyze-Fähigkeit im ACE-Framework (Ingest, Analyze, Predict, Generate, Execute), um ein Korpus von Call-Transkripten zu verarbeiten, Einwands-Aussagen zu extrahieren, sie nach Typ zu klassifizieren und nach Häufigkeit und Deal-Verlust-Korrelation zu ranken. Der Output ist nicht die Erinnerung eines Reps. Es ist eine Stichprobengröße. Das ist Pattern 2 in der AI-Sales-Operator-Architektur, das eine Form von Intelligenzarbeit leistet, die kein einzelner Rep oder Manager manuell erreichen könnte.
Was Objection Mining ist
Objection Mining ist die Anwendung der Analyze-Fähigkeit der KI auf einen Satz aufgezeichneter Sales-Calls mit einem spezifischen Ziel: herausfinden, wogegen Käufer wirklich Einwände erheben, klassifiziert, gezählt und mit Deal-Ergebnissen korreliert.
Es sitzt innerhalb des Meeting-Intelligence-Patterns, das der Formel folgt: Ingest (Audio-Aufzeichnung) → Analyze (transkribieren, extrahieren, klassifizieren) → Generate (Zusammenfassung, Insight-Bericht) → Execute (Battle Cards aktualisieren, Coaching-Materialien, Sales-Assets).
Die meisten Conversation-Intelligence-Plattformen (Gong, Clari Copilot, Chorus) erledigen die Ingest- und grundlegenden Analyze-Schritte automatisch. Objection Mining geht die nächste Analyze-Ebene weiter: nicht nur „was ist in diesem Call passiert", sondern „welche Patterns wiederholen sich über 400 Calls?"
Das typische Setup:
- Transkripte der letzten 90 bis 180 Tage ziehen (Minimum 100 Calls für statistische Relevanz).
- Einen Extraktions-Pass durchführen, um Einwands-Aussagen aus jedem Call herauszuziehen.
- Einwände nach Typ klassifizieren.
- Mit Deal-Ergebnis (gewonnen/verloren) kreuzen.
- Eine Häufigkeits-und-Korrelations-Tabelle erstellen.
- Vierteljährlich durchführen.
Dieses Setup ist unkompliziert. Die schwieriger Frage ist, was Sie mit dem Output machen.
Wichtige Fakten: Einwands-Intelligenz
- Die Lücke zwischen dem, was Sales-Reps als häufigste Einwände berichten, und dem, was Käufer tatsächlich in Calls sagen, liegt typischerweise bei 30 bis 50%, laut RevOps-Audits mit Conversation-Intelligence-Daten
- HBR-Forschungen zu B2B-Käuferverhalten fanden, dass Käufer starke Präferenzen bilden, bevor sie mit Reps in Kontakt treten, was bedeutet, dass die Einwände, die sie während eines Sales Calls äußern, oft nur die Spitze eines Eisbergs unausgesprochener Bedenken sind
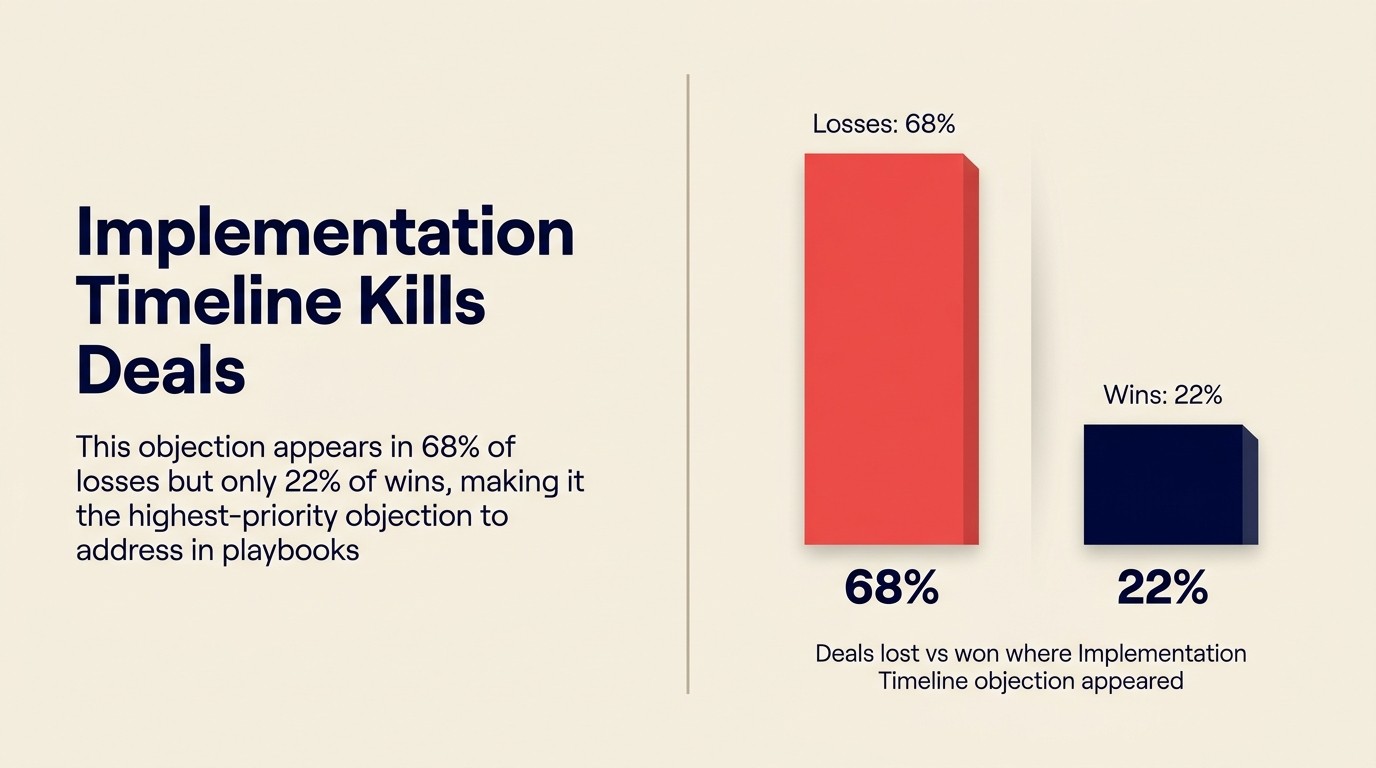
- Einwände wegen der Implementierungsdauer fallen typischerweise in das Quadranten mit hoher Häufigkeit und hohem Deal-Verlust für wachsende SaaS-Unternehmen und erscheinen im Durchschnitt in 68% der Verluste vs. 22% der Gewinne
Das Objection-Frequency-Quadrant
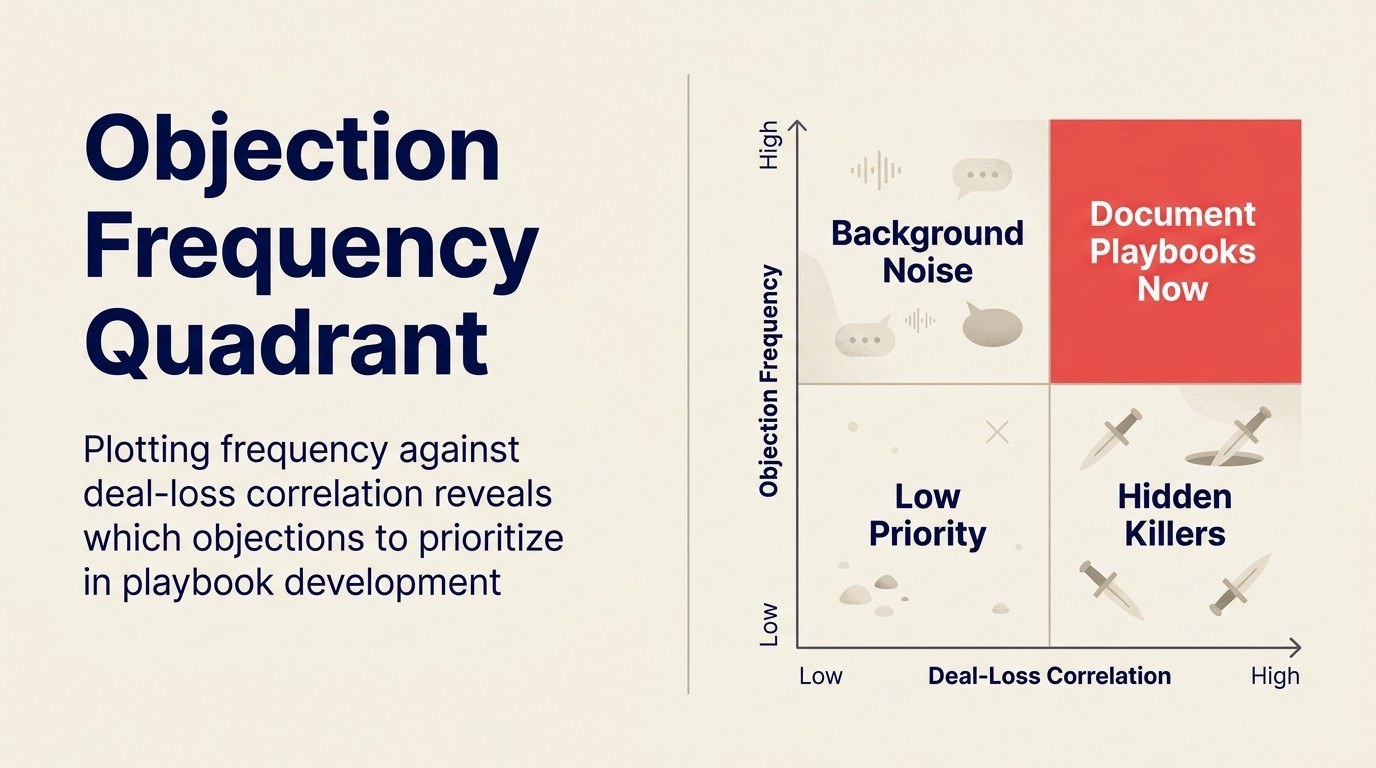
Das Objection-Frequency-Quadrant ist eine 2x2-Priorisierungsmatrix zur Steuerung von Sales-Enablement-Investitionen basierend auf Objection-Mining-Daten. Die vertikale Achse ist Häufigkeit (wie oft der Einwand im Call-Korpus auftauchte); die horizontale Achse ist Deal-Verlust-Korrelation (wie stark das Auftreten des Einwands mit einem verlorenen Deal korreliert). Einwände mit hoher Häufigkeit und hoher Korrelation sind die Fixes mit der höchsten Priorität: Sie tauchen ständig auf und töten Deals. Einwände mit hoher Häufigkeit und niedriger Korrelation dokumentieren Playbooks, die bereits funktionieren. Einwände mit niedriger Häufigkeit und hoher Korrelation sind versteckte Killer: selten, aber fast immer fatal, signalisiert normalerweise eine Fähigkeitslücke oder ein sensibles Käufersegment. Einwände mit niedriger Häufigkeit und niedriger Korrelation sind Hintergrundrauschen und sollten keine Enablement-Ressourcen erhalten. Vierteljährliches Objection Mining ordnet die gesamte Population von Einwänden dieser Matrix zu, sodass Enablement-Investitionen dorthin gehen, wo der Deal-Verlust tatsächlich passiert, nicht wo Reps glauben, dass er passiert.
Warum Reps falsch erinnern
Sales-Reps lügen nicht, wenn sie Einwände berichten. Sie machen etwas Interessanteres: Sie erinnern sich selektiv an Einwände, die sie zu handhaben wissen, und spielen diejenigen herunter, die sich außerhalb ihrer Kontrolle anfühlen.
Wenn ein Rep „Ihre Implementierungsdauer ist zu lang" hört und keine gute Antwort hat, passiert eines von zwei Dingen. Er versucht eine Übergangslösung und der Deal stagniert trotzdem, also wird er als „verloren wegen Budget" oder „verloren wegen Timing" protokolliert. Oder er schließt den Deal doch ab und überzeugt sich selbst, dass der Einwand nicht ernst war. So oder so landet der Einwand nicht akkurat im CRM.
Preis-Einwände hingegen sind vertraut und erwartet. Reps haben Skripte dafür. Sie werden erinnert und berichtet.
Das Ergebnis: Ihre Win/Loss-Daten sagen, dass Sie 45% der Zeit wegen des Preises verlieren. Ihre Transkript-Daten, analysiert über dieselben Deals, sagen, dass Implementierungsbedenken in 68% der Verluste und nur 22% der Gewinne geäußert wurden. Das eigentliche Problem hat die ganze Zeit in Ihren Call-Aufzeichnungen gesessen.
Die Einwands-Taxonomie
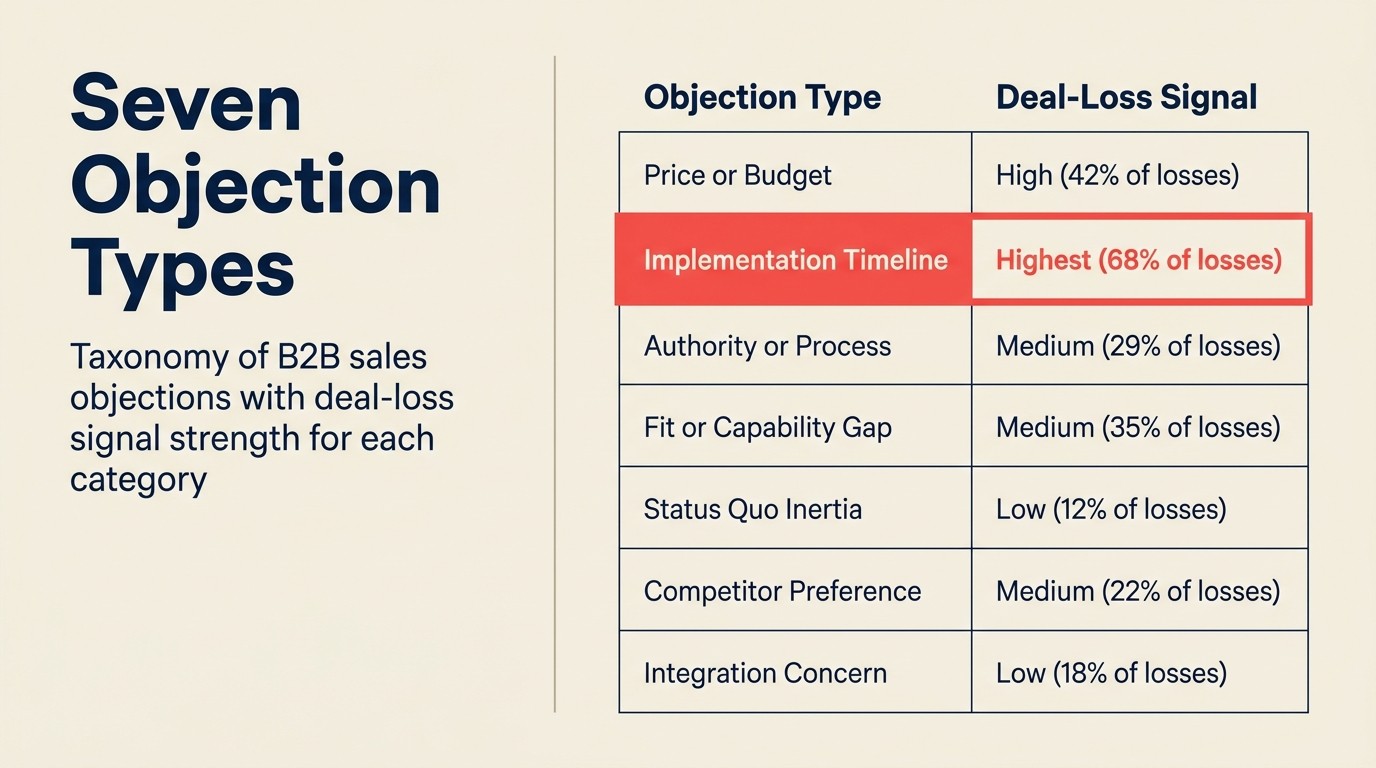
B2B-SaaS-Einwände clustern zuverlässig in sieben Kategorien. KI-Klassifikatoren, die auf Sales-Gesprächsdaten trainiert wurden, neigen dazu, dieselben zu identifizieren, weil Käufer dieselben grundlegenden Bedenken über Unternehmen und Produkte hinweg wiederholen.
| Einwands-Typ | Wie er klingt | Deal-Verlust-Signal |
|---|---|---|
| Preis / Budget | „Wir haben das Budget gerade nicht" / „Das ist mehr als wir erwartet haben" | Mittel: oft verhandelbar; signalisiert Annual Contract Value (ACV)-Obergrenze |
| Implementierungsdauer | „Unser Team kann erst im Q3 onboarden" / „Wir sind mitten in einer Migration" | Hoch: technische Blocker sind schwerer zu verhandeln |
| Autorität / Prozess | „Ich muss das mit der Rechtsabteilung / IT / dem CFO abstimmen" | Variabel: Single-Stakeholder vs. Multi-Stakeholder-Deal |
| Fit / Fähigkeitslücke | „Wir brauchen Feature X, das Sie nicht haben" | Hoch bei Core-Use-Case; niedrig bei Nice-to-Have |
| Status-quo-Trägheit | „Wir machen das bereits mit [bestehendem Tool]" / „Veränderung ist hier schwierig" | Hoch: Change-Management, nicht nur Produkt-Selling |
| Wettbewerber-Präferenz | „Wir schauen uns auch Gong / HubSpot / Salesforce an" | Mittel: hängt von Wettbewerbsposition ab |
| Integrations-Bedenken | „Wird das mit unserem aktuellen Stack funktionieren?" / „Wir laufen auf [Legacy-System]" | Variabel: oft durch Discovery lösbar |
Der Klassifizierungs-Schritt in Plattformen wie Gong (Smart Trackers), Chorus und Clari kann diese automatisch taggen, während Calls aufgezeichnet werden. Für Teams ohne Conversation-Intelligence-Plattform können Sie Batch-Klassifizierung auf Transkripten über die OpenAI- oder Anthropic-API mit einem Prompt durchführen, der Aussagen diesen Kategorien zuordnet.
Einwände mit Deal-Ergebnissen korrelieren
Häufigkeit allein sagt Ihnen nicht, was zu beheben ist. Sie benötigen Korrelation mit Abschlussraten.
Die nützlichste Ansicht ist ein 2x2: Einwände mit hoher vs. niedriger Häufigkeit, gekreuzt mit hoher vs. niedriger Deal-Verlust-Korrelation.
- Hohe Häufigkeit, hoher Deal-Verlust: Das sind Ihre dringendsten Probleme. Das Produkt, die Botschaft oder den Prozess beheben, der sie erzeugt.
- Hohe Häufigkeit, niedriger Deal-Verlust: Reps handhaben diese gut. Den Playbook dokumentieren und andere darin schulen.
- Niedrige Häufigkeit, hoher Deal-Verlust: Das sind die versteckten Killer. Sie tauchen nicht oft auf, aber wenn sie es tun, sterben Deals. Signalisiert normalerweise eine Fähigkeitslücke oder ein besonders sensibles Segment.
- Niedrige Häufigkeit, niedriger Deal-Verlust: Hintergrundrauschen. Keine Ressourcen hier einsetzen.
Einwände wegen der Implementierungsdauer tendieren für die meisten SaaS-Unternehmen in der Wachstumsphase in den ersten Quadranten. Sie tauchen ständig auf und korrelieren mit Verlusten, weil das Sales-Team entweder keine gute Antwort hat oder die richtigen Proof Points nicht aufgebaut hat (Referenzkunden mit schnellen Implementierungen, eine veröffentlichte Onboarding-Roadmap, einen dedizierten Success Manager für die ersten 60 Tage). Wenn Sie Large Language Models (LLMs) zur Klassifizierung von Einwänden nutzen, beachten Sie, dass Fehlklassifizierung ein echtes Risiko ist: Ein Modell, das „Implementierungsbedenken" als „Preis-Einwand" falsch etikettiert, korrumpiert die Analyse auf genau die Art, die Rep-gemeldete Daten unzuverlässig macht.
Eine sekundäre Metrik, die verfolgt werden sollte: welche Einwände mit früher Abwanderung (90-Tage-Kündigungen) korrelieren? Ein Käufer, der während des Sales-Zyklus einen Fit-Einwand geäußert und trotzdem abgeschlossen hat, ist ein hohes Churn-Risiko. Objection Mining surfaced das auch, weil Sie die Einwands-Aufzeichnungen abgeschlossener Deals gegen ihre Lifecycle-Daten kreuzen können.
Von Daten zu Maßnahmen
Der operative Wert von Objection Mining liegt nicht in einem Dashboard. Er liegt darin, was sich nach der Analyse ändert.
Battle Cards. Wenn Wettbewerber-Einwände zunehmen und der Wettbewerbs-Abschnitt Ihrer Battle Card immer noch dieselben drei Differenzierungsmerkmale von vor 18 Monaten beschreibt, haben Sie ein Problem. Objection Mining sagt Ihnen, welche spezifischen Wettbewerber-Aussagen in Calls auftauchen (Gong Smart Trackers können diese wortwörtlich surfacen), und das treibt ein konkretes Battle-Card-Update an, keine periodische Überprüfungsraten. Für mehr dazu siehe KI-generierte Wettbewerber-Battle-Cards.
Demo-Flow. Wenn Einwände wegen der Implementierungsdauer nach der Produkt-Demo zunehmen, ist das ein Signal, dass etwas in der Demo das Bedenken auslöst. Eine häufige Ursache: Die Demo zeigt komplexes Setup zu früh, bevor der Rep Vertrauen aufgebaut oder auf Ergebnisse verankert hat. Eine Neusequenzierung des Demo-Skripts reduziert die Einwands-Häufigkeit, was Sie dann mit einem weiteren Objection-Mining-Pass bestätigen.
E-Mail-Templates. Wenn 40% der zweiten Follow-up-E-Mails in Einwands-Sequences rund um Budget gehen, aber Ihre Sequence 80% ihrer Wörter für Features verwendet, gibt es einen Mismatch. Das Template aktualisieren, um Budget-Framing direkt anzusprechen, und Reply-Rate-Änderungen messen.
SDR-Discovery-Skripte. Einwands-Typen variieren signifikant nach Ideal Customer Profile (ICP)-Segment. Wenn Mid-Market-Deals Integrations-Bedenken doppelt so oft äußern wie Enterprise-Deals (weil Enterprise dedizierte IT-Ressourcen hat), sollte das Discovery-Skript für Mid-Market Sales Development Representatives (SDRs) früher Tech-Stack-Fragen surfacen. Die Einwands-Daten sagen Ihnen, wo Sie tiefer gehen müssen.
Training und Coaching. Der Coaching-Loop für einzelne Reps profitiert am meisten vom Quadranten mit niedriger Häufigkeit und hohem Deal-Verlust. Ein Rep, der in 6 Monaten keinen Deal trotz Integrations-Einwand abgeschlossen hat, hat kein Response-Template dafür. Objection Mining surfaced diese Lücke, bevor ein Live-Deal darunter leidet. Für ein vollständigeres Bild davon, wie Coaching diese Daten nutzt, siehe Reps coachen mit Conversation Intelligence.
Eine Objection-Mining-Session durchführen
Das ist ein praktischer Workflow für einen RevOps-Lead oder ein Sales-Enablement-Team. Einmal zur Basis-Etablierung ausführen, dann vierteljährlich.
Schritt 1: Datensatz ziehen. 90 bis 180 Tage Call-Transkripte exportieren. Sowohl gewonnene als auch verlorene Deals einbeziehen. Minimum 100 Calls (idealerweise 200+ für statistisch bedeutsame Aufschlüsselungen nach Segment).
Schritt 2: Extraktion durchführen. Wenn Sie Gong nutzen, haben Smart Trackers bereits viele Einwands-Momente kategorisiert. Diese exportieren. Wenn Sie mit rohen Transkripten arbeiten, einen Extraktions-Prompt über die Anthropic- oder OpenAI-API ausführen, der das Modell auffordert, Einwands-Aussagen zu identifizieren und zu zitieren, dann eine strukturierte Liste auszugeben.
Schritt 3: Nach Typ klassifizieren. Jede extrahierte Aussage der obigen Taxonomie zuordnen. Einige Plattformen erledigen das automatisch. Für rohen Output funktioniert ein zweiter Klassifizierungs-Prompt gut. 10% der Klassifizierungen auf Genauigkeit überprüfen.
Schritt 4: Mit Deal-Ergebnissen verbinden. Calls mit ihrem CRM-Datensatz verknüpfen (gewonnen/verloren, Deal-Größe, Time-to-Close, Churn-Datum falls zutreffend). Die meisten Conversation-Intelligence-Plattformen haben native CRM-Integrationen, die diesen Join automatisch machen.
Schritt 5: Häufigkeits-Korrelations-Tabelle erstellen. Welche Einwands-Typen tauchten am häufigsten auf? Welche korrelierten am stärksten mit Verlusten? Welche tauchten in Closed-Won-Deals auf, die später churned sind? Eine einfache Tabellenkalkulation ist dafür ausreichend. Das Ziel ist eine Rangliste, kein Business-Intelligence (BI)-Dashboard.
Schritt 6: 2 bis 3 operative Änderungen definieren. Basierend auf der Analyse die spezifischen Assets oder Workflows identifizieren, die aktualisiert werden sollen: eine Battle Card, einen Demo-Abschnitt, eine E-Mail-Sequence. Eigentümer und Timeline zuweisen. Ohne diesen Schritt wird die Analyse zu einem Foliendeck, das Verhalten nicht ändert.
Schritt 7: Messen und wiederholen. Nach 90 Tagen die Analyse erneut ausführen. Nach Bewegung in der Einwands-Häufigkeitsverteilung schauen. Wenn das Battle-Card-Update funktioniert, sollten Wettbewerber-Einwände weniger häufig auftauchen oder bei höheren Raten konvertieren.
Rework-Analyse: Der häufigste Fehler in Objection-Mining-Programmen ist das Aufhören bei der Häufigkeits-Tabelle. Teams führen die Analyse durch, sehen, dass Implementierungsdauer Einwand Nummer eins ist, und tun dann nichts, weil „wir wissen, dass Implementierung schwierig ist". Der Insight ist nur nützlich, wenn er eine spezifische Änderung antreibt: ein Rep-Response-Framework, eine Proof-of-fast-implementation-Case-Study zum Hinzufügen zum Deck, eine Revision der Demo, die die Setup-Screens verzögert, bis nach dem Value-Anker etabliert wurde. Wir verfolgen Objection-Programme daran, ob sie mindestens zwei operative Änderungen pro Quartal produzieren (Battle-Card-Update, Demo-Revision, E-Mail-Template-Änderung). Programme, die weniger als zwei Änderungen produzieren, werden nicht genutzt; sie werden berichtet.
Objection Mining als Produkt-Feedback-Mechanismus
Ein ungenutzter Ansatz: Einwands-Daten sind Produkt-Roadmap-Input. Bainsches Forschung zu Advanced Analytics im B2B-Verkauf zeigt, dass führende Unternehmen Test-und-Lern-Feedback-Loops mit Win/Loss-Daten aufbauen, um Messaging und Roadmap-Entscheidungen systematisch zu verbessern. Objection Mining ist genau dieser Feedback-Loop, der kontinuierlich aus Ihren Call-Aufzeichnungen läuft statt durch periodische analyst-geleitete Studien.
Fit-und-Fähigkeitslücken-Einwände, spezifisch, sagen Ihrem Produkt-Team genau, woran Enterprise-Deals scheitern. Wenn Integrations-Einwände nach einer Preistier-Änderung zunehmen, die den API-Zugang entfernte, lernt Ihr Produkt-Team etwas, das Finance und Sales möglicherweise nicht direkt kommunizieren.
Der Feedback-Loop hier ist Analyze (Sales-Calls) → Produkt-Team → Roadmap-Priorisierung. Das ist kein formaler Prozess in den meisten Unternehmen. Aber RevOps-Teams, die vierteljährliche Einwands-Berichte mit der Produkt-Leadership teilen, beeinflussen routinemäßig die Feature-Priorisierung auf eine Art, die nichts anderes im Sales-Prozess tut.
Fazit
Objection Mining macht den Unterschied zwischen einem Sales-Team, das anekdotisch vermutet, was sein Hauptproblem ist, und einem, das es weiß.
Die Intuition Ihrer Reps ist wertvoll, aber sie haben eine Stichprobengröße ihrer eigenen Calls und ihrer eigenen Gewinne. Ein Objection-Mining-Durchlauf über den vollständigen Call-Korpus hat eine Stichprobengröße der tatsächlichen Sales-Realität des Unternehmens. Beide sollten sich gegenseitig informieren.
Vierteljährlich durchführen. Mit Deal-Ergebnissen kreuzen. Es an Änderungen Ihrer Battle Cards, Ihrer Demo, Ihrer E-Mail-Sequences und Ihrer Discovery-Skripte antreiben lassen. Und nicht bei Coaching-Anwendungen aufhören. Die Ergebnisse mit Produkt und Marketing teilen, denn die Daten, die sie benötigen, um Messaging zu aktualisieren und Roadmap zu priorisieren, sitzen in Ihren Call-Aufzeichnungen.
Die Analyse ist nicht mehr der Engpass. Das Meeting-Intelligence-Pattern behandelt das. Der Engpass ist das Umwandeln von Erkenntnissen in operative Änderungen in weniger als 30 Tagen, bevor die Calls des nächsten Quartals beginnen, dieselben Einwände widerzuspiegeln.
Mehr erfahren
- Sales-Call-Aufzeichnung und Transkript-Analyse
- Reps coachen mit Conversation Intelligence
- Discovery-Question-Compliance mit KI-Überprüfung
- KI-generierte Wettbewerber-Battle-Cards
- Von Call zu CRM-Update automatisch
- Meeting Intelligence: Von Audio zu Aktionspunkten
- Analyze: Wie KI das Gesammelte versteht

Co-Founder, Rework.com