Failure-Modi: Wenn KI-Sales-Ops nach hinten losgeht
Turn this article into takeaways for your work.
Each assistant summarizes the article only for you and suggests best practices for your work.
Die KI-Sales-Ops-Deployments, die scheitern, sind meist keine technischen Fehler. Das Modell funktionierte gut. Die API-Aufrufe kamen rechtzeitig zurück. Die CRM-Integration hielt. Das Problem war organisatorisch: das Team vertraute dem System nicht, oder spielte damit, oder nutzte es falsch, oder ignorierte es einfach nach den ersten drei Wochen.
Das ist der Abschlussartikel der Sammlung. Er ist auch der wichtigste, wenn Sie kurz vor einer Kauf- oder Build-Entscheidung stehen. Denn wenn Sie wissen, was diese Systeme bricht, bevor Sie sie deployen, haben Sie eine vernünftige Chance, Ihre nicht zu brechen. Für die breiteren Muster-level-Failure-Modi über alle 10 KI-Muster sehen Sie Anti-Muster: KI-Kombinationen, die scheitern und Halluzinationsrisiko nach KI-Muster.
Sieben Failure-Modi. Jeder ist in echten Unternehmen passiert. Jeder ist vermeidbar.
Key Facts: KI-Sales-Ops-Deployment-Risiko in 2026
- 80,3 % der KI-Projekte scheitern daran, den beabsichtigten Business-Wert zu liefern, wobei 33,8 % vor der Production aufgegeben werden (RAND Corporation, 2025)
- 76 % der KI-Agent-Deployments erlebten kritische Fehler innerhalb der ersten 90 Tage über 847 verfolgte Implementierungen
- 70 % der Vertriebsteams berichten von aktivem Widerstand gegen KI-Adoption, und nur 20 % der Vertriebsmitarbeiter nutzen KI-Tools häufig oder täglich
Die 7 KI-Sales-Ops-Failure-Modi
Die sieben Failure-Modi unten sind das benannte Diagnose-Framework für KI-Sales-Ops-Deployments. Sie decken die gesamte Fehler-Oberfläche ab: menschlicher Widerstand (Modi 1 und 4), Daten-Gaming (Modi 2 und 6), Output-Qualitätskollaps (Modus 3), Modell-Verfall (Modus 5) und Governance-Overhead-Inversion (Modus 7). Jeder Modus hat einen bekannten Präventionspfad und einen bekannten Wiederherstellungspfad.
Failure-Modus 1: Rep-Aufstand
Symptom: Adoptionsrate unter 40 % nach 90 Tagen. Reps nutzen das Tool, wenn Manager zuschauen, nicht wenn sie es nicht tun.
Ursache: Der Rollout bezog Reps nicht in die Konfiguration ein, und das Tool wurde als Überwachung statt als Unterstützung gerahmt. Meeting Intelligence ist der häufigste Auslöser. Ein Rep, der erfährt, dass jeder Anruf aufgezeichnet wird und dass sein Manager ein KI-generiertes Performance-Dashboard erhält, hat sich dafür nicht angemeldet. Und wenn niemand ihn davor gefragt hat, ist die Verärgerung sofort.
Ein Unternehmen rollte Gong an ein 35-Rep-Team in 2024 aus, ohne ein Vorab-Gespräch darüber, welche Daten Manager würden und nicht überprüfen werden. Innerhalb von sechs Wochen planten 12 Reps ihre Anrufe auf persönlichen Telefonen außerhalb des Systems. Acht reichten Beschwerden bei der HR über Überwachung ein. Der Rollout wurde pausiert. Vier Monate Abonnementkosten verschwendet, plus die Implementierungsarbeit.
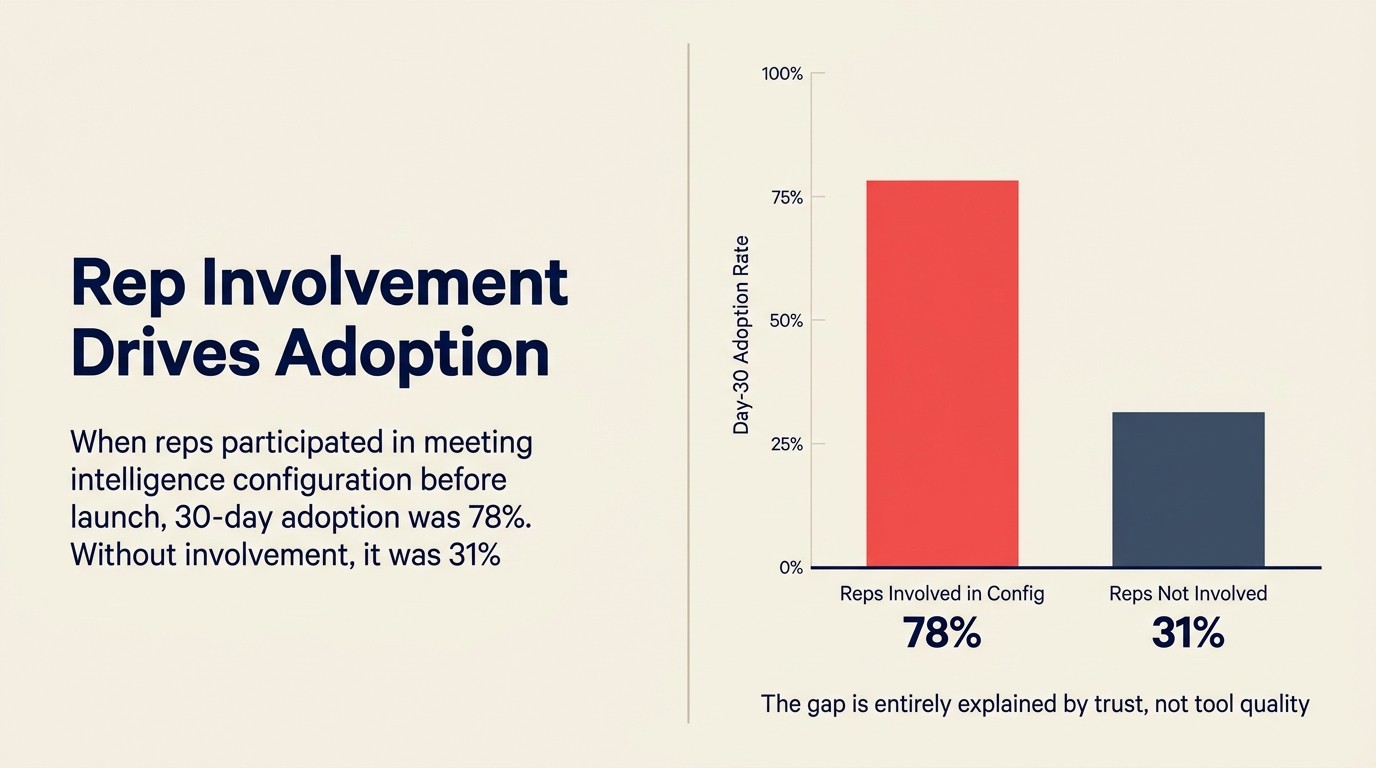
Zahlen: Interne Nutzungsdaten von einem Mid-Market-SaaS-RevOps-Team, geteilt bei einem SaaStr-Panel 2025: Wenn Reps an Meeting-Intelligence-Konfigurationsentscheidungen beteiligt wurden (welche Felder auto-befüllt werden, welche Call-Clips Manager zugreifen könnten, wie Coaching-Feedback zugestellt werden würde), betrug die 30-Tage-Adoption 78 %. Wenn Reps nicht beteiligt waren, betrug die 30-Tage-Adoption 31 %. Der Stanford-HAI-KI-Index 2025 stellt konsistent fest, dass organisatorische Bereitschaft und Stakeholder-Vertrauen, nicht die Modellperformance, die Faktoren sind, die erfolgreiche Enterprise-KI-Deployments von gescheiterten trennen.
Prävention: Führen Sie 2 Wochen vor dem Launch eine Sitzung mit einer Rep-Stichprobengruppe durch. Lassen Sie sie das Tool sehen, fragen Sie, was sie sich davon wünschen würden, und bringen Sie ihre Bedenken an die Oberfläche. Machen Sie spezifische Zusagen: "Aufzeichnungen werden für Coaching verwendet, nicht für Leistungsbeurteilungen," und halten Sie sie dann ein. Reps, die wegen Überwachung besorgt sind, werden zu Befürwortern, wenn sie das Gefühl haben, dass das System zu ihrem Vorteil und nicht gegen sie gestaltet ist.
Wiederherstellung: Wenn die Adoption bereits zusammengebrochen ist, drängen Sie nicht. Pausieren Sie, erkennen Sie das Problem an und starten Sie den Rep-Co-Design-Prozess, der vor dem Launch hätte stattfinden sollen. Ein Re-Launch, der als "wir haben Ihre Bedenken gehört und diese Änderungen vorgenommen" gerahmt ist, stellt Vertrauen schneller wieder her als jeder andere Ansatz.
Zitierbarer Kernpunkt: Wenn Reps an Meeting-Intelligence-Konfigurationsentscheidungen vor dem Launch beteiligt werden, erreicht die 30-Tage-Adoption 78 %. Wenn sie nicht beteiligt sind, fällt sie auf 31 %. Diese Lücke wird vollständig durch Vertrauen erklärt, nicht durch die Qualität des Tools. (Interne Nutzungsdaten, Mid-Market-SaaS-RevOps-Team, SaaStr-Panel 2025)
Failure-Modus 2: Lead-Scores werden gespielt
Symptom: Lead-Scores steigen in 3-6 Monaten über das Board, während die Abschlussraten gleich bleiben oder sinken.
Ursache: Reps lernten, welche Eingaben hohe Scores antreiben, und begannen, diese Eingaben manuell zu optimieren. Wenn das Scoring-Modell "Unternehmensgröße" stark gewichtet und Reps die Unternehmensgröße in Kontaktdatensätzen bearbeiten können, erwarten Sie Inflation. Wenn "Website-Besuche" mit dem Score korreliert und Reps Website-Besuche auslösen können, indem sie einen Link per E-Mail senden, erwarten Sie, dass das Link-Senden zum Sport wird.
Das ist das Goodhart's-Law-Problem, das auf Lead-Scoring angewendet wird: Sobald ein Maß zu einem Ziel wird, hört es auf, ein gutes Maß zu sein. Reps tun das nicht aus Bosheit. Sie tun es, weil sie mehr gute Leads wollen, und sie haben den Hebel entdeckt. Der Artikel zu häufigen KI-Lead-Scoring-Fallstricken behandelt das und andere Scoring-and-Routing-Failure-Muster ausführlich.
Ein B2B-SaaS-Unternehmen, das ein intern gebautes Scoring-Modell betreibt, sah, wie die durchschnittlichen Lead-Scores von einem Mittelwert von 62 auf 79 über 8 Monate drifteten. Die Abschlussraten sanken von 22 % auf 14 % bei "hoch-bewerteten" Leads im selben Zeitraum. Als sie die Daten auditierten, hatten 40 % der hoch-bewerteten Leads Unternehmensgrößen-Felder, die in den 30 Tagen vor der Bewertung manuell bearbeitet worden waren.
Prävention: Lassen Sie Reps die Felder nicht bearbeiten, die im Scoring-Modell am stärksten gewichtet sind. Verwenden Sie system-befüllte Felder (von Ihrem Datenanbieter, aus Produktnutzungs-Logs, aus Website-Analytik) für Scoring-Eingaben, nicht rep-bearbeitbare CRM-Felder. Wenn Sie rep-bearbeitbare Felder verwenden müssen, fügen Sie ein "Zuletzt bearbeitet von"-Audit-Log ein, damit Scoring-Anomalien sichtbar sind.
Wiederherstellung: Auditieren Sie Ihre Scoring-Feature-Gewichte gegen Ihre tatsächlichen Konversionsdaten. Wenn hoch-bewertete Leads nicht zu höheren Raten konvertieren als mittel-bewertete, wurden die Scores gespielt oder das Modell ist gedriftet. Trainieren Sie mit Quelldaten neu, die Reps nicht direkt bearbeiten können, und verschärfen Sie die Feld-Bearbeitungsberechtigungen.
Zitierbarer Kernpunkt: Goodharts Gesetz ist das am meisten unterschätzte Risiko in KI-Scoring-Deployments. In dem Moment, in dem ein Lead-Score zu einer Quota-Eingabe wird, optimieren Reps für den Score, nicht für die Pipeline-Qualität. Die Lösung ist die Verwendung system-befüllter Eingaben, die Reps nicht anfassen können, nicht mehr Modell-Neutraining.
Failure-Modus 3: Auto-erstellte E-Mails klingen nach Corporate-KI
Symptom: E-Mail-Antwortquoten fallen nach dem Rollout von KI-unterstütztem E-Mail-Entwurf. Die absoluteste Form dieses Fehlers: ein Rep sendet eine KI-erstellte E-Mail an einen langjährigen Beziehungs-Interessenten, der antwortet: "Das klingt nicht wie Sie. Ist alles in Ordnung?"
Ursache: Off-the-shelf-E-Mail-Entwurfs-Tools, die auf generischen Vertriebs-E-Mail-Korpora trainiert wurden, produzieren generische Vertriebs-E-Mails. Sie sind grammatikalisch korrekt. Sie verwenden vernünftige Struktur. Und sie klingen genau wie jede andere KI-generierte Kalt-E-Mail, die dieselbe Inbox trifft.
Die spezifischen Muster, die Antwortquoten töten:
- Eröffnungen, die auf "die aktuelle Landschaft von [Branche]" oder "in der heutigen schnelllebigen Umgebung" verweisen
- Sätze, die mit "Ich wollte mich melden" beginnen (jede KI schreibt das)
- Value-Proposition-Absätze, die Features als Aufzählungen auflisten ("Mit unserer Plattform können Sie: [Liste der Dinge]")
- CTAs, die sagen "Wären Sie offen für einen kurzen 15-minütigen Anruf?" (der universelle KI-Abschluss)
KI-generierter personalisierter Outreach in großem Maßstab behandelt den research-begründeten Ansatz, der diese Muster vermeidet.
Ein Vertriebsteam bei einem 200-Rep-SaaS-Unternehmen verfolgte Antwortquoten vor und nach dem KI-E-Mail-Rollout. Vorher: 8,2 % Antwortquote auf First-Touch-Outreach. Nach 60 Tagen KI-Entwurf mit Rep-Review: 6,1 %. Nach 90 Tagen: 5,4 %. Die Reps bearbeiteten die KI-Entwürfe leicht, schrieben sie aber nicht grundlegend neu. Die KI-Stimme hatte die Rep-Stimme ersetzt.
Prävention: Verwenden Sie KI-E-Mail-Entwurf nicht als Abkürzung zum Schreiben. Verwenden Sie es als Ausgangspunkt, den Reps wirklich neu schreiben. Der Wert liegt nicht im Entwurf; er liegt in der Struktur und den Personalisierungs-Dateneingaben. Bauen Sie ein einfaches Qualitätsniveau: Jede KI-erstellte E-Mail, die noch den Satz "Ich wollte mich melden" enthält oder irgendeinen Satz, der mit "Ich hoffe, diese Nachricht erreicht Sie gut" beginnt, wird nicht gesendet.
Schulen Sie Reps darin, wie KI-generierte Muster aussehen und warum Interessenten sie erkennen. Ein Rep, der versteht, warum der KI-Entwurf nach KI klingt, wird ihn mit viel höherer Wahrscheinlichkeit beheben als ein Rep, der nur denkt, er klingt gut.
Wiederherstellung: Wenn Antwortquoten gesunken sind, ziehen Sie eine Stichprobe gesendeter KI-erstellter E-Mails. Lesen Sie sie laut vor. Wenn sich irgendeiner davon wie eine Pressemitteilung und nicht wie ein Mensch anfühlt, der mit einem anderen spricht, haben Sie das Problem gefunden. Führen Sie einen Split-Test durch: KI-erstellte vs. Rep-geschriebene von Grund auf, dieselben Leads, dieselbe Woche. Die Lücke sagt Ihnen, wie viel die KI-Stimme schadet.
Zitierbarer Kernpunkt: Ein 200-Rep-SaaS-Team verfolgte Antwortquoten vor und nach dem KI-E-Mail-Rollout: 8,2 % vorher, 5,4 % nach 90 Tagen. Die Reps übersprangen die Überprüfung nicht. Sie bearbeiteten KI-Entwürfe leicht und sendeten sie. Die KI-Stimme hatte die Rep-Stimme ersetzt, ohne dass es jemand bemerkt hatte.
Failure-Modus 4: Coaching-Dashboards erzeugen Rep-Angst und Fluktrations-Risiko
Symptom: Freiwillige Fluktuation steigt unter Mid-Tier-Reps in den 6-12 Monaten nach dem Meeting-Intelligence-Rollout. Exit-Interview-Themen konzentrieren sich auf "das Gefühl des Micro-Managements" oder "immer beobachtet zu werden".
Ursache: KI-Coaching-Dashboards bringen individuelle Rep-Metriken auf eine Granularität, die sich bedrohlich statt entwicklungsfördernd anfühlt. Talk-Time-Verhältnis. Fragen-Anzahl pro Anruf. Anzahl der behandelten Wettbewerber-Erwähnungen. Monolog-Länge. Diese Metriken sollen Reps helfen, sich zu verbessern. Wenn sie auf einem Manager-sichtbaren Dashboard mit Rankings angezeigt werden, fungieren sie als Leistungsdruck-System.
Mid-Tier-Reps (50. bis 75. Perzentil-Performer) sind am verwundbarsten. Top-Performer fühlen sich zuversichtlich in ihren Zahlen. Bottom-Performer wissen bereits, dass sie kämpfen. Mid-Tier-Reps sehen Metriken, die zeigen, dass sie nicht an der Spitze sind, und internalisieren das als "Ich scheitere." Wenn die Daten immer eingeschaltet und immer sichtbar sind, lässt der Druck zwischen Coaching-Gesprächen nicht nach.
Das ist real. Eine 2025-Umfrage von 200 B2B-Vertriebsprofis durch die Sales Management Association ergab, dass 34 % der Reps bei Unternehmen, die KI-Coaching-Tools verwenden, deutlich höheren Job-Stress als vor dem Rollout berichteten. Von diesen sagten 41 %, dass sie innerhalb von 6 Monaten nach dem Rollout begonnen hatten, für andere Stellen zu interviewen.
Prävention: Trennen Sie die Coaching-Metriken von den Performance-Metriken in rep-sichtbaren Dashboards. Reps sollten ihre eigenen Coaching-Daten und Trends sehen. Sie sollten kein Ranking sehen, das sie täglich auf jeder Metrik mit Kollegen vergleicht. Das Coaching-Dashboard ist ein Entwicklungs-Tool, kein Scoreboard.
Gestalten Sie den Coaching-Workflow rund um Gespräche, nicht Dashboards. Die Aufgabe des Managers ist es, eine Metrik pro Rep pro Woche auszuwählen, die Daten zu zeigen und zu besprechen, was sie antreibt. Nicht das vollständige Dashboard zu teilen und Reps ihre eigenen Schlussfolgerungen ziehen zu lassen.
Wiederherstellung: Wenn Fluktrations-Risiko-Indikatoren gestiegen sind, auditieren Sie, wie Manager die Coaching-Daten tatsächlich verwenden. Das Problem ist fast nie die Technologie. Es ist ein Manager, der KI-Metriken als Leistungswaffe statt als Coaching-Tool verwendet. Manager darin zu schulen, wie KI-Daten als Entwicklungs-Tool verwendet werden, ist wichtiger als jede Dashboard-Konfigurationsänderung.
Failure-Modus 5: Forecasting-Modelle überfitten an aktuelle Quartale
Symptom: Forecast-Genauigkeit ist 2-3 Quartale nach dem Modell-Training stark, beginnt dann zu degradieren. Die Genauigkeit sinkt scharf, wenn sich die Marktbedingungen verschieben (neuer Wettbewerber tritt ein, Preisänderung, makro-wirtschaftlicher Gegenwind).
Ursache: KI-Forecasting-Modelle lernen aus historischen Deal-Mustern. Sie sind sehr gut darin, Ergebnisse vorherzusagen, die wie vergangene Ergebnisse aussehen. Wenn sich die Umgebung erheblich verändert (andere Kaufkomitee-Dynamiken, neuer Wettbewerbsdruck, konjunkturelle Verlangsamung, die diskretionäre Ausgaben reduziert), beschreibt die Trainingsdaten des Modells nicht mehr die aktuelle Umgebung. Das Modell weiß nicht, dass es eine Regimewechsel gibt; es macht weiterhin Vorhersagen, als ob die Vergangenheit noch die Gegenwart wäre.
Ein konkretes Beispiel: ein Mid-Market-SaaS-Unternehmen trainierte ihr Clari-Forecasting-Modell in Q3 2024 an 18 Monaten Deal-Daten aus einem wachstumsorientierten Markt. McKinseys State-of-AI-Forschung berichtet, dass weniger als 20 % der Organisationen ihre KI-Modelle systematisch auf Performance-Drift nach dem Deployment überwachen, was erklärt, warum Regression durch Regimewechsel unentdeckt bleibt, bis ein Quartalsende-Fehler das Problem erzwingt. Das Modell lernte, dass Deals mit Multi-threaded-Engagement (3+ Kontakte aktiv in den letzten 30 Tagen) eine 72-prozentige Abschlussrate in der Proposal-Phase hatten. In Q2 2025, als sich die wirtschaftlichen Bedingungen verschärften, begannen Kaufkomitees selbst mit engagierten Kontakten zu verlangsamen. Multi-threaded-Deals in der Proposal-Phase schlossen bei 51 %. Das Modell sagte weiterhin 72 % voraus. Die Prognose war zwei Quartale lang 28 % über dem Tatsächlichen, bevor jemand den Drift bemerkte.
Prävention: Legen Sie eine Modellgenauigkeits-Monitoring-Kadenz vor dem Deployment fest. Monatlicher Vergleich der vorhergesagten Abschlussraten vs. tatsächlicher für die Deals des Vormonats. Wenn die vorhergesagte-vs.-tatsächliche-Lücke in aufeinanderfolgenden Monaten um mehr als 10 Prozentpunkte wächst, Flag für Neutraining-Review. Warten Sie nicht auf den Quartalsende-Fehler. Wenn KI-Muster zu technischen Schulden werden behandelt das Modell-Drift-Problem auf Muster-Ebene, einschließlich wie man erkennt, wenn ein Modell über die Neukalibrierung hinaus gedriftet ist.
Fügen Sie ein "Regimewechsel-Protokoll" in Ihre Governance-Dokumentation ein. Wenn ein wichtiges Marktereignis stattfindet (neuer Wettbewerber, Preisänderung, Makro-Verschiebung), lösen Sie eine außerzyklische Genauigkeits-Review aus. Menschliches Forecasting-Urteilsvermögen sollte nach einem Regimewechsel explizit gegen die Modell-Ausgabe gewichtet werden, nicht als überschreibendes Rauschen behandelt.
Wiederherstellung: Trainieren Sie mit den neuesten 6-9 Monaten Daten neu, wobei neuere Daten stärker als ältere gewichtet werden. Besprechen Sie explizit, was sich am Markt verändert hat, mit Ihrem CS/Vertriebsteam, und identifizieren Sie, welche historischen Muster nicht mehr repräsentativ sind.
Zitierbarer Kernpunkt: 32 % der Production-Scoring-Pipelines erleben distributionelle Verschiebungen innerhalb der ersten sechs Monate des Deployments. Modelle ohne aktives Genauigkeits-Monitoring zeigen in 18 Monaten eine Degradierung von 14-19 %, verglichen mit innerhalb von 2,4 % der anfänglichen Performance für Teams, die monatliche Genauigkeits-Reviews durchführen. (IBM/Superwise AI, 2025)
Failure-Modus 6: Routing-Modelle zementieren alte ICP-Biases
Symptom: Ihr KI-Lead-Scoring und Routing priorisiert konsistent ein enges Segment von Leads. Andere Segmente (neue Verticals, in die Sie expandieren, kleinere Unternehmen, die starke PLG-Fits sein könnten, internationale Accounts) werden selten bearbeitet und schließen selten ab. Sie erkennen schließlich: die KI hat sie systematisch herausgefiltert.
Ursache: Scoring-Modelle, die auf historischen Win-Daten trainiert wurden, lernen, welche Leads wie vergangene Wins aussehen. Wenn Ihre vergangenen Wins in einem Segment konzentriert waren (sagen wir, US-basierte SaaS-Unternehmen zwischen 100-500 Mitarbeitern, VP und darüber), lernt das Modell dieses Profil als "hoher Score" für Ihr ICP. Leads aus neuen ICP-Segmenten, die Sie aktiv ansprechen, stimmen nicht mit dem historischen Muster überein und bekommen einen niedrigen Score. Sie werden zu Nurture geleitet. Sie schließen nicht ab, nicht weil sie schlechte Leads sind, sondern weil sie nie bearbeitet wurden. Das Modell interpretiert das als Bestätigung, dass das neue Segment von geringer Qualität ist.
Das ist eine Feedback-Schleife, die sich zusammensetzt. Das Scoring-Modell deprioritisiert Neue-Segment-Leads. Reps bearbeiten sie nicht. Sie schließen nicht ab. Das Modell sieht niedrige Abschlussraten von diesem Segment. Die Scores werden niedriger. Das neue Segment wird effektiv aus der Pipeline durch ein Modell ausgesperrt, das nie aktualisiert wurde, um die aktuelle Strategie widerzuspiegeln.
Ein Unternehmen verbrachte 6 Monate damit, in Mid-Market-Manufacturing (ein neues Vertical) mit einer GTM-Motion einzubrechen, die die Einstellung eines dedizierten Vertical-Reps umfasste. Der Rep beklagte, dass die Leads, die er bekam, von schlechter Qualität seien. Ein Audit enthüllte, dass seine Leads konsistent im 30-45-Bereich bewerteten, weil das Scoring-Modell nie ein Manufacturing-Unternehmen hatte abschließen sehen. Sie wurde systematisch durch das Modell benachteiligt. Das Scoring-and-Routing-Muster erklärt, wie der Umfang der Trainingsdaten bestimmt, welche Segmente das Modell zuverlässig bewerten kann.
Prävention: Wenn Sie ein neues ICP-Segment hinzufügen, überschreiben Sie das Scoring für dieses Segment explizit, bis Sie 50-100 Deals in dem Segment zum Trainieren haben. Erstellen Sie eine Segment-Bypass-Regel: "Leads, die [neue ICP-Kriterien] entsprechen, erhalten manuelles Review-Routing unabhängig vom Score."
Führen Sie ein vierteljährliches Segment-Diversitäts-Audit Ihrer bewerteten Lead-Population durch. Wenn ein Segment konsistent 80 %+ der hoch-bewerteten Leads repräsentiert und Sie strategische Expansionsziele außerhalb dieses Segments haben, benötigt das Modell Segment-level-Kalibrierung.
Wiederherstellung: Trainieren Sie das Modell mit segment-stratifiziertem Sampling neu. Stellen Sie sicher, dass der Trainings-Set genug Beispiele aus unterrepräsentierten Segmenten enthält, um dem Modell ein faires Signal zu geben. Bis das Neutraining abgeschlossen ist, leiten Sie unterrepräsentierte Segmente manuell weiter.
Failure-Modus 7: Audit-Overhead übersteigt Einsparungen für kleine Teams
Symptom: Das RevOps-Team verbringt mehr Zeit mit der Verwaltung der KI-Governance, der Überprüfung von KI-Entscheidungen und der Reaktion auf Rep-Streitigkeiten als die KI an Rep-Zeit einspart. Das Tool ist netto-negativ für die operative Effizienz.
Ursache: Enterprise-Grade-Governance-Frameworks auf kleine Team-KI-Deployments angewendet. Ein 10-Rep-Vertriebsteam, das ein Lead-Scoring-Modell betreibt, benötigt kein Modell-Governance-Komitee, vierteljährliche Genauigkeits-Reviews und einen strukturierten Routing-Streit-Prozess mit 48-Stunden-SLAs. Aber wenn ihr RevOps-Lead einen Enterprise-KI-Governance-Leitfaden gelesen und das vollständige Framework implementiert hat, haben sie administrativen Overhead geschaffen, der bei ihrer Teamgröße schlecht skaliert.
Die spezifischste Version davon, die am häufigsten ist: Meeting Intelligence bei 8-12 Reps, mit einem vollständigen Protokoll-Review-Workflow, Coaching-Dashboard-Analyse-Kadenz und KI-generiertem Pipeline-Briefing-Review-Prozess darüber geschichtet. Jede Komponente ist für sich genommen vertretbar. Zusammen können sie dem RevOps-Overhead 4-6 Stunden pro Woche für ein Team hinzufügen, das eine Sales-Ops-Person hat.
Wenn diese Person 2 Stunden pro Woche an Rep-Zeit über das Team hinweg einsparte, haben sie einen Netto-Verlust geschaffen.
Prävention: Passen Sie Governance dem tatsächlichen Risiko und der Größe an. Ein Startup-Governance-Modell (2-3 Regeln, Log in einer Tabellenkalkulation, monatliche 30-minütige Review) ist das richtige Level für ein Sub-20-Rep-Team. Vollständige Audit-Trail-Infrastruktur, Modell-Governance-Komitees und automatisierte Compliance-Dashboards gehören zur 100+-Rep-Skala mit einem dedizierten RevOps-Team.
Fragen Sie vor dem Hinzufügen einer Governance-Anforderung: Was ist der schlimmste Fall, wenn das scheitert? Wenn die Antwort "ein Rep bestreitet eine Routing-Entscheidung einmal im Quartal" ist, behandelt ein Tabellenkalkulations-Log und ein klarer Streitpfad das. Wenn die Antwort "wir verletzen die DSGVO und werden mit einer Geldstrafe belegt" ist, bauen Sie die richtige Infrastruktur. Das NIST-KI-Risikomanagement-Framework bietet eine abgestufte Governance-Struktur, die direkt auf den Deployment-Maßstab mappt, was die richtige Vorlage ist, um Governance-Aufwand dem tatsächlichen Risikoniveau zu kalibrieren.
Wiederherstellung: Auditieren Sie Ihren Governance-Overhead ehrlich. Wenn ein einzelner Governance-Prozess für ein Sub-50-Rep-Team mehr als 30 Minuten pro Woche benötigt, ist er wahrscheinlich zu engineered. Vereinfachen. Das Ziel ist nicht Governance um ihrer selbst willen; es ist Governance, die echte Probleme abfängt, ohne mehr Last zu schaffen als die KI einspart.
Zitierbarer Kernpunkt: Governance-Frameworks, die für 100-Rep-Enterprise-Teams entworfen wurden, erzeugen 4-6 Stunden pro Woche an RevOps-Overhead, wenn sie auf 8-12-Rep-Teams angewendet werden. In diesem Maßstab übersteigen die Governance-Kosten die KI-Zeiteinsparungen, die sie schützen sollen. Passen Sie Governance dem tatsächlichen Risiko und der Teamgröße an, nicht der Sophistication der Compliance-Dokumentation Ihres Anbieters.
Failure-Modus-Risiko-Zusammenfassung
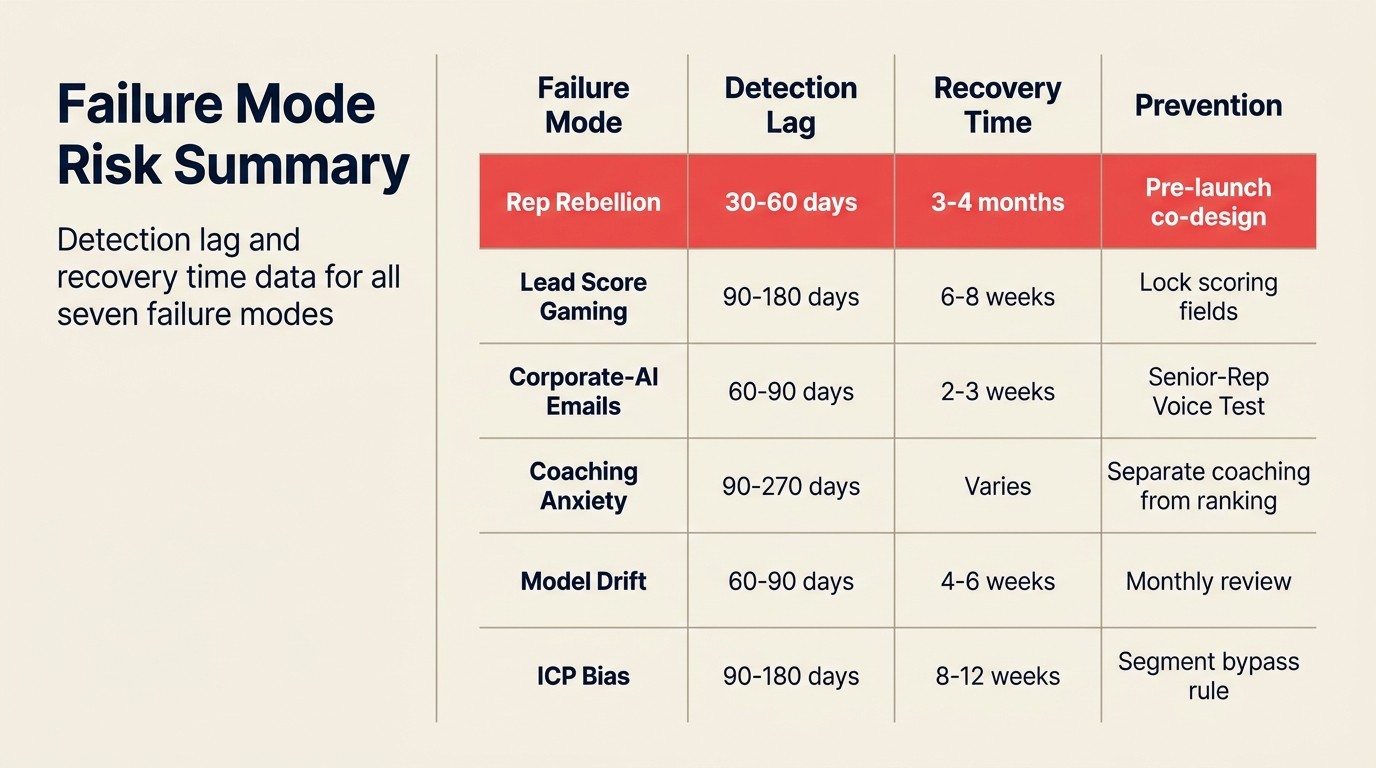
Die sieben Failure-Modi sind nicht gleich wahrscheinlich oder gleich kostspielig. Diese Tabelle kartiert jeden Modus auf sein häufigstes Auslösermuster, die Erkennungsverzögerung und die typische Wiederherstellungszeit, damit Sie vor dem Launch Investitionen priorisieren können.
| Failure-Modus | Primärer Auslöser | Typische Erkennungsverzögerung | Wiederherstellungszeit | Effektivste Prävention |
|---|---|---|---|---|
| Rep-Aufstand | Rollout ohne Rep-Beteiligung | 30-60 Tage | 3-4 Monate | Vorab-Launch-Co-Design-Sitzung |
| Lead-Score-Gaming | Rep-bearbeitbare Scoring-Eingaben | 90-180 Tage | 6-8 Wochen (Neutraining) | Scoring-Felder beim Launch sperren |
| Corporate-KI-E-Mails | Oberflächliche Rep-Review von Entwürfen | 60-90 Tage | 2-3 Wochen (Coaching) | Senior-Rep-Stimmen-Test vor dem Senden |
| Coaching-Angst / Fluktrations-Risiko | Rankings für alle Reps sichtbar | 90-270 Tage | Variiert; einige Reps kehren nicht zurück | Coaching von Ranking-Daten trennen |
| Modell-Drift (Forecasting) | Markt-Regimewechsel | 60-90 Tage | 4-6 Wochen (Neutraining) | Monatliche vorhergesagte-vs.-tatsächliche-Review |
| ICP-Bias / Segment-Aussperrung | Neues Vertical ohne Override-Regeln | 90-180 Tage | 8-12 Wochen (Neutraining + Audit) | Segment-Bypass-Regel beim Launch |
| Governance-Overhead-Inversion | Enterprise-Framework bei SMB-Skala | 30-90 Tage | 1-2 Wochen (vereinfachen) | Governance der Teamgröße anpassen |
Quellen: RAND Corporation, Sales Management Association, IBM, interne RevOps-Team-Daten (2025)
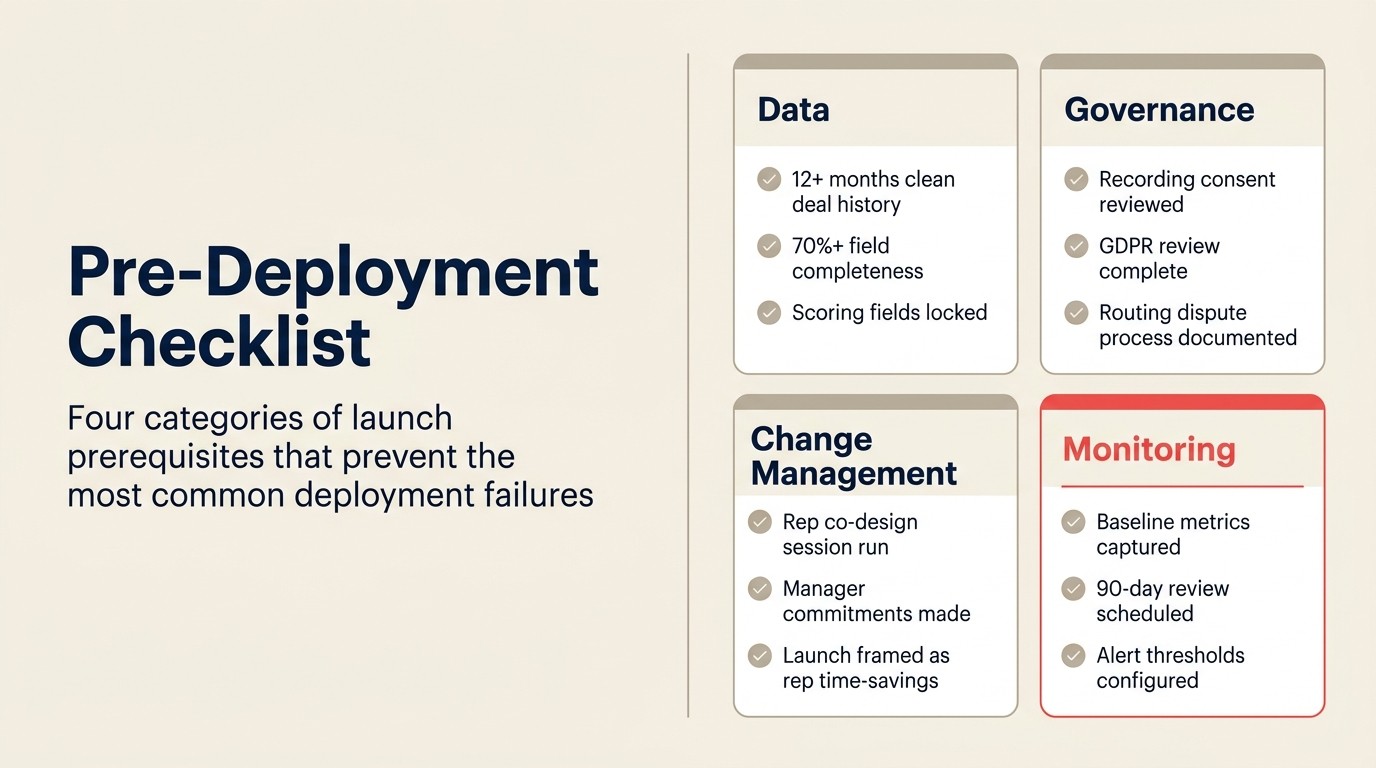
Pre-Deployment-Checkliste
Bevor Sie live gehen mit irgendeinem KI-Sales-Ops-Muster, prüfen Sie folgendes:
Daten:
- 12+ Monate saubere Deal-Historie mit konsistenten Won/Lost-Labels
- 70 %+ Vollständigkeit bei Kern-Kontaktfeldern (Unternehmen, Titel, Branche)
- Rep-bearbeitbare Felder für Scoring-Modell-Eingaben gesperrt
- Phasenfortschritts-Anomalien auditiert und behoben
Governance:
- Recording-Zustimmungssprache von Legal überprüft
- DSGVO/Datenschutz-Review für Scoring-Anwendungsfall abgeschlossen
- Routing-Streit-Prozess dokumentiert und kommuniziert
- Audit-Log-Schema definiert und konfiguriert
- Modell-Versions-Tracking eingerichtet vor dem Modell-Deployment
Change Management:
- Rep-Stichprobengruppe in Konfigurationsentscheidungen einbezogen
- Spezifische Zusagen darüber gemacht, welche Daten Manager verwenden und nicht verwenden werden
- Launch als Zeitersparnis für Reps gerahmt, nicht als Überwachung für Manager
- 30-Tage-Adoptionsplan (wer ist für Rep-Adoption verantwortlich, wie wird sie gemessen)
- Manager-Schulung zur Verwendung von KI-Coaching-Daten als Entwicklungs-Tool
Monitoring:
- Baseline-Metriken vor dem Launch erfasst (Antwortquoten, Routing-Geschwindigkeit, CRM-Vollständigkeitsrate)
- 30-Tage- und 90-Tage-Adoptions-Review im Kalender geplant
- Modellgenauigkeits-Monitoring-Kadenz definiert (monatlicher Vergleich)
- Alert-Schwellenwerte für Anomalie-Muster konfiguriert (Score-Inflation, Routing-Streit-Volumen)
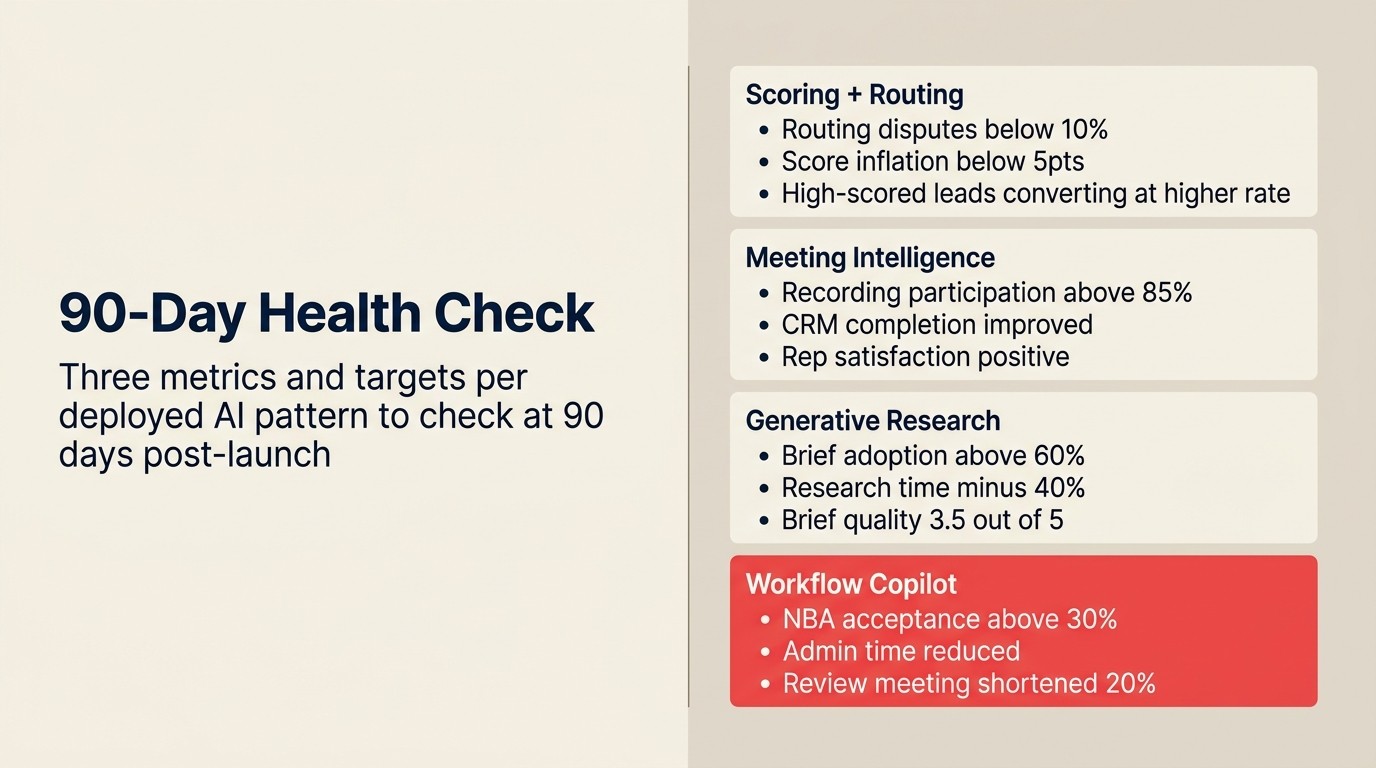
90-Tage-Gesundheitscheck-Framework
Bei 90 Tagen nach dem Launch überprüfen Sie diese Metriken für jedes deployete Muster:
Scoring and Routing:
- Routing-Genauigkeit: welcher % der gerouteten Leads wird bestritten oder manuell neu zugewiesen? (Ziel: unter 10 %)
- Score-Inflation: hat sich der durchschnittliche Lead-Score um mehr als 5 Punkte von der Baseline bewegt? (Flag wenn ja)
- Abschlussraten-Korrelation: schließen hoch-bewertete Leads zu einer höheren Rate als niedrig-bewertete ab? (Wenn nicht, kann das Modell gespielt werden oder driften)
Meeting Intelligence:
- Aufzeichnungs-Teilnahmequote: welcher % der Ziel-Anrufe wird aufgezeichnet? (Ziel: über 85 %)
- CRM-Vollständigkeitsraten-Verbesserung: hat KI-Auto-Write den % der Anrufe mit vollständigen CRM-Notizen verbessert?
- Rep-Zufriedenheits-Pulse: Eine-Fragen-Umfrage an Reps: "Macht Meeting Intelligence Ihren Job einfacher oder schwieriger?" (Netto-Score sollte bis 90 Tagen positiv sein)
Generative Research:
- Research-Brief-Adoption: welcher % der neuen Account-Berührungen enthält ein KI-generiertes Briefing? (Ziel: über 60 %)
- Vor-Anruf-Research-Zeit: bei 90 Tagen vs. Baseline gemessen (Ziel: 40 %+ Reduzierung)
- Brief-Qualitäts-Selbsteinschätzung: Rep-Bewertung der Brief-Qualität (1-5-Skala; Ziel über 3,5)
Workflow Copilot:
- NBA-Akzeptanzrate: welcher % der vorgeschlagenen nächsten Aktionen werden ausgeführt? (Ziel: über 30 %)
- Admin-Zeitreduzierung: gemessene Rep-Zeit bei CRM-Dateneingabe vs. Vor-KI-Baseline
- Pipeline-Review-Meeting-Länge: vor und nach dem KI-Briefing-Rollout (Ziel: 20 %+ Reduzierung)
Rework-Analyse: Über die sieben Failure-Modi hinweg haben fünf eine gemeinsame Wurzel: das Deployment wurde als Technologie-Projekt, nicht als Change-Management-Projekt gestaltet. Modi 1, 3, 4, 6 und 7 beinhalten alle menschliches Verhalten und Team-Design-Entscheidungen, die nach der Anbieterauswahl getroffen wurden, nicht davor. Modus 2 (Gaming) und Modus 5 (Drift) sind die zwei wirklich technischen Failure-Modi, und beide haben bekannte Präventionsprotokolle. Die Teams, die diese Fehler vermeiden, machen typischerweise eine Sache anders: Sie definieren Erfolgsmetriken vor dem Deployment, nicht nach der ersten 30-Tage-Review. Reworks Pre-Launch-Governance-Template beinhaltet Baseline-Metrik-Erfassung als erforderlichen Schritt in Phase 0, weshalb Teams, die es verwenden, Mode-2- und Mode-5-Fehler im Durchschnitt 6-8 Wochen früher erkennen als Teams, die die Überwachung erst nach dem Launch beginnen.
Das ehrliche Fazit
Keiner dieser Failure-Modi ist einzigartig für KI. Reps, die einem Tool nicht vertrauen, verwenden es nicht. Systeme, die qualitativ schlechte Ausgaben produzieren, werden ignoriert. Governance-Prozesse, die mehr Arbeit schaffen als sie einsparen, werden aufgegeben. Das sind Implementierungsprobleme, die so alt sind wie Enterprise-Software.
Was KI hinzufügt, ist Skalierung und Geschwindigkeit. Ein KI-Modell, das driftet oder voreingenommen ist, trifft schlechte Entscheidungen über jeden Lead in der Pipeline, nicht nur über die, die ein Mensch falsch kategorisiert hätte. Ein KI-Coaching-Dashboard, das Rep-Angst erzeugt, erzeugt sie gleichzeitig für jeden Rep im Team. Die Failure-Modi sind dieselben; der Schadenradius ist größer.
Deshalb sind die Pre-Deployment-Checkliste und der 90-Tage-Gesundheitscheck keine optionalen Schritte. Sie sind die operativen Gewohnheiten, die Probleme abfangen, bevor sie sich zusammensetzen.
Die gute Nachricht: Jeder hier dokumentierte Failure-Modus ist vermeidbar, und jeder Wiederherstellungspfad ist bekannt. Die Unternehmen, die KI-Sales-Ops richtig hinbekommen, sind nicht klüger als die, die kämpfen. Sie sind geduldiger mit Phase 0, ehrlicher zu ihren Reps darüber, was die Tools tun, und disziplinierter beim Monitoring nach dem Launch.
Beginnen Sie mit der Implementierungs-Roadmap. Bauen Sie Governance, bevor Sie sie benötigen, nicht nachdem Sie sie benötigen und etwas bereits schiefgelaufen ist. Und lesen Sie diesen Artikel erneut vor Ihrer 90-Tage-Review. Die Failure-Modi, über die Sie sich beim Launch keine Sorgen gemacht haben, sind diejenigen, die Sie finden werden.
Für die Framework-level-Perspektive darüber, warum KI-Deployments scheitern, bevor sie überhaupt die Sales-Ops-Schicht erreichen, behandelt Warum die meisten KI-Frameworks Operatoren nicht helfen können dieselben strukturellen Probleme auf ACE-Fundament-Ebene.
Was als nächstes lesen
- Anti-Muster: KI-Kombinationen, die scheitern: Muster-level-Failure-Modi über die vollständige 10-Muster-Landschaft
- KI-Sales-Ops-Governance und Audit Trails: das Governance-Framework, das die meisten dieser Failure-Modi verhindert
- KI-Sales-Ops-Implementierungs-Roadmap: der sequenzierte Rollout, der das Deployment-Risiko reduziert
- Häufige KI-Lead-Scoring-Fallstricke: tiefere Behandlung der Failure-Modi 2 und 6 angewendet auf das Scoring-Muster

Co-Founder, Rework.com
On this page
- Die 7 KI-Sales-Ops-Failure-Modi
- Failure-Modus 1: Rep-Aufstand
- Failure-Modus 2: Lead-Scores werden gespielt
- Failure-Modus 3: Auto-erstellte E-Mails klingen nach Corporate-KI
- Failure-Modus 4: Coaching-Dashboards erzeugen Rep-Angst und Fluktrations-Risiko
- Failure-Modus 5: Forecasting-Modelle überfitten an aktuelle Quartale
- Failure-Modus 6: Routing-Modelle zementieren alte ICP-Biases
- Failure-Modus 7: Audit-Overhead übersteigt Einsparungen für kleine Teams
- Failure-Modus-Risiko-Zusammenfassung
- Pre-Deployment-Checkliste
- 90-Tage-Gesundheitscheck-Framework
- Das ehrliche Fazit
- Was als nächstes lesen