Real Estate Metrics & KPIs: The Numbers That Drive Business Growth
Turn this article into takeaways for your work.
Each assistant summarizes the article only for you and suggests best practices for your work.
The Busy Agent Problem
You're working 60-hour weeks. You're holding 10-15 appointments weekly. Your phone never stops ringing. But your bank account isn't reflecting all that hustle.
Sound familiar? You're not alone. Many agents confuse activity with results. They track time spent instead of time that matters. They chase every lead instead of qualifying the ones most likely to close.
This is where metrics change everything.
The right numbers tell you what's actually working. They show you where you're wasting effort. And they give you something most agents lack - visibility into whether your efforts will translate to income this quarter and next quarter.
Why Metrics Matter in Real Estate
Before we dive into the specific numbers, let's establish why this matters. The real estate sales cycle can span weeks or months from initial lead to closed deal. That lag between activity and income is why tracking matters. It's your only way to predict future results while there's still time to course-correct.
Metrics create two things: accountability and direction. When you know your conversion rate from lead to appointment, you can calculate exactly how many leads you need to hit your income goal. When you track your average sale price, you know whether you should adjust your marketing to attract higher-value deals.
Without these numbers, you're flying blind.
The Metrics Hierarchy: Leading vs. Lagging Indicators
Not all metrics are created equal. The best agents track both types.
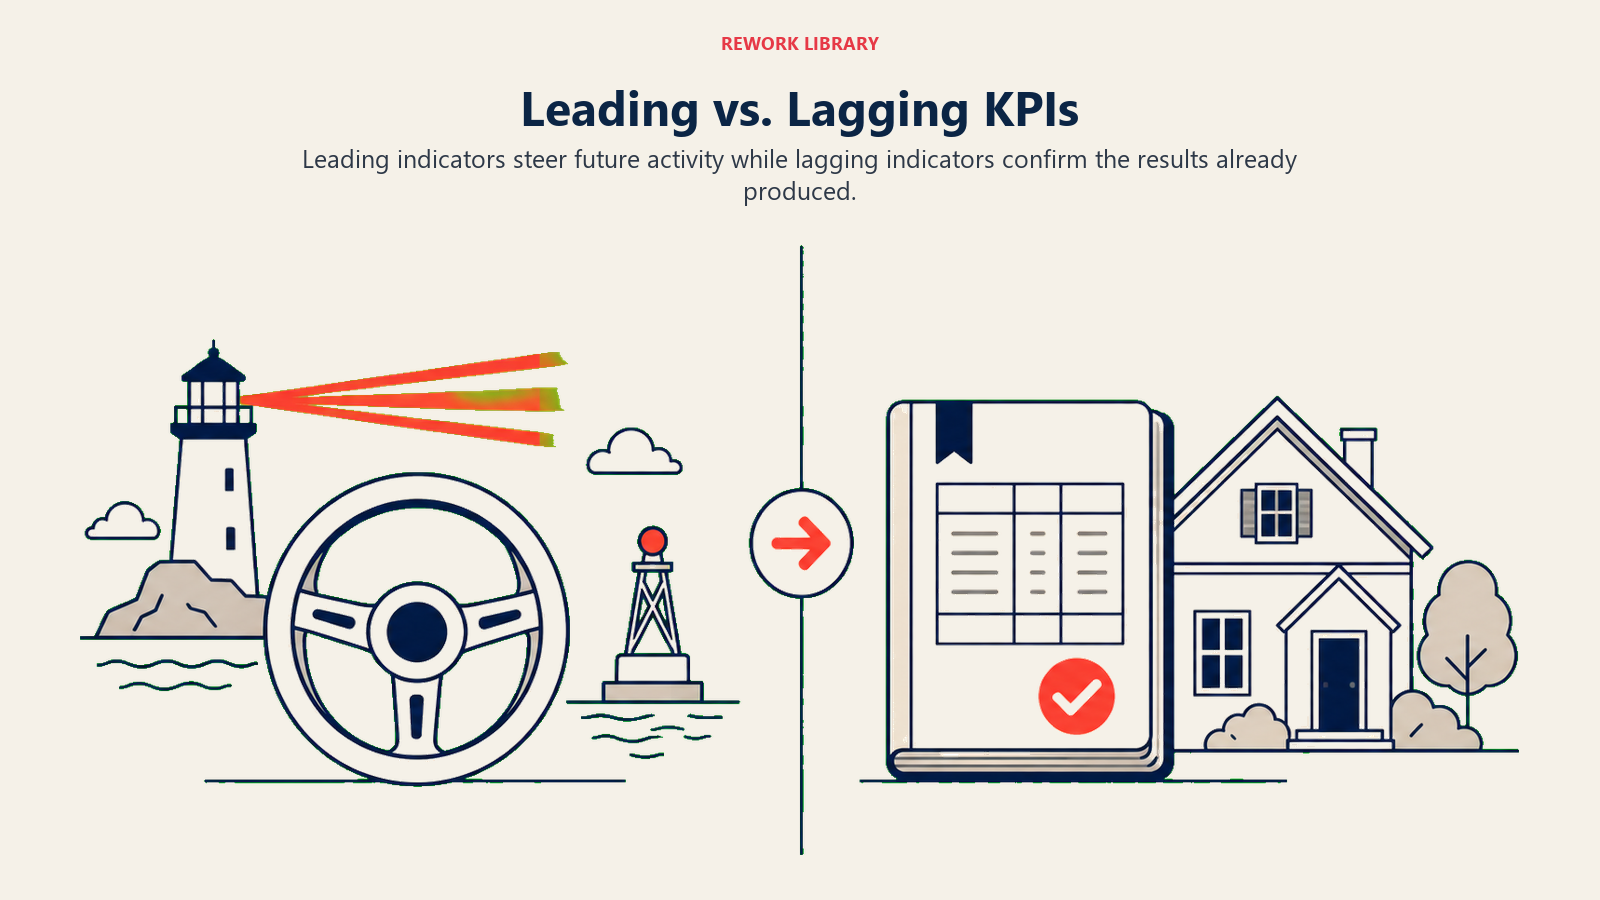
Lagging indicators show you what already happened. They're your results like GCI, closed transactions, and average sale price. They're important for measuring success, but by the time you see them, it's too late to influence them.
Leading indicators predict what's coming. They're your activity and conversion rates like leads generated, appointments held, and percentage of leads that become clients. These are your steering wheel. When your conversion rate drops, you can fix it before it tanks your income.
The complete picture requires both. Your lagging indicators validate whether you're really winning. Your leading indicators let you course-correct before you need to validate anything.
Core Production Metrics: What You're Actually Earning
Let's start with the output metrics, the numbers that show what you're actually producing.
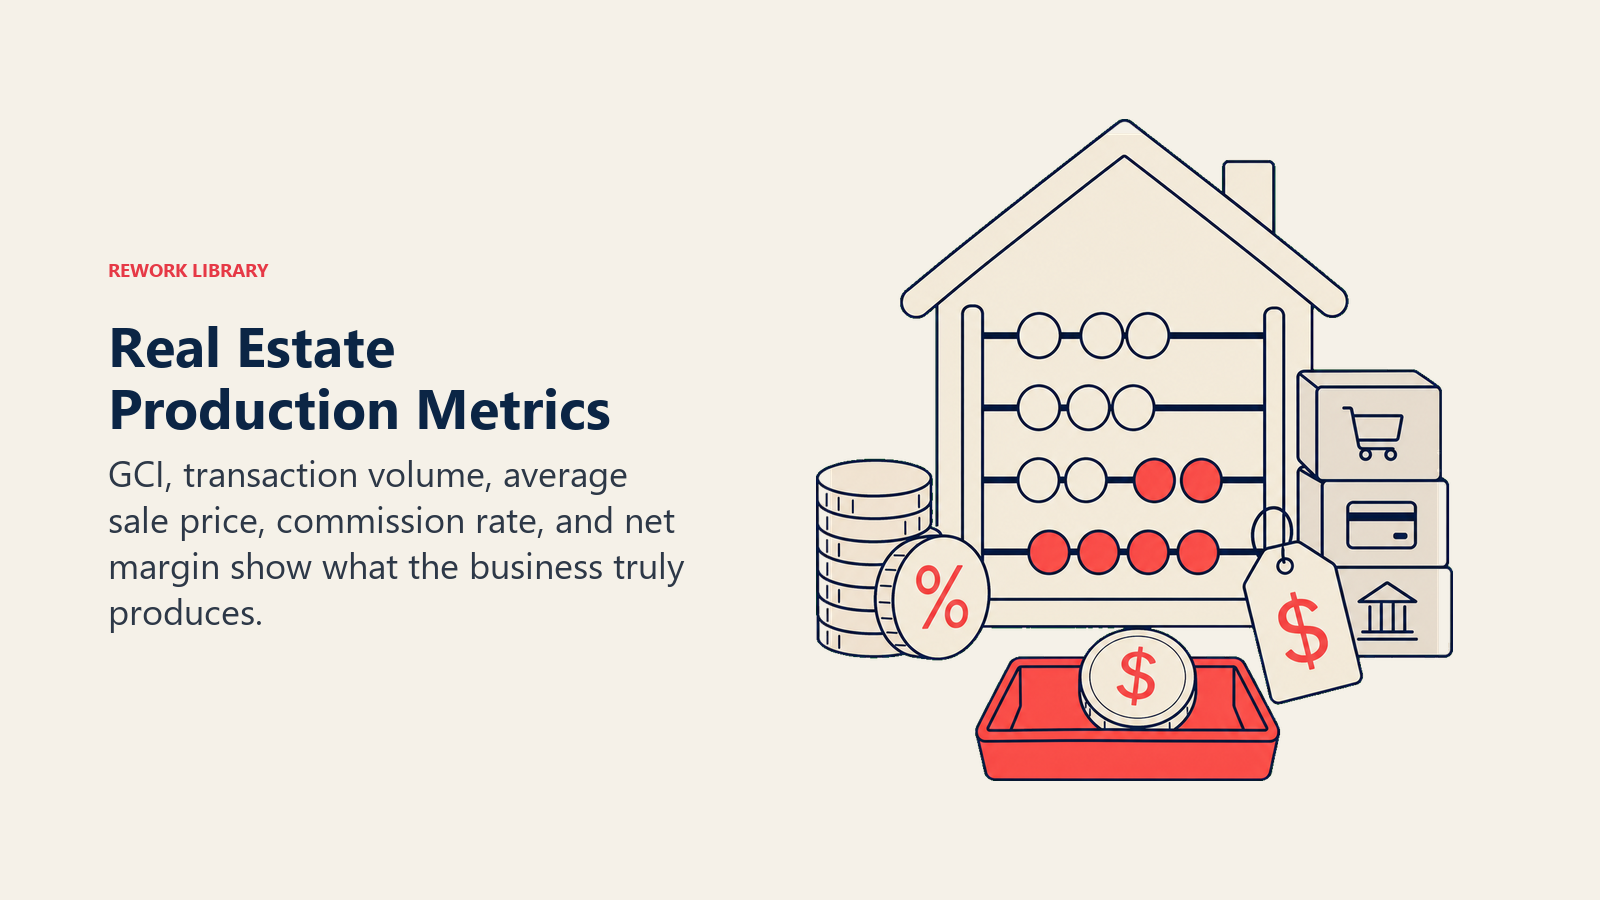
Gross Commission Income (GCI) is your total commission before any costs or splits. If you sold $5 million in real estate at 5% average commission and split 50% with your brokerage, your GCI is $125,000. This is your top-line revenue and the ultimate measure of production.
Transaction volume matters because it shows your deal velocity. Five transactions at $1 million average is very different from 20 transactions at $250,000 average. The first requires expertise in complex deals; the second requires scalable systems.
Average sale price shows what market segment you're operating in. Real estate markets are stratified, $300K properties require different skills, marketing, and timelines than $1M properties. Track this separately for buyers and sellers.
Average commission rate reveals your negotiating power and positioning. High-volume agents often accept lower rates. High-touch specialists can command higher rates. Know yours.
Net profit margin (what you keep after all costs) is the only number that actually matters to your personal finances. An agent earning $200K GCI with $50K in costs nets $150K. Another earning $150K GCI with $5K in costs nets $145K. One is more profitable despite lower production.
Lead Generation Metrics: The Top of Your Funnel
These metrics tell you if you're generating enough opportunities to hit your targets. Understanding real estate lead generation strategy helps you optimize which channels to invest in.
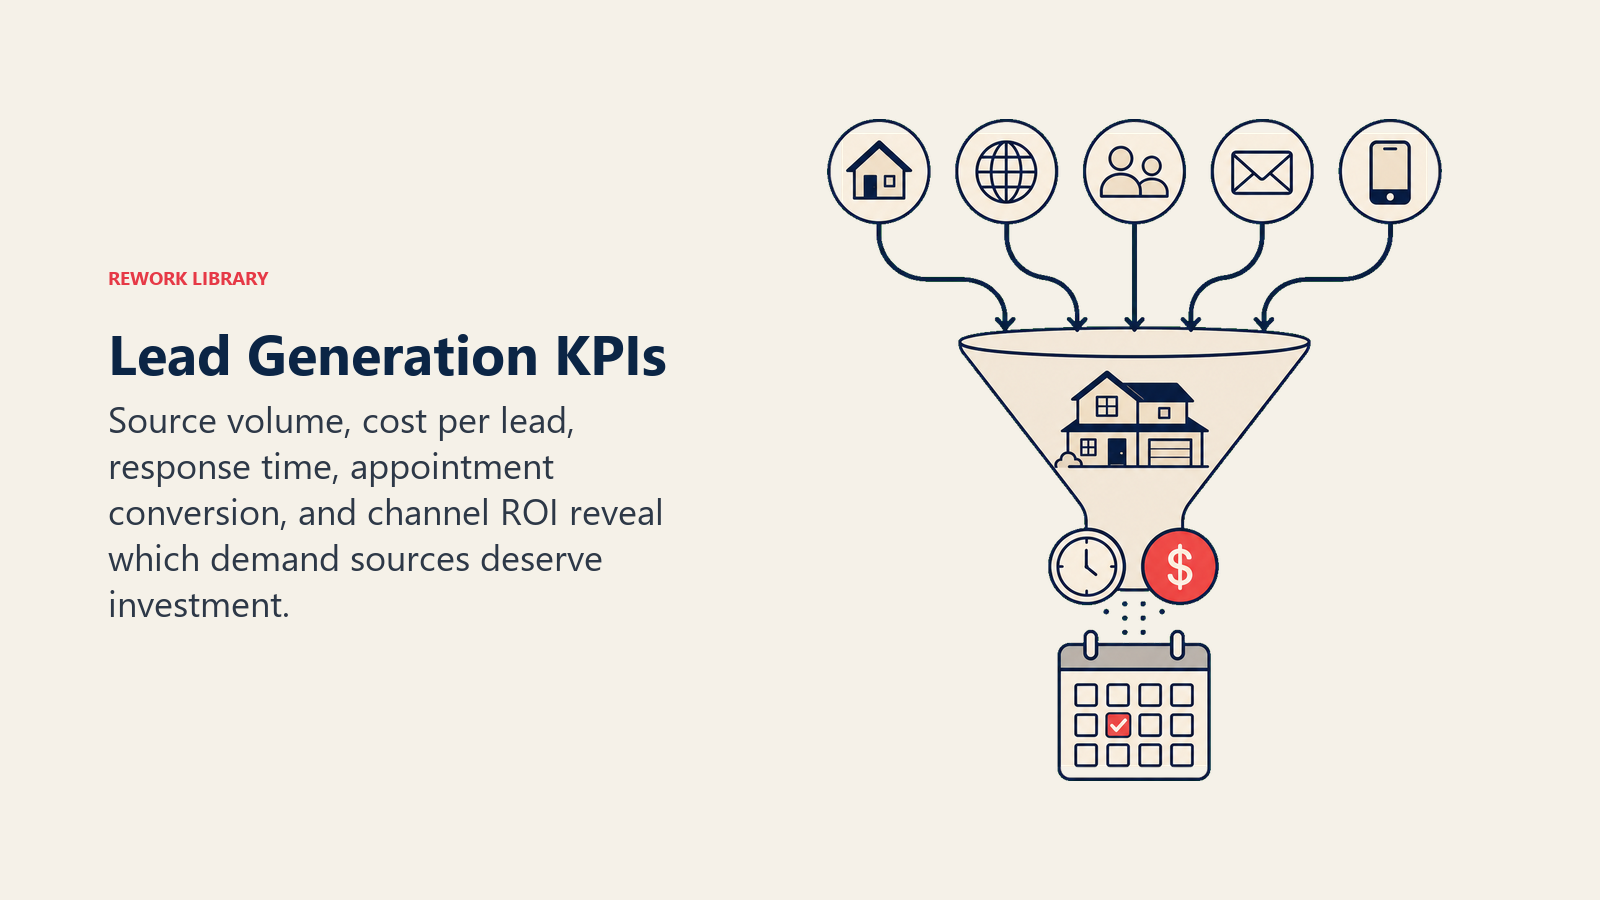
Total leads generated is the raw count, but only when broken down by source does it become useful. Track leads from referrals, your website, social media, paid ads, open houses, farm calls, and referral partners separately. You need to know what's actually working.
Cost per lead (CPL) is critical if you're spending money on marketing. If Facebook ads cost you $15 per lead, your email campaign costs $2 per lead, but your referral program costs you nothing (or a referral fee after close), you can calculate ROI by channel. Spoiler: your cheapest leads aren't always your best leads.
Lead response time is underrated. Studies show agents who respond to leads within 5 minutes convert them at double the rate of agents who wait an hour. Speed-to-lead response beats perfection here. Track your average response time and push for under 5 minutes.
Lead-to-appointment conversion rate tells you the quality of your initial conversation. If 30% of your leads become appointments, that's solid. If it's 10%, your lead qualification framework or communication skills need work.
Marketing ROI by channel combines cost and conversions. Maybe your paid ads have high cost per lead but also high conversion rate, making them profitable overall. Maybe your referral channel is small but incredibly efficient. Channel-by-channel analysis lets you double down on what works.
Sales Activity Metrics: The Work You're Actually Doing
These are the tasks that drive everything. The buyer lead funnel shows how these activities flow.
Appointments scheduled is an absolute leading indicator. If you're scheduling 15 buyer/seller appointments weekly but only held 10 last week, something's off. This metric tells you if you're generating opportunity.
Appointments held (show rate) reveals whether your scheduled appointments are worth the time. If 80% of your scheduled appointments show up, you're qualifying well. If it's 50%, you might be overselling, confirming poorly, or qualifying loosely.
Consultations completed tracks in-depth conversations where you're presenting your value. This is where trust builds through initial buyer consultations or listing appointments. Some agents hold many appointments but few real consultations; others do deep consulting with fewer appointments.
Buyer/seller agreements signed is the conversion point from prospect to client. Every agreement signed is a future transaction (assuming you execute well).
Active buyers/sellers in pipeline shows your current opportunity pool. Ten active buyers means different income potential than three. Track this alongside pipeline value to understand your near-term income.
Conversion Metrics: Moving People Through Your Pipeline
These are the percentages that determine your efficiency. Each conversion rate is a multiplier on your lead generation.
Lead-to-client conversion rate tells you what percentage of leads become actual clients (buyer/seller agreements signed). If you generate 100 leads monthly and sign 10 clients, that's a 10% conversion rate. This is often 5-15% for most agents.
Client-to-contract conversion rate measures execution, what percentage of your clients end up with signed contracts. Ideally this is 90%+. Below 80% suggests problems with market knowledge, pricing strategy, or property presentation.
Contract-to-close ratio shows how many contracts you sign versus how many you close. Market cycles matter here, but consistently below 90% suggests transaction coordination or skills gaps.
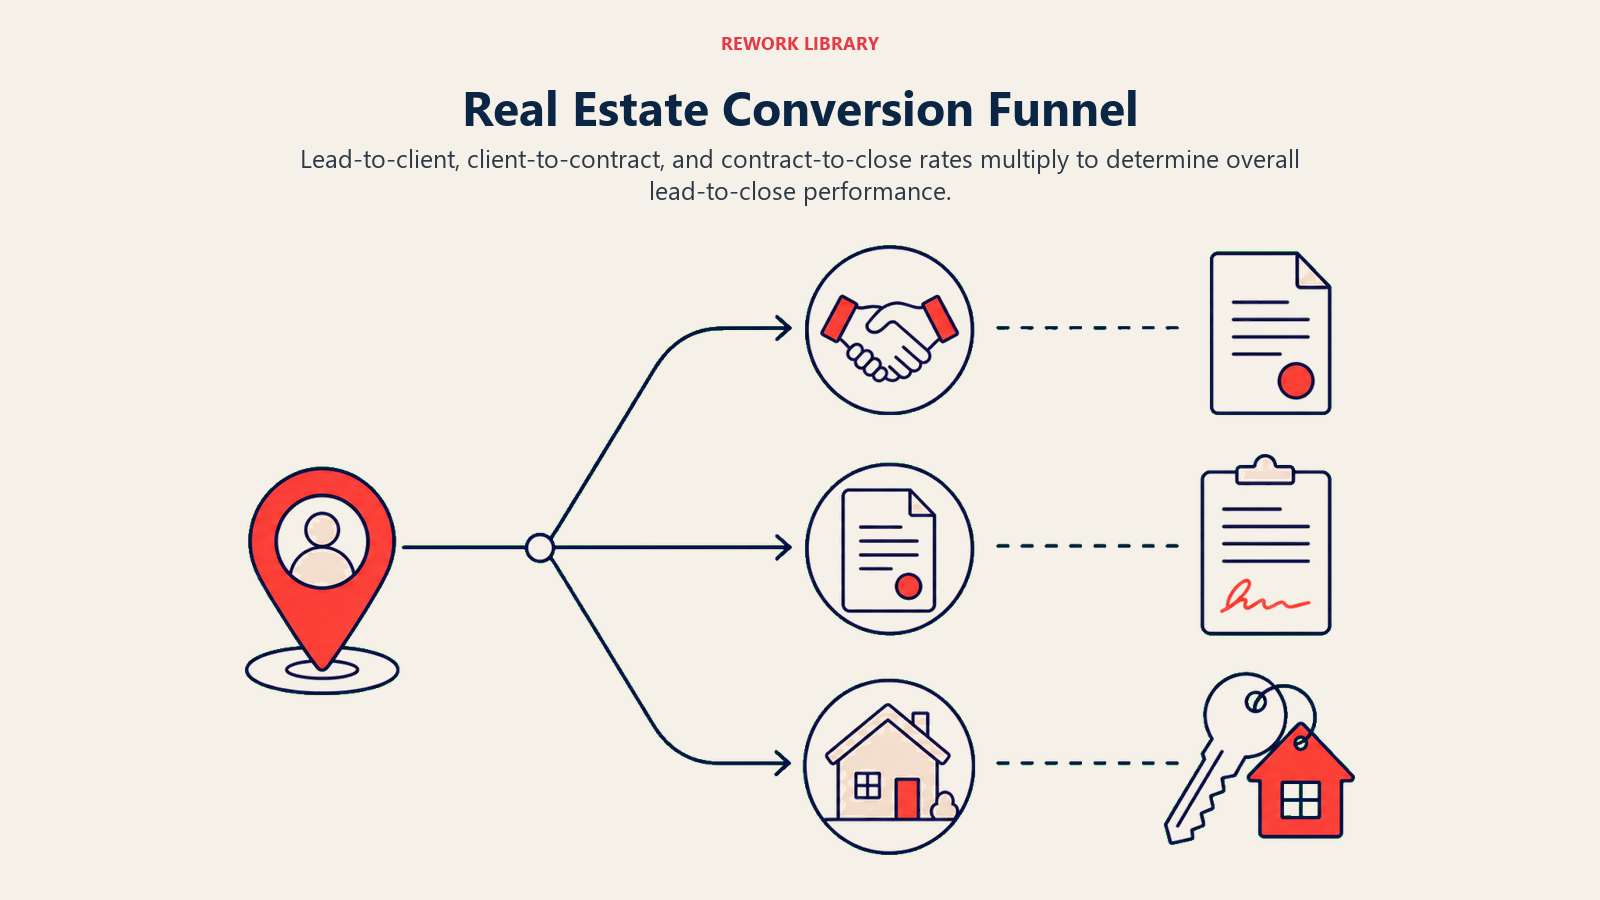
Overall lead-to-close rate is the combined conversion from lead to final commission check. If your lead-to-client is 10%, client-to-contract is 85%, and contract-to-close is 92%, your overall lead-to-close is 7.8%. Generate 100 leads, close 7-8 deals.
Days from lead to contract and days from contract to close measure your velocity. Market conditions vary, but tracking your own timeline month-to-month reveals whether you're speeding up or slowing down.
Pipeline Health Metrics: Predicting Your Next Quarter
These metrics show the health of your current opportunities and let you forecast revenue.
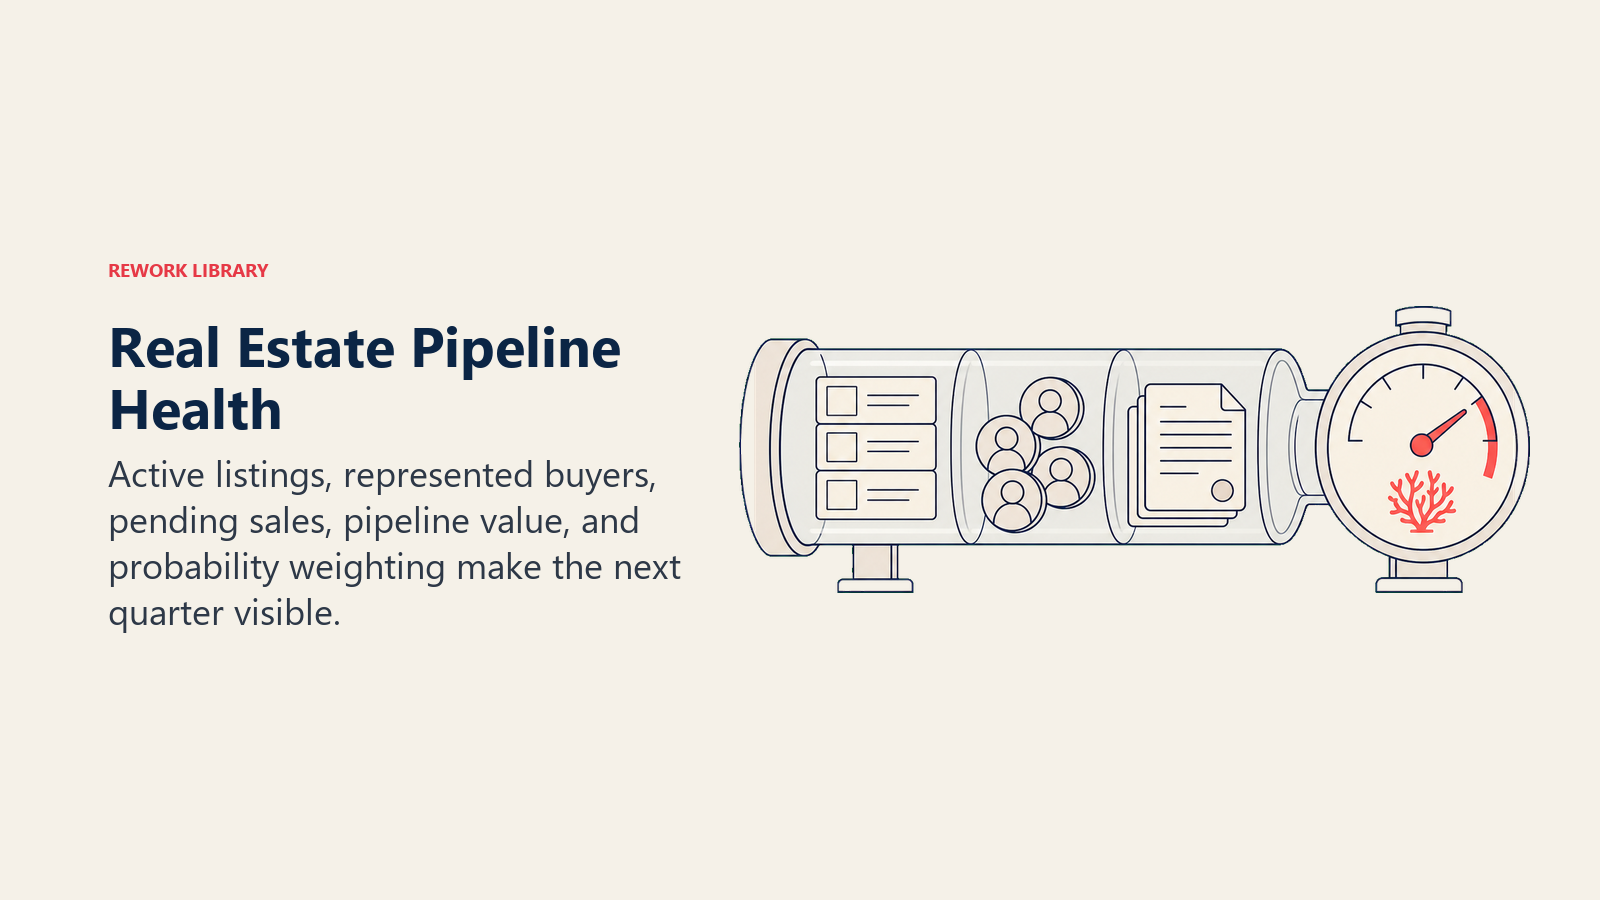
Active listings (if you're in listing agent mode) shows current inventory you're marketing. More listings create more buyer opportunities, more visible inventory, and more commission potential.
Active buyers under your representation shows your buyer business pipeline. More active buyers means more contracts coming.
Under contract (pending sales) are your near-term closed deals. Every pending sale is money you've already earned (barring inspection failures or financing issues).
Pipeline value is the total expected GCI from all active and pending opportunities. If you have three under-contract deals at $300K, $250K, and $400K, with a 5% average commission and 50% split, your pipeline value is roughly $22,500. This is money you can almost bank.
Weighted pipeline adjusts pipeline value for probability. That $22,500 is strong if all three are in final stages. It's weaker if one is at first showing and another failed inspection. Weighted pipeline accounts for realistic probability.
Economic Unit Metrics: The Unit Economics of Your Business
These metrics reveal whether each client relationship is profitable.
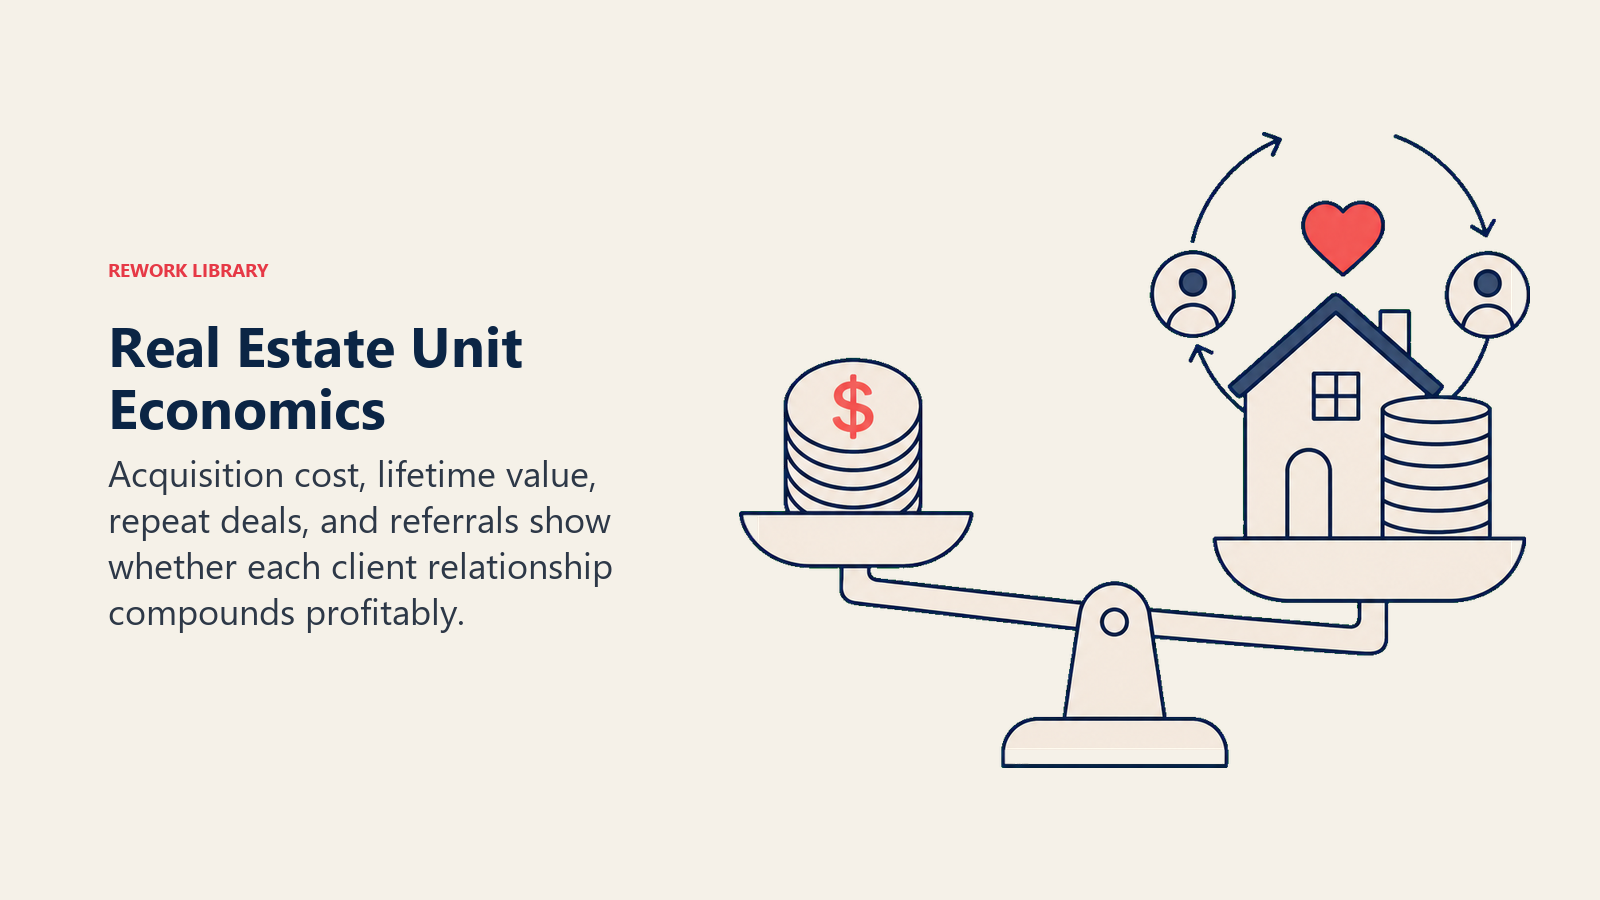
Cost per acquisition (CPA) is all your marketing costs divided by clients acquired. If you spend $5,000 monthly on marketing and sign 5 clients, your CPA is $1,000. If each client generates average GCI of $5,000 and you keep 70% after costs and splits, you net $3,500 per client. CPA of $1,000 means you break even within your first transaction, excellent.
Customer acquisition cost vs. lifetime value extends the timeframe. That first deal generates $3,500. But 30% of your clients come back for second transactions. Twenty percent for thirds. Lifetime value of a client might be $8,000-$15,000. CPA of $1,000 becomes even more obviously profitable.
Average deals per client shows your repeat business rate. Ideally every client buys or sells again in 3-5 years. If your average is 1.3 deals per customer, you have a 30% repeat rate, above average.
Referral rate as percentage of total business shows how much of your income comes from past clients and professional relationships. This should grow as you mature. Agents who hit 50%+ referral business through a strong referral generation system have predictable, low-cost revenue.
Repeat client rate measures directly: what percentage of past clients come back? Aim for 25%+ repeat rate within 5 years.
Time & Productivity Metrics: Making Sure You're Earning What You're Working For
Your time is finite. These metrics ensure you're using it toward income.
Hours worked vs. income-producing activities forces a hard reality check. If you work 50 hours weekly, track how many are actual client meetings, showings, negotiations, and prospecting. If it's 15 hours, that's a 30% production ratio, typical for many agents. Elite agents run 50%+ ratios.
Time per transaction shows whether deals are becoming easier (faster) or harder (slower) as you evolve. New agents might spend 40 hours per deal. Experienced agents with systems often hit 15-20 hours per deal. Less time per deal means leverage.
Revenue per hour is GCI divided by total hours worked. If you earned $120K GCI in 2,000 hours worked, that's $60 per hour revenue (before all costs). This reveals whether you need to raise prices, specialize, or improve systems.
Leverage ratio (team only) is team production divided by your personal production. If you lead a team generating $1 million GCI and you personally closed $200K, your leverage is 5x. Understanding real estate team structure and leverage is how you build real wealth in real estate.
Industry Benchmarks: How You Stack Up
Numbers only mean something in context. Here's what typical agents produce:
| Metric | New Agent (Year 1) | Developing Agent (2-3 yrs) | Mature Agent (5+ yrs) |
|---|---|---|---|
| Transactions/Year | 2-4 | 6-10 | 15-25 |
| GCI | $20-50K | $75-150K | $150-300K+ |
| Avg Sale Price | $250-350K | $350-500K | $400-600K+ |
| Lead-to-Close Rate | 5-8% | 8-12% | 12-20% |
| Repeat Rate | 0% | 5-10% | 25-40% |
| Referral % of Business | 0% | 5-15% | 30-60% |
Industry factors matter: your market, price point, and agent model affect everything. Agents in hot markets with high average sale prices will produce more GCI. Agents in luxury real estate will have fewer transactions but higher commission dollars.
The comparison isn't agent-to-agent. It's you-to-you over time.
The Weekly Scorecard: What To Actually Track
You don't need to monitor everything every day. But track this weekly.
Leads Generated (this week, cumulative month). Appointments Scheduled (this week, show rate). Consultations Held. Agreements Signed (buyer/seller agreements this week). Contracts Signed (closed this week, cumulative month). Pipeline Value (active + pending deals). Hours Spent on Income-Producing Activities (percentage of total).
This eight-item scorecard gives you weekly visibility into whether you're on track. If Wednesday hits and you haven't scheduled any appointments, you know you need to prospect hard Thursday and Friday.
Dashboard Design: Daily, Weekly, Monthly Views
Different metrics need different frequencies.
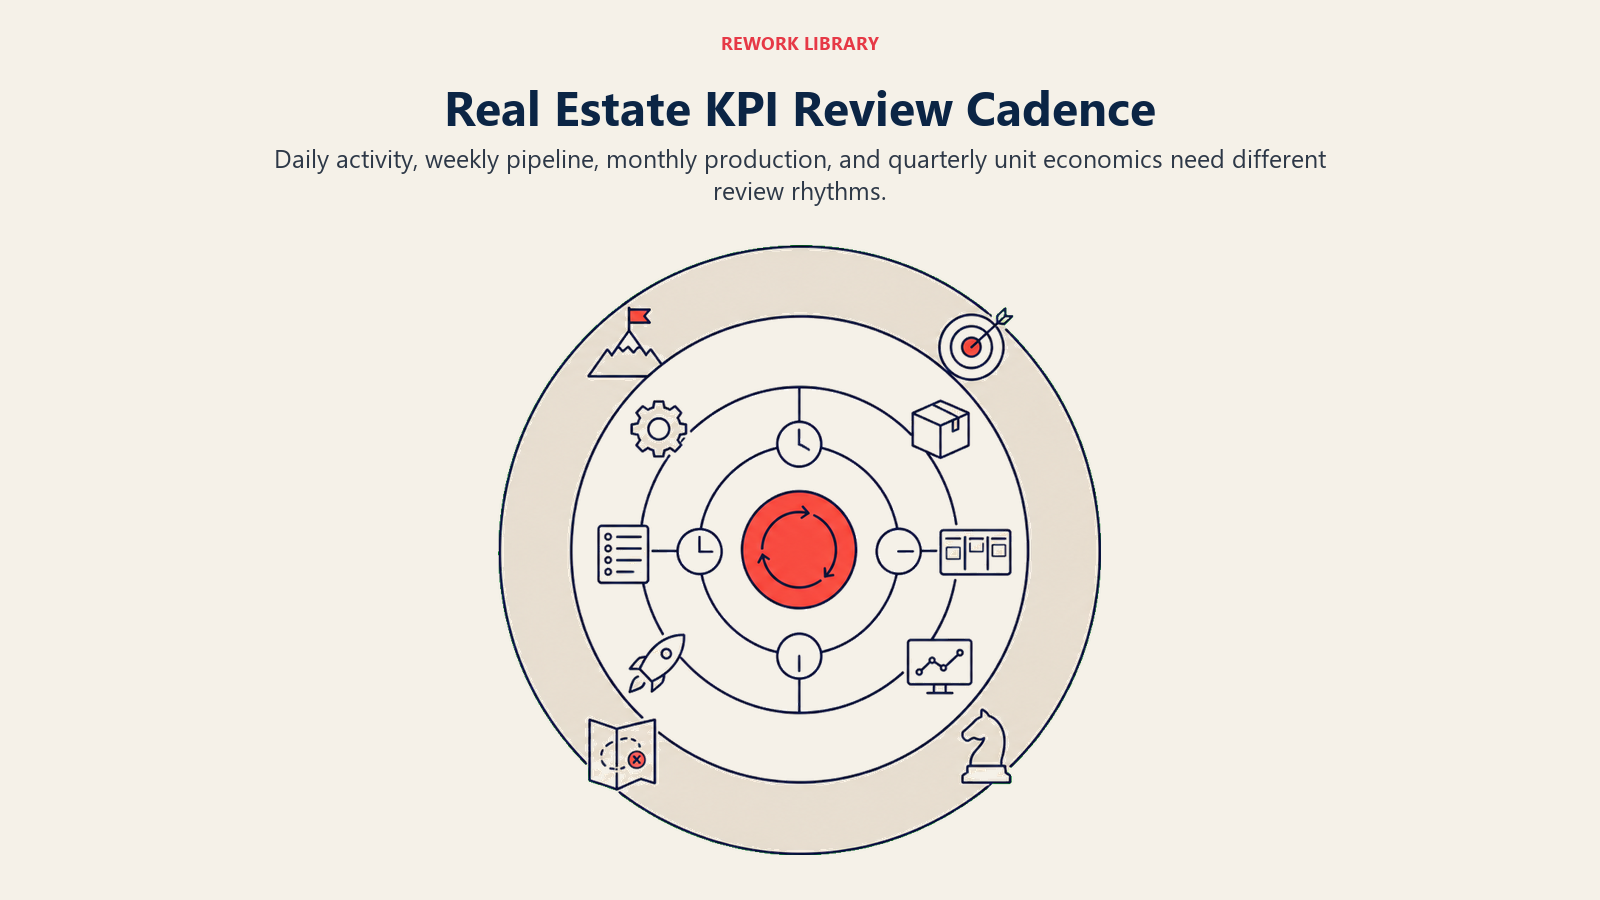
Daily Tracking: Leads generated (source). Appointments scheduled. Appointments held. Hours on income-producing activities.
Weekly Review: Weekly totals (leads, appointments, agreements). Current pipeline value. Current week metrics vs. monthly target. Conversion rates (lead-to-appointment, appointment-to-agreement).
Monthly Analysis: GCI produced. Transactions closed. Average sale price. Cost per acquisition. Repeat client rate. Comparison vs. monthly target. Comparison vs. previous months and year-over-year.
Quarterly Deep Dive: Overall lead-to-close conversion rate. Economic unit metrics (cost per acquisition, lifetime value). Leverage ratio (if team-based). Year-to-date GCI vs. annual goal. Referral percentage of business. Days-to-close trend analysis.
Making These Metrics Actionable
Tracking metrics without acting on them is theater. After you establish your baseline numbers, ask: Where is conversion dropping? (Suspect qualification, market knowledge, or communication). Which online lead source is most profitable? (Double down). Are you getting faster or slower at closing? (Market change or skill gap?). Are hours-to-transaction increasing? (You need systems or help). What percentage of clients repeat? (Indicates service quality).
The real estate industry grows when you understand the agent vs team vs brokerage model that works for your metrics. A solo agent with strong referral rates (70% of business) needs a different model than an agent building a buyer machine (30 transactions annually, all leads).
Your metrics should drive strategy decisions, not just satisfy curiosity. The framework I've outlined (from lead generation through pipeline health to economic unit metrics) gives you the data foundation to compete at any level in real estate. Start by tracking the weekly scorecard. Add depth from there.
Real estate is simple once you measure the right things. Activity matters, but only the activity that converts to commissions. These metrics separate the two.
Learn More
Deepen your understanding of real estate business management with these related resources:
- Real Estate Growth Model Overview - Understand the complete framework for building a sustainable real estate business
- Lead Scoring for Real Estate - Learn how to prioritize leads based on conversion probability
- Real Estate CRM Selection - Choose the right tools to track and manage your metrics effectively
- Client Retention Strategy - Build systems that increase your repeat client rate and referral percentages

Senior Operations & Growth Strategist
On this page
- The Busy Agent Problem
- Why Metrics Matter in Real Estate
- The Metrics Hierarchy: Leading vs. Lagging Indicators
- Core Production Metrics: What You're Actually Earning
- Lead Generation Metrics: The Top of Your Funnel
- Sales Activity Metrics: The Work You're Actually Doing
- Conversion Metrics: Moving People Through Your Pipeline
- Pipeline Health Metrics: Predicting Your Next Quarter
- Economic Unit Metrics: The Unit Economics of Your Business
- Time & Productivity Metrics: Making Sure You're Earning What You're Working For
- Industry Benchmarks: How You Stack Up
- The Weekly Scorecard: What To Actually Track
- Dashboard Design: Daily, Weekly, Monthly Views
- Making These Metrics Actionable
- Learn More