Comparative Market Analysis (CMA): The Foundation of Pricing Strategy
 Walk into a listing appointment with a solid CMA methodology, and you've already won half the battle. Sellers want to know their home is priced right. Not too low to leave money on the table, but not so high that it sits on the market for months. A well-constructed comparative market analysis gives you both the data and the credibility to guide that conversation.
Turn this article into takeaways for your work.
Each assistant summarizes the article only for you and suggests best practices for your work.
The problem is that many agents treat CMAs as a checkbox exercise. They pull some comps, run a few adjustments, and call it done. Sellers can sense that laziness. They compare your analysis against three others and pick the one that actually explains why certain prices matter.
This guide walks you through building CMAs that aren't just accurate. They're compelling enough to become your primary listing appointment tool.
Why CMA Methodology Matters
A comparative market analysis is your written argument for what a home should sell for. It's not an appraisal (which is performed by licensed appraisers for lending purposes), and it's not just your opinion. It's data-driven analysis that shows sellers you understand their local market.
The difference between a casual agent and a professional becomes obvious here. An agent who knows their CMA can confidently say, "This home should list between $425,000 and $445,000 because these three recent sales in the same neighborhood with similar square footage and condition sold in that range. Meanwhile, there are currently five active listings priced above $450,000, and all of them have been on the market for over 60 days."
That narrative wins business. It builds trust. And most importantly, it sets realistic seller expectations from day one, which prevents price reductions and keeps deals moving forward.
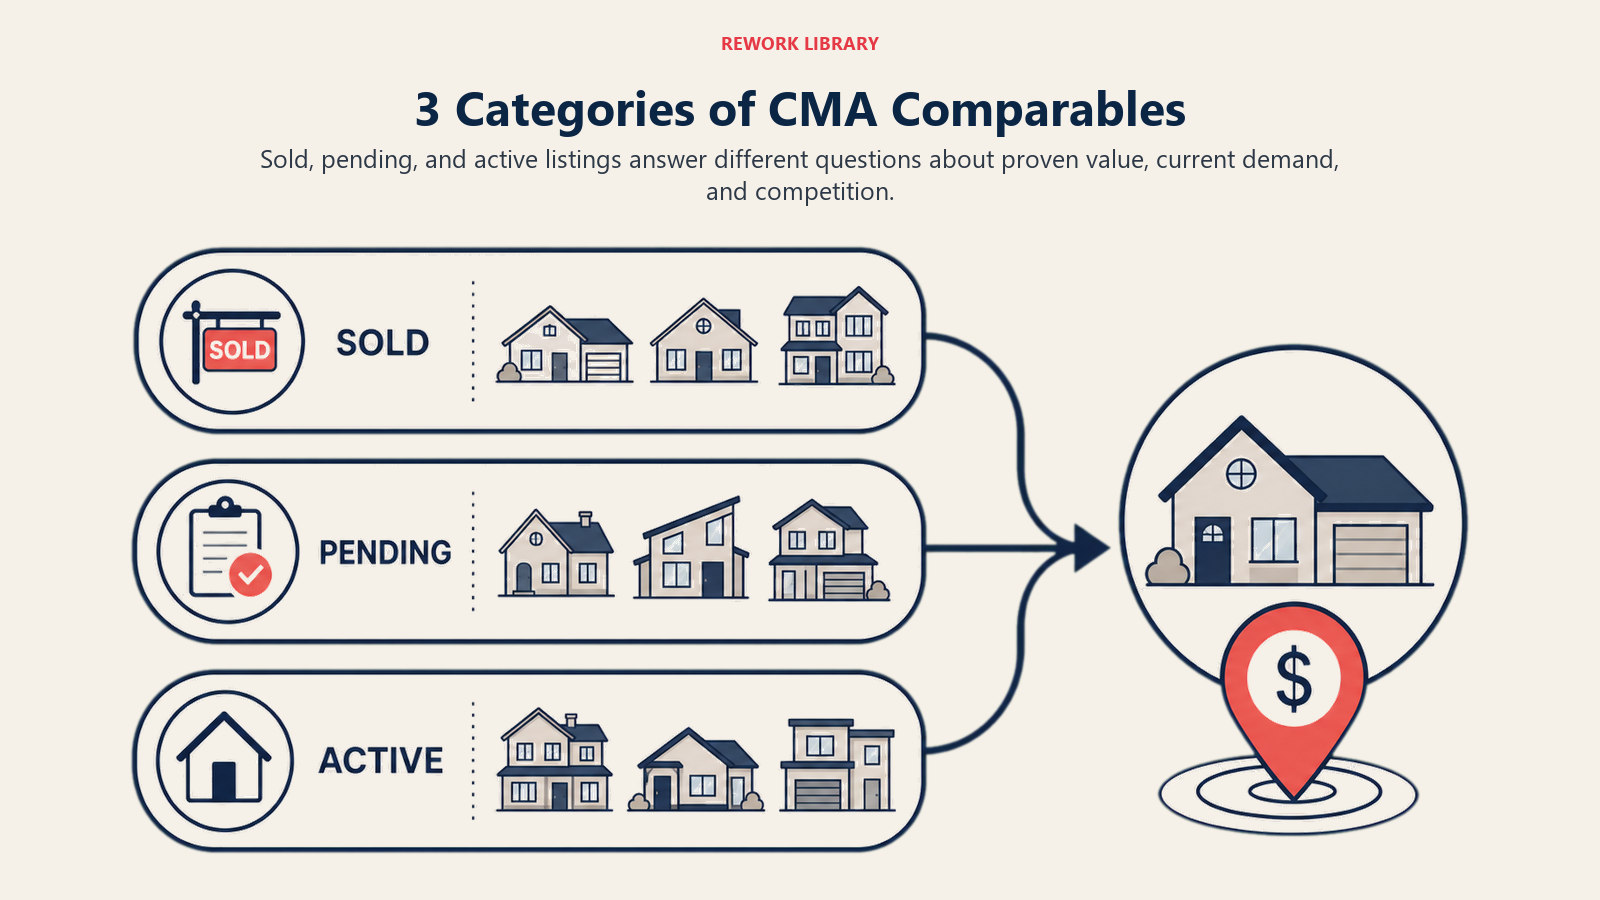
The Three-Category Comparable System
The most practical CMA approach uses three distinct categories of properties, each telling a different story about the market.
Active Listings (Current Competition)
These are homes currently on the market that compete with your seller's property. They represent the real competition buyers see when they start their search. Study active listings carefully. If there's an active home two blocks away with similar square footage, style, and condition priced at $415,000 and it's been on the market 45 days with no offers, that tells your seller something. It says the market isn't as hot as they think, or that particular price point isn't moving inventory. Active listings also show you what other agents are pricing similarly-situated homes at, which gives context to your pricing recommendation.
Pending Sales (Market Direction)
Pending properties are under contract but haven't closed yet. They're incredibly valuable data points because they show where the market is actually moving, not where it was three months ago.
If you have a pending sale four blocks away that just went under contract at $440,000, and it was listed at $445,000, that tells you several things: the market accepted that price point; the home moved fairly quickly; and sellers might expect a small negotiation.
Pending sales often carry more weight than active listings in your analysis because they represent the most recent market activity and buyer acceptance.
Sold Comparables (Market Validation)
These are closed sales from typically 90-180 days, depending on your market velocity. Sold comparables are your historical reference point. They show what the market has actually paid.
Pay special attention to the final sale price, not the original list price. A home that listed at $450,000 but sold for $415,000 tells you something completely different than one that listed and sold at the same price.
The broader your sold comparable data, the more confidence you can have in price trends. If you have eight recent sales in similar neighborhoods and they're clustering around $420-$435, that's a powerful data point.
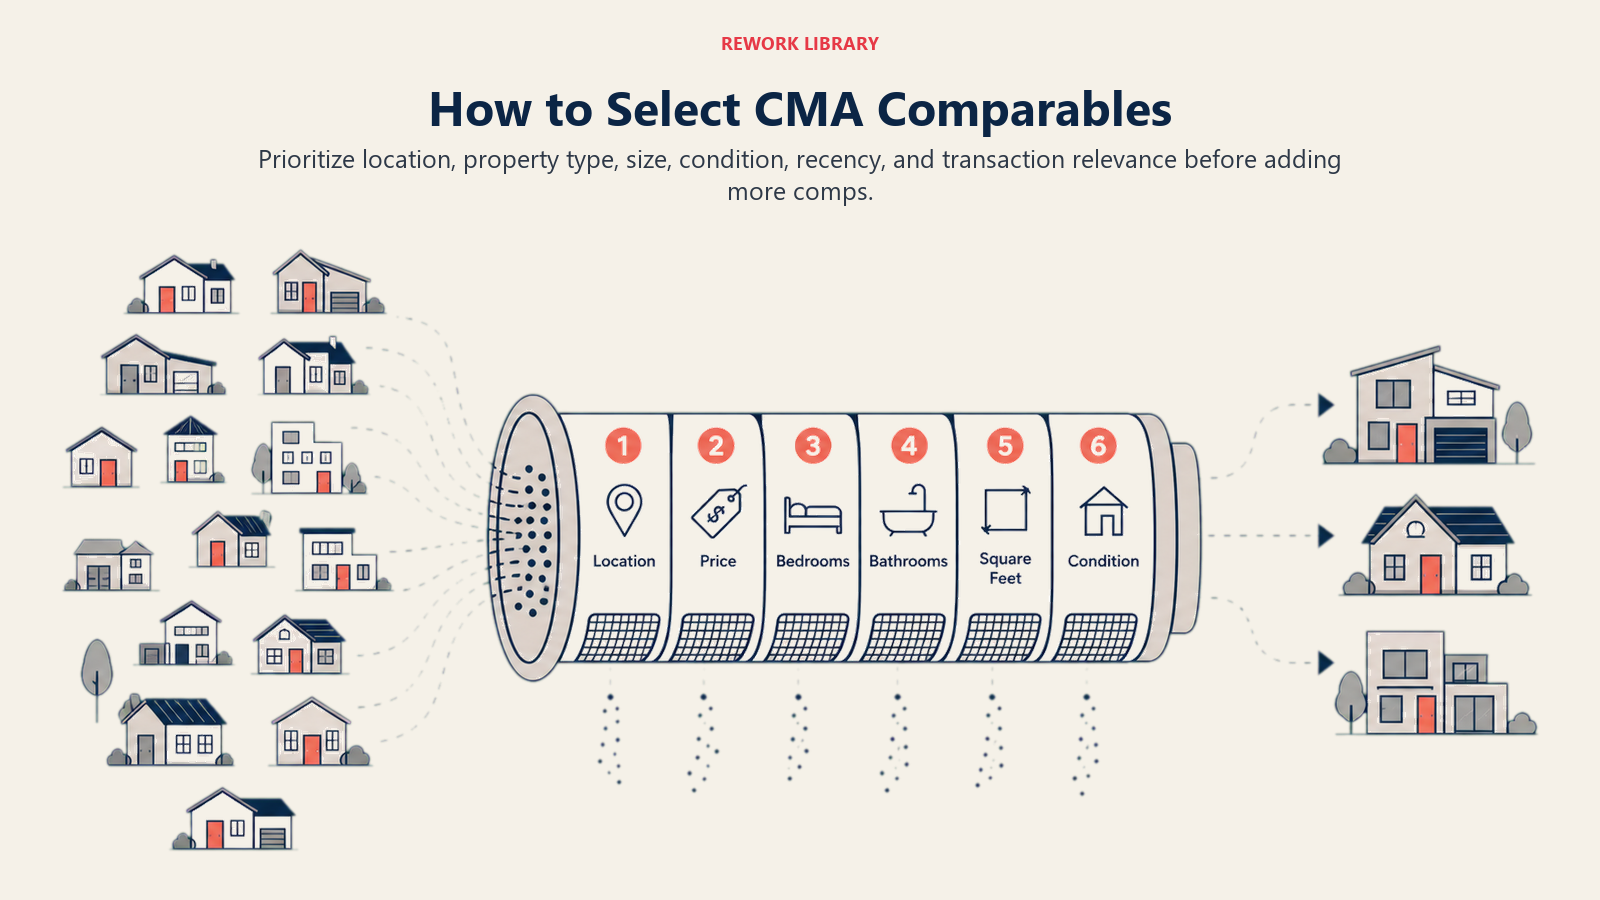
Selecting Quality Comparables: The Criteria That Matter
Not all comparables are created equal. Pulling random homes from your MLS and calling them comps will create analysis that sellers (and other agents) don't trust.
Geographic Proximity
Generally, closer is better. Homes in the same subdivision are more comparable than homes a mile away. However, geographic proximity matters less if there's a significant market segmentation. A home on a tree-lined street next to a park might not be comparable to one in a subdivision across the highway, even if they're geographically closer. The key principle: would a buyer searching for the seller's home also seriously consider this comparable? If yes, geography checks out.
Property Characteristics Matching
Square footage is usually the most important factor. Homes within 5-10% of the subject property's size are ideal. A 2,500-square-foot home is simply not as comparable to a 3,200-square-foot home as another 3,200-square-foot home would be. Bedroom and bathroom counts also matter, though less rigidly than square footage. A home with one fewer bedroom but identical square footage is often more comparable than one with the same bedroom count but significantly different size.
Time Frame Relevance
In most markets, 90-180 days of sold data gives you the most current information without losing relevance. In slower markets, you might need to go back 6-9 months. In hot markets, 30-60 days might be more appropriate.
The general rule: go back far enough to find meaningful data, but not so far that price trends have shifted significantly.
Condition and Upgrade Similarity
A home with a brand-new kitchen and updated bathrooms isn't really comparable to one with original 1990s fixtures, even if everything else matches. A property requiring roof replacement isn't comparable to one with a roof that just had work done.
This is where observation matters. You need to physically see comparable properties or review photos carefully. Generic MLS descriptions sometimes miss significant condition differences. This attention to property condition becomes critical when advising sellers on property staging and preparation.
Lot Size and Location Premium
A home on a double lot with mature trees commands a different price than an identical home on a standard lot. A corner lot might be worth more or less depending on your market. A home with a view, waterfront access, or proximity to a desirable amenity (school, park, shopping) deserves premium consideration.
Document these factors explicitly in your CMA so sellers understand why certain comparables were weighted more heavily.
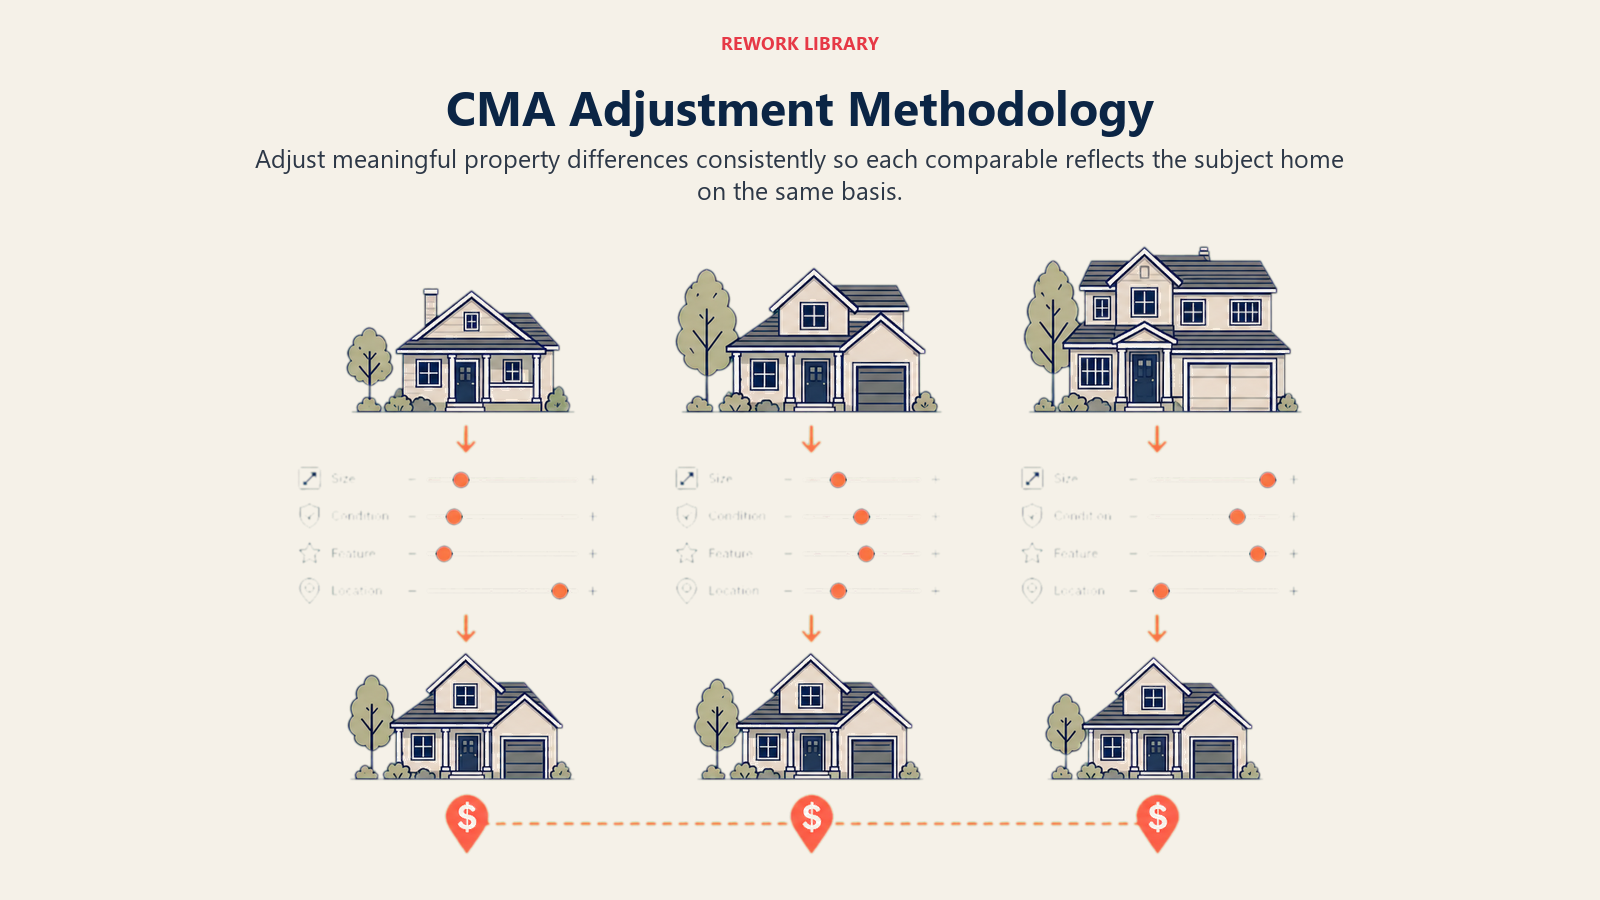
Adjustment Methodology: Making Comparables Actually Comparable
This is where many CMAs fall apart. Agents either don't adjust for differences or they adjust so aggressively that their numbers don't make sense. The adjustment process works like this: take a comparable property, and then adjust its sale price up or down to account for differences from your subject property.
Square Footage Adjustments
If your market's cost per square foot averages $150-$160, and your comparable sold at $420,000 but is 300 square feet larger than the subject, you'd adjust downward by about $45,000-$48,000. The math is straightforward. But make sure your per-square-foot assumptions actually reflect your market. If most homes in your area are selling at $140/sq ft, don't use $180/sq ft in your analysis. That destroys credibility immediately.
Bedroom and Bathroom Adjustments
These are trickier because value varies by market. In some neighborhoods, an additional bedroom might be worth $15,000-$20,000. In others, it could be worth $25,000-$30,000 or more.
Build your adjustment assumptions on actual market data, not assumptions. Look at your recent sales and see what the actual price difference was when properties were identical except for bedroom/bathroom counts.
Lot Size and Land Value
Larger lots command premiums, but the premium isn't linear. An extra half-acre in a suburban neighborhood might be worth $20,000, while an extra half-acre in a rural setting might be worth $50,000+. Location and market context matter enormously here.
Condition and Upgrade Factors
A roof replacement might cost $12,000 but affects home value by $15,000-$20,000 because buyers price in the safety and peace of mind. HVAC systems, plumbing, electrical, these all have market values that exceed their actual replacement costs.
If a comparable had a significant repair or upgrade, adjust accordingly. Document what you adjusted for in your presentation so sellers see you're being methodical, not just picking numbers.
Location and View Premiums
Some neighborhoods command 10-15% premiums over otherwise identical homes. Premium views (water, city skyline, mountains) can add 20-30% or more depending on the market and the quality of the view.
These adjustments require market knowledge. You can't pull these out of thin air. You build them from observing actual sale price differences in your market over time.
Garage and Parking Considerations
Three-car garage vs. two-car? That's usually worth $10,000-$15,000 in most suburban markets. Covered parking vs. open spaces? Different value. Again, know your market.
Market Trend Analysis: Putting Comparables in Context
A comparable from four months ago might not be as relevant if your market has shifted significantly. This is where trend analysis separates good CMAs from great ones.
Absorption Rate Calculation
Absorption rate is the percentage of available inventory that sells each month. It's calculated as: (number of homes sold in the last 30 days) / (total number of active listings) × 100. An absorption rate above 10% suggests a seller's market where homes are moving quickly. Below 5% suggests a buyer's market where homes take longer to sell. This context helps explain why you're recommending a certain price range. Understanding these metrics is crucial for effective real estate metrics and KPIs tracking.
Inventory Level Assessment
How many homes are competing with your seller's property? If there are 40 homes listed in the same price range and neighborhood, that's competitive. If there are four, that's tight inventory. Document current inventory levels in your CMA so sellers understand the competitive landscape they're entering.
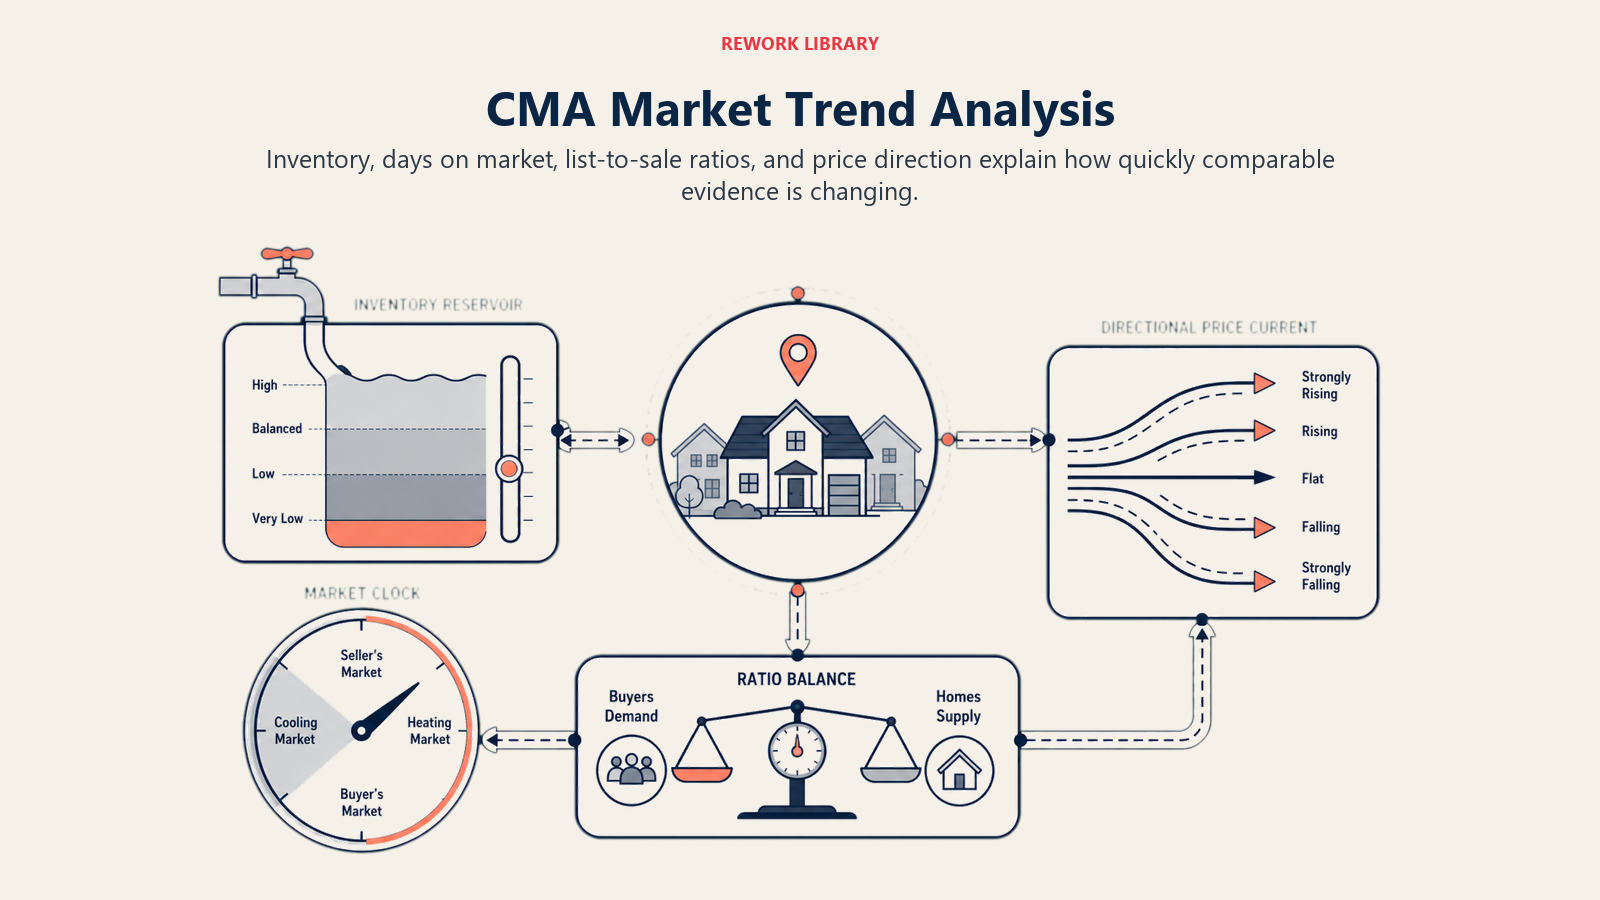
Price Trend Direction
Are prices in the neighborhood going up, down, or staying flat? Pull sold data from three months ago, six months ago, and today. Show the trend line. Sellers want to know if they're listing into a strong market or a softening one.
Days on Market Patterns
How long are comparable homes taking to sell? If comps are selling in 15-20 days average, your recommendation should reflect that strong market. If they're taking 45-60 days, that changes the pricing strategy.
Seasonal Factor Considerations
Some markets have significant seasonal shifts. If you're analyzing a property in November, you might need to account for the fact that homes listed in spring typically move faster. Document your seasonal assumptions.
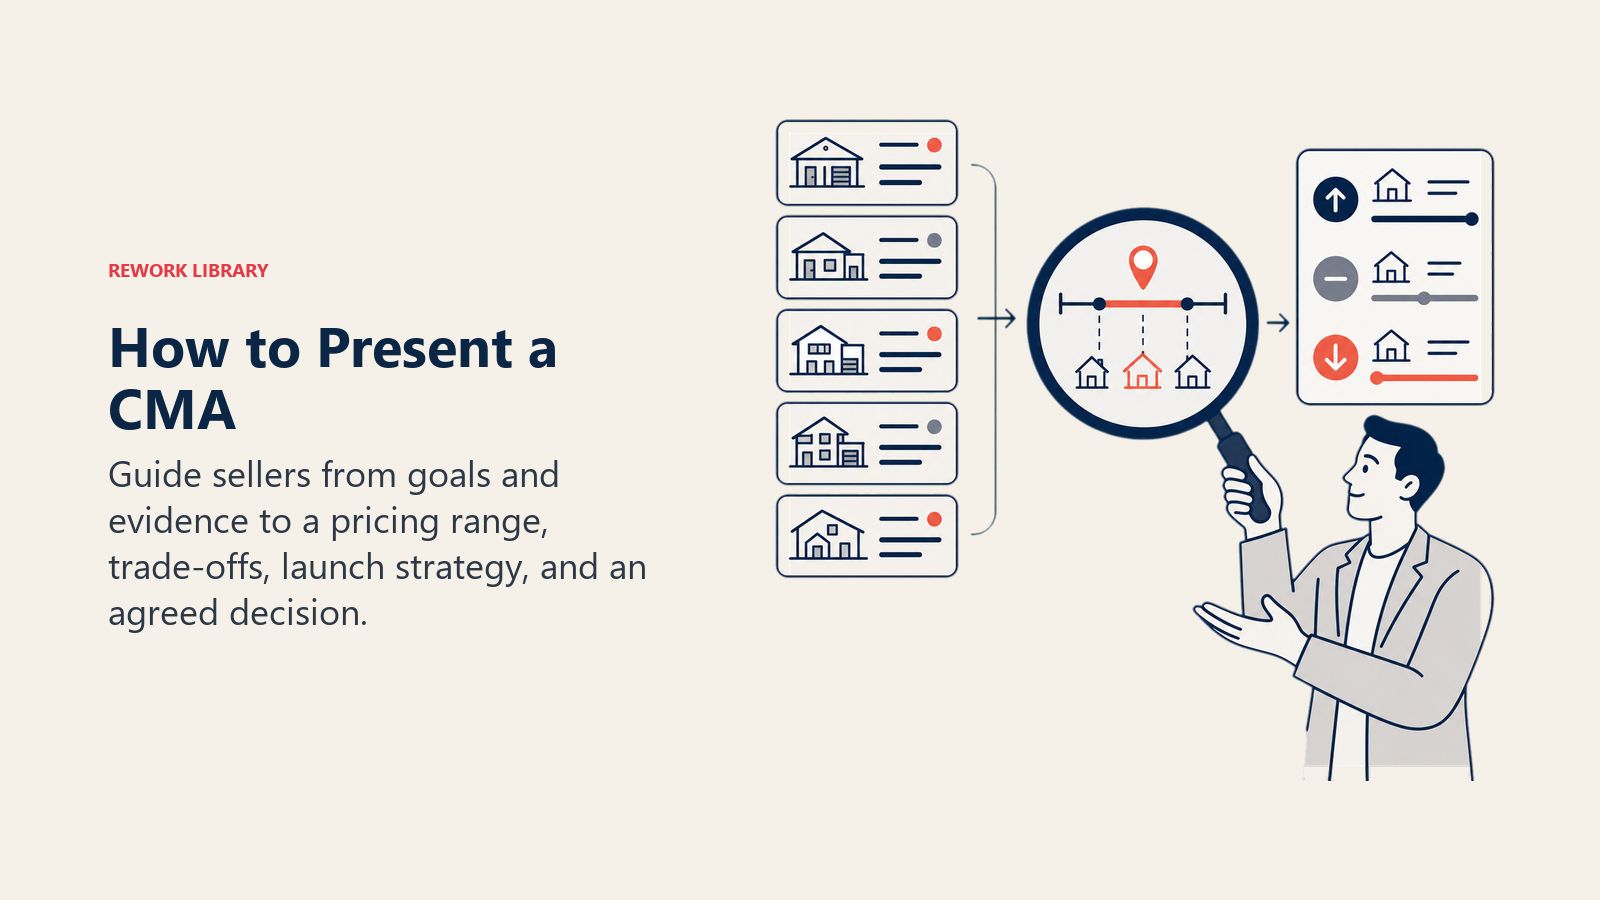
Presenting the CMA for Maximum Impact
A brilliant analysis hidden in a poorly presented document won't win listings. Your presentation matters as much as your analysis.
Visual Presentation Design
Use clean, readable layouts. Include photos of comparable properties. Show map views with color coding (active listings in red, pending in yellow, sold in green). Use graphs to show price trends over time. The goal is to make your analysis scannable. A seller flipping through your CMA should be able to grasp the key points in 30 seconds, then dive deeper if they want. Your CMA presentation should integrate seamlessly with your complete listing marketing plan.
Comparable Property Summaries
For each comp, include: address, sale date, sale price, square footage, key features, and any notable differences from the subject. Make it easy for sellers to see why you selected each property.
Adjustment Explanation Clarity
When you adjust comparable prices, explain why you adjusted. Don't just show numbers. A seller needs to understand your methodology.
For example: "This comparable sold for $420,000 and is 3,100 sq ft. The subject is 2,900 sq ft. At the market rate of $155/sq ft for lot size, we adjust downward by $31,000, bringing the adjusted comparable value to $389,000."
That transparency builds confidence.
Price Range Recommendation
Don't recommend a single price. Recommend a range. Say something like: "Based on recent market activity, we recommend listing this property between $415,000 and $435,000. The price range reflects current inventory levels, recent sale prices of truly comparable properties, and current market absorption rates."
Give them a range, explain why, and let them feel like they had input into the decision. That's how you get acceptance and move forward. This approach directly supports your broader pricing strategy and negotiation approach.
Market Position Context
Show sellers where their home fits in the current market. Is it a premium property that should be positioned higher? Is it more of a value play? Help them understand their competitive positioning.
Digital Tools and Technology
Modern CMA work relies on technology, but don't let tools replace judgment.
MLS Data Utilization
Your MLS is the foundation of CMA data. Learn the search functions deeply. Know how to filter by price, sold date, square footage, and neighborhood. The more sophisticated your search capabilities, the better your analysis. Many agents also leverage online lead sources to supplement MLS data with buyer interest patterns.
CMA Software Platforms
Platforms like Comparative Market Analysis software (through your board) and third-party tools automate much of the adjustment work. They save time and ensure consistency.
However, don't blindly accept software recommendations. Verify that the adjustments the software used match your market reality. Sometimes the algorithms don't account for local nuances.
Automated Valuation Models (AVMs)
AVMs like Zillow's Zestimate or proprietary brokerage tools can provide a reality check. If your CMA conclusion is dramatically different from a third-party AVM, you might need to reconsider your assumptions.
But remember: AVMs are automated. They don't know about the neighborhood park renovation coming next year, or the new shopping center that just broke ground, or the school district's recent change in boundary lines. Use AVMs as a check, not as the source of truth.
Public Records Integration
Property tax records, deed information, and permitting data add context to your analysis. A home with recent renovation permits is different from one without recent improvements, even if MLS photos aren't updated.
Photo and Map Visualization
Pull photos from MLS listings of your comparables. Show sellers the actual properties you're comparing. Maps with property locations add context and credibility. Some CMA tools generate these automatically; others require manual work.
Common CMA Mistakes to Avoid
You can follow all the methodology above perfectly and still create a CMA that sellers reject. Here are the pitfalls that derail even solid analysis.
Using Outdated Comparables
A sale from nine months ago in a fast-moving market is almost useless. Prices might have shifted 10-15% in that time. Stay current. If you can't find recent comparables, acknowledge that in your analysis and explain why you went back further.
Ignoring Property Condition Differences
You cannot ignore obvious condition differences and maintain credibility. If you're comparing a beautifully maintained home to one that clearly needs work, adjust for it. If you can't adjust fairly, find a different comparable.
Over-Relying on AVMs
I've seen agents use Zillow's estimate as the basis for pricing recommendations. That's a mistake that destroys credibility. Zestimate is a tool, not an analysis.
Cherry-Picking Data to Support the Seller's Price
This is the cardinal sin of CMA work. If a seller says they want $480,000 and the market clearly supports $420,000, don't adjust comparables aggressively to justify their number. You'll win the listing and then lose credibility when the home doesn't move.
Sometimes the hardest part of CMA work is telling a seller the hard truth during the seller qualification process. But that's where trust is built.
Failing to Explain Adjustments
Adjustments without explanation look like data manipulation. Always explain your methodology. Walk through the math. Show your assumptions. Transparency builds confidence even when sellers disagree with your conclusion.
Missing Market Trend Context
A list of comparable sales without market context is just a list. Your CMA should tell a story about whether the market is moving up, down, or sideways, and what that means for pricing strategy.
Advanced CMA Strategies
Once you've mastered the fundamentals, these techniques separate expert CMAs from routine ones.
Micro-Market Segmentation
Instead of analyzing the entire zip code, break it into micro-markets by neighborhood, school district, and geographic zone. This market segmentation approach ensures you're comparing truly similar properties. A home two blocks from the buyer-preferred school district isn't comparable to one in a less-desirable zone, even if they're nearly identical otherwise.
Map out your micro-markets and maintain separate CMA data for each. Your analysis becomes more accurate and more useful for sellers.
Price Per Square Foot Analysis
Create a price-per-square-foot analysis by comparable and time period. Show how price per square foot has moved over the last six months. This reveals market trends that simple price adjustments might miss.
Graph this data. Sellers understand it instantly. "Six months ago, homes in this neighborhood averaged $145/sq ft. Today they're averaging $158/sq ft" tells a clear story.
Competition Positioning Maps
Create visual maps showing where the subject property positions among current listings and recent sales. Is it the least expensive home in the market? The most expensive? Somewhere in the middle?
Visual positioning helps sellers understand exactly where they fit and why that matters for their pricing strategy.
Price Reduction Probability Modeling
Use your historical data to calculate the probability that a home will need a price reduction if listed at a certain price. If homes listed above $450,000 in your neighborhood have a 75% price reduction rate, and homes listed at $430,000 have a 15% price reduction rate, show that analysis.
This data-driven approach to discussing price often resonates with sellers better than subjective arguments.
Multiple Scenario Pricing
Present three scenarios: aggressive (higher price, longer to sell), realistic (sweet spot market acceptance), and conservative (fastest sale, most likely price range). Let sellers choose which scenario matches their goals.
This approach respects seller autonomy while educating them about the tradeoffs in their pricing decision.
Your CMA as the Listing Appointment Differentiator
A comparative market analysis is far more than a document you generate to win a listing appointment. It's the foundation of your credibility as an advisor, your evidence of market expertise, and your tool for setting realistic seller expectations.
When you walk into listing appointments with a CMA that reflects thorough market research, transparent methodology, and honest analysis, sellers notice. They compare it against other agents' analyses and see the difference immediately. They're more likely to hire you, trust your guidance on pricing, and stick with a pricing strategy even when it's challenging.
This CMA expertise becomes even more valuable when working with expired listings or FSBO properties, where sellers may have unrealistic price expectations based on previous failed attempts.
The time you invest in learning CMA methodology pays dividends throughout your career. It positions you as the professional agent who has data to support recommendations, not the agent who's just making guesses.
Learn it well. Practice it consistently. Let your CMAs do the talking in listing appointments.
Learn More
Expand your real estate seller pipeline expertise with these related resources:
- Seller Lead Funnel - Build a systematic approach to attracting and converting seller leads
- Listing Appointment Strategy - Master the appointment where your CMA shines
- Pricing Strategy and Negotiation - Translate CMA insights into effective pricing decisions
- Property Staging and Preparation - Maximize home value before market entry
- Showing Management - Convert listing interest into offers
- Offer Review and Acceptance - Navigate multiple offers and seller decision-making

Senior Operations & Growth Strategist
On this page
- Why CMA Methodology Matters
- The Three-Category Comparable System
- Active Listings (Current Competition)
- Pending Sales (Market Direction)
- Sold Comparables (Market Validation)
- Selecting Quality Comparables: The Criteria That Matter
- Geographic Proximity
- Property Characteristics Matching
- Time Frame Relevance
- Condition and Upgrade Similarity
- Lot Size and Location Premium
- Adjustment Methodology: Making Comparables Actually Comparable
- Square Footage Adjustments
- Bedroom and Bathroom Adjustments
- Lot Size and Land Value
- Condition and Upgrade Factors
- Location and View Premiums
- Garage and Parking Considerations
- Market Trend Analysis: Putting Comparables in Context
- Absorption Rate Calculation
- Inventory Level Assessment
- Price Trend Direction
- Days on Market Patterns
- Seasonal Factor Considerations
- Presenting the CMA for Maximum Impact
- Visual Presentation Design
- Comparable Property Summaries
- Adjustment Explanation Clarity
- Price Range Recommendation
- Market Position Context
- Digital Tools and Technology
- MLS Data Utilization
- CMA Software Platforms
- Automated Valuation Models (AVMs)
- Public Records Integration
- Photo and Map Visualization
- Common CMA Mistakes to Avoid
- Using Outdated Comparables
- Ignoring Property Condition Differences
- Over-Relying on AVMs
- Cherry-Picking Data to Support the Seller's Price
- Failing to Explain Adjustments
- Missing Market Trend Context
- Advanced CMA Strategies
- Micro-Market Segmentation
- Price Per Square Foot Analysis
- Competition Positioning Maps
- Price Reduction Probability Modeling
- Multiple Scenario Pricing
- Your CMA as the Listing Appointment Differentiator
- Learn More