More in
Sales Process Guide
The SDR-to-AE Handoff: How to Write It Down So It Actually Works
Apr 18, 2026
Deal Desk Basics: How Smaller Sales Teams Can Approve and Close Faster
Apr 18, 2026
Commit, Best Case, Pipeline: Defining Forecast Terms Your Whole Team Uses the Same Way
Apr 18, 2026
Win/Loss Analysis Without the Bias: A Repeatable Process for Sales Teams
Apr 18, 2026
Building a Sales Process One Deal Type at a Time
Apr 18, 2026
Multi-Threading Deals Without Annoying Your Champion
Apr 18, 2026
The Mid-Pipeline Slump: How to Diagnose and Fix Stalled Deals
Apr 18, 2026
Mutual Action Plans: When They Help and When They Hurt
Apr 18, 2026
Sales Operating Cadence: From Daily Stand-Up to Quarterly QBR
Apr 18, 2026
Forecast Cadence: Weekly vs. Monthly vs. Continuous — What Works and When
Apr 6, 2026 · Currently reading
Forecast Cadence: Weekly vs. Monthly vs. Continuous, What Works and When
Turn this article into takeaways for your work.
Each assistant summarizes the article only for you and suggests best practices for your work.
A VP of Sales at a 60-person company ran weekly forecast calls for 11 months. Her team's average deal cycle was 62 days. Every Friday at 2pm, she collected updated numbers from her four regional managers. Every Monday morning, at least two of those numbers had changed. By Tuesday, whatever she'd reported to the CEO on Friday was outdated.
The forecast calls weren't producing better visibility. They were producing anxiety and administrative work. Reps were spending 45 minutes every Thursday updating their pipeline to answer the same questions they'd answered the previous Thursday. Nothing in the CRM was different enough to justify the exercise.
She switched to bi-weekly forecasting with a tight monthly review. Forecast accuracy improved. Rep time on CRM admin dropped. And she stopped spending every Friday in a meeting that was changing the answer by Monday.
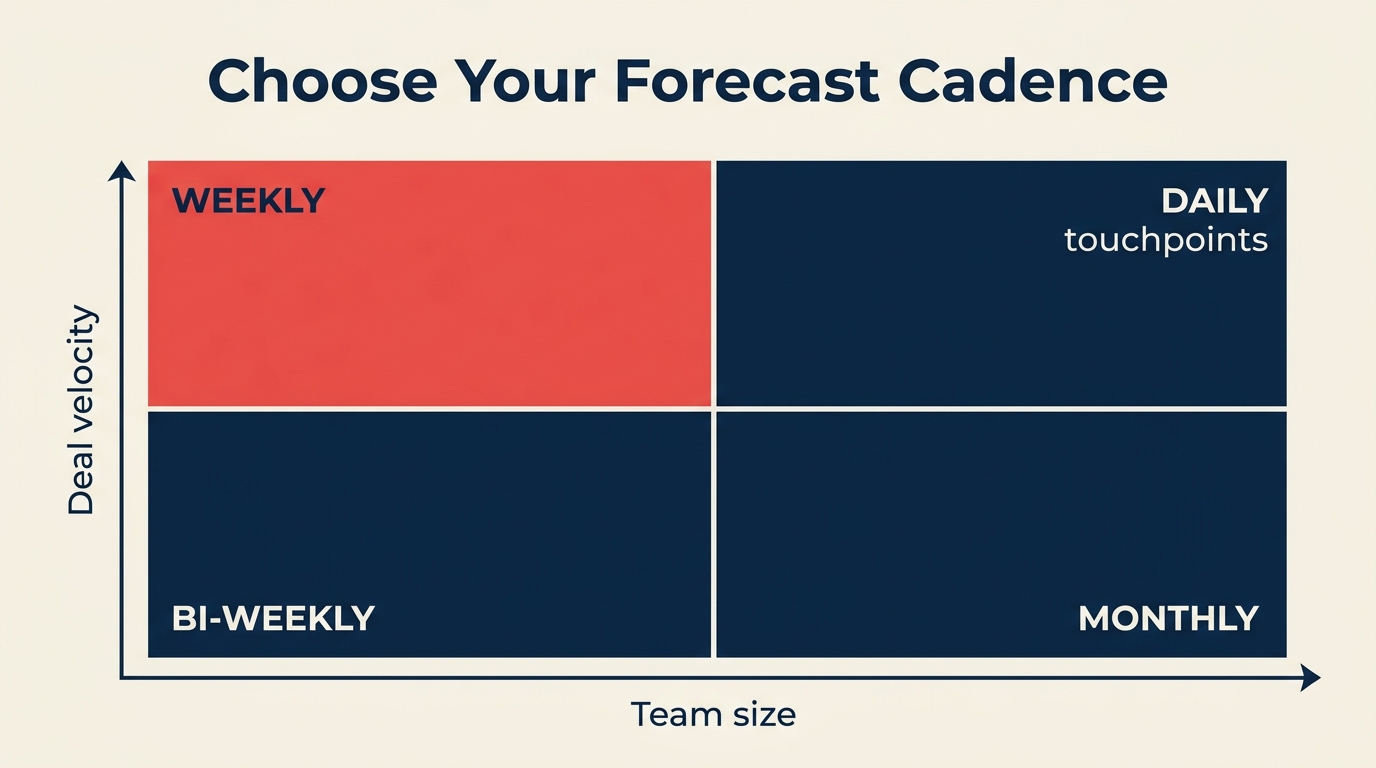
The right forecasting cadence depends on two variables: how many deals your reps are working at once and how long those deals take to close. According to Gartner, fewer than 50% of sales leaders report high confidence in their forecast accuracy, largely because most teams apply the wrong cadence for their deal motion, not because the underlying data is unavoidably noisy. This guide gives you the decision framework and the CRM setup to make it work.
Step 1: The Two-Variable Decision Framework
The right cadence depends on deal movement and forecast volatility, not on a generic weekly meeting template.
Before choosing a cadence, calculate two numbers for your team:
Average active deals per rep per month: Count how many deals each rep has in active pipeline stages (not early prospecting, not nurture) at any given time.
Average sales cycle length: Time from first meaningful qualification call to close, in days. Use the median from your last 20 closed deals, not the mean. Outliers distort it.
Use this matrix to find your starting point:
| Cycle Length / Deals per Rep | Under 5 Active Deals | 5-15 Active Deals | 15+ Active Deals |
|---|---|---|---|
| Under 30 days | Weekly | Weekly | Weekly |
| 30-60 days | Bi-weekly | Bi-weekly or Weekly | Weekly |
| 60-90 days | Monthly | Bi-weekly | Bi-weekly |
| 90+ days | Monthly | Monthly | Monthly |
Two override rules:
Board-reporting companies always forecast monthly at minimum. Even if your deal cycle is 21 days, leadership needs a number to communicate externally. The RevOps perspective on this is worth reading: forecasting discipline for CROs covers how the cadence decision interacts with board reporting expectations at different growth stages. Build a monthly roll-up regardless of your operational cadence. And before choosing cadence, make sure your pipeline stages reflect actual buyer progress — forecasting off activity-based stages produces noise regardless of how often you review.
Teams under 5 reps with a manager deeply involved in every deal can skip formal forecast calls. When the manager knows every deal personally, a 30-minute call adds little information. Keep the CRM updated and review it asynchronously.
Step 2: What a Working Weekly Forecast Looks Like
Weekly forecasting works for high-velocity sales: inside sales, SMB deals under 45 days, SDR-to-AE handoff tracking, or any sales motion where deals move fast enough that last week's number is meaningfully different from this week's.
The core structure is three forecast categories, not stages:
Commit: Deals the rep is willing to stake their credibility on. They've got verbal confirmation from a buyer with authority, a clear close date this week or next, and no unresolved blockers. If a committed deal doesn't close, the rep owes an explanation.
Best Case: Deals that could close this period if one specific thing goes right. The buyer is real, the need is confirmed, but there's still a dependency: a legal review, a final approval, a budget confirmation.
Pipeline: Deals that are qualified and progressing but not likely to close this period. These belong in the forecast for visibility, not for close prediction.
The 15-minute weekly forecast meeting format:
- Each rep shares their commit number first. Manager asks about any that changed since last week.
- Best case numbers are collected. Manager asks what needs to happen for each best case to become a commit by Friday.
- Pipeline is reviewed briefly. Any pipeline deals that have been there for more than one cycle without movement get flagged for stage review.
In HubSpot: create a "Forecast Category" custom deal property with options: Commit, Best Case, Pipeline. Build a saved report filtered by this property and close date within the current period.
In Salesforce: Forecast Categories are a built-in feature. Enable them in Forecast Settings. Make sure "Commit," "Best Case," and "Pipeline" map clearly to your deal stages. Salesforce's standard forecast rollup view will automatically aggregate by category per rep.
In Pipedrive: Pipedrive doesn't have native forecast categories. Use a custom field called "Forecast Tag" and build a saved filter. Alternatively, use probability percentages: 90%+ = Commit, 50-89% = Best Case, under 50% = Pipeline.
Step 3: What a Working Monthly Forecast Looks Like
Monthly forecasting fits enterprise and mid-market sales: cycles of 60-120 days, deals with multiple stakeholders, or any motion where a week-to-week change is too granular to act on.
The structure is a rolling 90-day view rather than a weekly close prediction:
- This month's close: Your committed and best-case deals for the current period.
- Next month's pipeline: Deals expected to enter final stages in 30-60 days, with specific qualification status.
- Quarter end view: A deal-by-deal breakdown of what's needed to hit the quarter target.
The monthly forecast meeting runs 45-60 minutes. Unlike the weekly format, it's worth spending time on deal quality, not just deal count. A typical agenda:
- Review this month's committed deals against target (15 min)
- Identify the 2-3 deals most at risk of slipping to next month. What would prevent the slip? (15 min)
- Review next month's pipeline: is there enough qualified pipeline to close to target next period? (15 min)
- Surface any systemic issues: specific objections recurring, specific competitor winning consistently (15 min)
For monthly forecasting to work, your CRM needs to support a rolling view rather than a static period view. In HubSpot, build a report filtered by "Expected Close Date is in the next 90 days" sorted by close date. In Salesforce, use the Forecast module with a quarterly rollup and a custom view for rolling 90-day pipeline.
When a deal slips from one month to the next, document why. Not in a blame-assignment way. Just so you can see whether slip reasons cluster. If 30% of your "this month" commits slip because legal review takes longer than expected, that's a process issue, not a deal issue. Monthly forecast meetings are also a good time to surface qualification gaps that created false commits — if your MEDDIC score on a deal was incomplete when it entered Commit, that's a pattern worth fixing.
Step 4: Continuous Forecasting
Continuous forecasting means your predicted close number updates automatically as CRM data changes, with no manual collection and no forecast call to gather numbers. It exists on a spectrum from simple rules to full AI prediction.
Rules-based continuous forecasting applies fixed probability weights to stages and sums them automatically. If you have 10 deals in "Proposal" at 40% probability and 5 deals in "Contract Review" at 80% probability, your forecast updates whenever deal stages change. This works in any CRM with basic math.
AI-assisted forecasting uses historical close rate data, deal velocity, engagement signals, and rep-specific conversion rates to predict close probability at the individual deal level. McKinsey research on revenue growth management shows that companies using data-driven forecasting approaches consistently outperform those relying on manual pipeline reviews. The RevOps maturity model maps where continuous forecasting fits in terms of operational readiness. Most teams aren't ready for AI-assisted forecasting until they've cleared stages 2 and 3 of that model. Tools like Salesforce Einstein Forecasting, HubSpot's AI forecast features (available in Sales Hub Enterprise), Clari, Gong Forecast, and Prophix are built for this. These work well when you have at least 12 months of historical closed deal data and clean CRM hygiene.
When does continuous forecasting make sense?
- Your team has 100+ deals in pipeline at any time (manual review doesn't scale)
- You have clean CRM data going back at least 12 months
- Someone on the team owns forecast accuracy as a KPI and will tune the model over time
- You can afford the tooling ($15K-$50K/year for dedicated forecast tools)
When it doesn't make sense:
- You have under 50 active deals in pipeline (a weekly review is cheaper and more accurate)
- Your CRM data is inconsistent (AI learns from bad data and produces bad predictions)
- Your sales cycle has high variance (a model built on 30-day cycles misbehaves on deals that occasionally run 120 days)
For most teams under 20 reps, start with manual cadence and move to continuous only after your CRM hygiene and historical data are in good shape.
Step 5: Building Forecast Categories in Your CRM
The practical part. Here's how to set up the three-category system in the most common CRMs.
HubSpot setup:
- Go to Settings > Properties > Deal Properties, create a new property called "Forecast Category" with type: dropdown
- Add options: Commit, Best Case, Pipeline, Omit (for deals you want to exclude)
- Build a deal view filtered by "Forecast Category is Commit or Best Case" + "Close Date is this month"
- Create a dashboard report that sums Expected Revenue by Forecast Category
- Train reps to update Forecast Category every time they update close date
Salesforce setup:
- Enable Forecast Types in Setup > Forecasts Settings
- Confirm your Stage-to-Forecast Category mapping: stages at 90%+ probability should map to Commit; 50-89% to Best Case; below 50% to Pipeline
- Use the Forecast tab (Collaborative Forecasting) to view rollups by rep and by period
- Add the Forecast Category field to your standard opportunity views so reps see it during normal deal work
Pipedrive setup:
- Go to Settings > Data Fields > Deals, add a custom field called "Forecast Tag" (type: dropdown)
- Add options: Commit, Best Case, Pipeline
- Create a custom filter: Forecast Tag = Commit OR Best Case AND Expected Close Date = this month
- Save this filter as a view accessible to managers
- Set a team norm: Forecast Tag should be updated when close date is updated
Close (CRM) setup:
Close has built-in opportunity tracking with opportunity value, expected close date, and confidence. Map High Confidence (80%+) to Commit, Medium (50-79%) to Best Case, and Low to Pipeline. Use the Opportunities report filtered by this quarter's close dates.
Step 6: The Manager's Forecast Call Format
Whatever cadence you choose, the manager's review call should follow the same format. The goal is to surface surprises before they become problems, not to ratify a number that was already calculated.
Three questions, 20 minutes:
- "What's your commit for this period, and what could kill each one?" (7 minutes)
- "What would push your best case up to commit this week or this month?" (7 minutes)
- "What's the biggest risk to your number that I don't know about?" (6 minutes)
The last question is the most important. Every rep has a deal they're not sure how to frame or a risk they're minimizing in their own mind. Asking for the thing you don't know about creates a safe way to surface it.
Don't use the forecast call to review the full pipeline. The weekly pipeline review handles that. This call is for the number and the risks to the number.
Step 7: Improving Forecast Accuracy Over Time
Forecast accuracy doesn't improve just from running calls. It improves from tracking called vs. closed and having honest conversations about the gap.
Track these metrics monthly:
- Called (what you committed to at start of period) vs. Closed (what actually closed)
- The gap between them (positive or negative) as a percentage of target
- Which rep or deal type contributed most to the miss or beat
Share these numbers with your team. Not as a performance review, but as a calibration exercise. If you consistently close 15% below what you commit, your commits are too optimistic. If you consistently close 10% above, you have sandbagging. That sounds good but it means you're leaving opportunity on the table in resource allocation.
Reward accuracy, not optimism. A rep who calls $200K and closes $195K is more valuable for forecasting than one who calls $300K and closes $240K. The first rep gives you actionable information. The second gives you hope. Harvard Business Review research on forecasting accuracy argues that the biggest driver of forecast error isn't bad data. It's the cultural norm of rewarding optimism over honesty, which leads reps to inflate commit calls rather than surface risk early.
Common Pitfalls
Forecasting off pipeline volume, not buyer signals. "We have $2M in pipeline, target is $800K, so we'll be fine" is not a forecast. It's arithmetic applied to an uncertain number. Forecast from committed buyer behaviors, not pipeline accumulation.
Never updating the forecast call if it's "basically the same." The value of a forecast call is the conversation, not the number. Even if your commit is unchanged from last week, the conversation about what could disrupt it is worth having.
CRM data that doesn't support the cadence. If you're running weekly forecasting but reps update their CRM monthly, your weekly forecast is always wrong. If poor data hygiene is a recurring problem, the pipeline hygiene culture piece covers how ops teams build sustainable update habits rather than relying on enforcement. Match your data update expectations to your cadence. Weekly forecast = reps update CRM before every weekly review. Monthly forecast = reps update before every monthly review.
Changing categories mid-period. If you let reps move deals between Commit and Best Case after the period opens, the categories lose meaning. Set a rule: forecast categories lock at the start of each period for the committed number. Changes are allowed but must be documented with a reason.
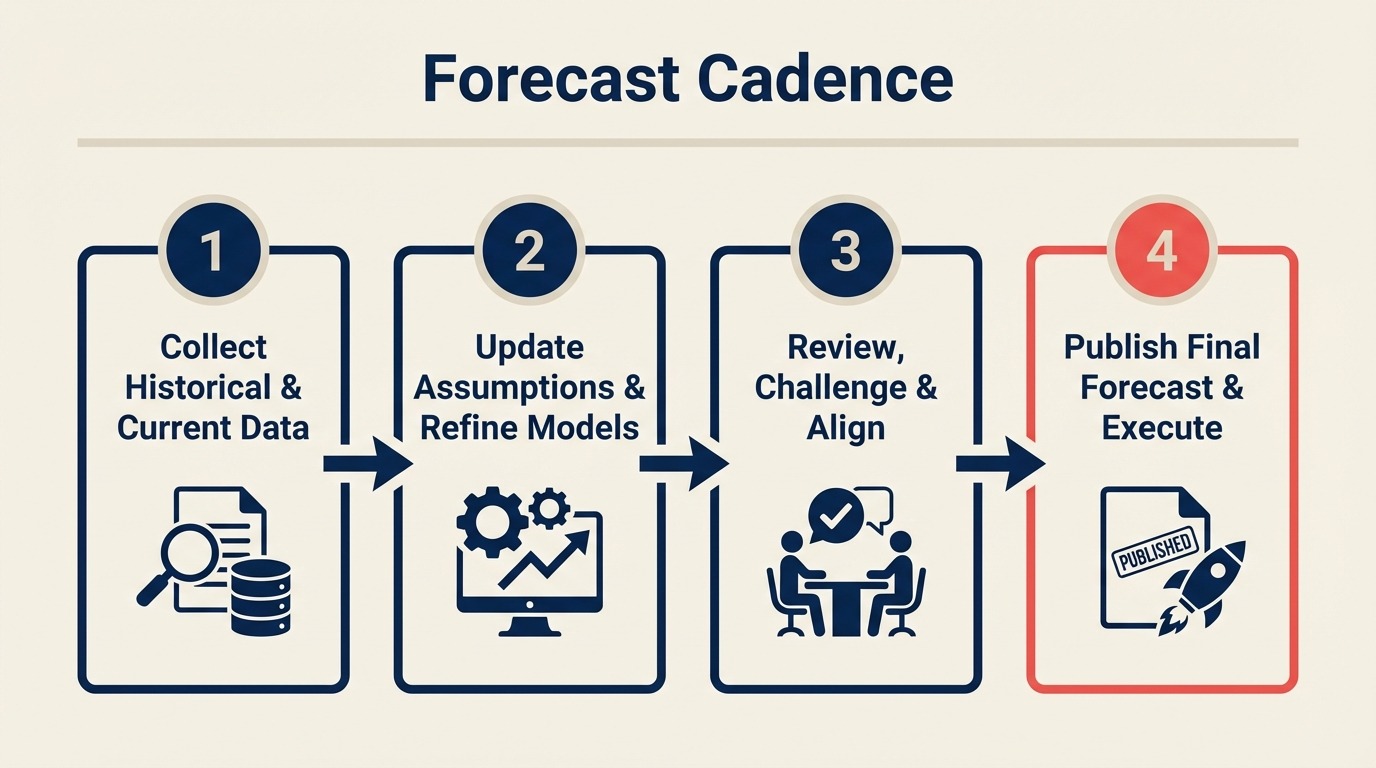
What to Do Next
Pick a cadence based on the decision matrix. Set it up in your CRM using the steps above. Run it for one full quarter without changing it. If you're setting up forecasting for the first time alongside a CRM implementation, configure the forecast category fields and stage probabilities during rollout rather than retrofitting them later. It saves significant rework.
At the end of the quarter, compare predicted close (from your first forecast of the quarter) to actual close. Calculate the accuracy gap as a percentage. Under 10% gap means your cadence and data quality are working. Over 20% means either your categories aren't being applied honestly or your stage data is wrong.
One quarter of data tells you whether your system is calibrated. Two quarters tells you whether your reps are using it correctly. Don't draw conclusions from less than a full quarter. There are too many one-time variables. If you want broader context on how CROs think about forecast as a leadership discipline, the first 90 days as a sales leader guide covers how new leaders assess and reset forecast systems when they join a team.
Learn More

Co-Founder, Rework.com
On this page
- Step 1: The Two-Variable Decision Framework
- Step 2: What a Working Weekly Forecast Looks Like
- Step 3: What a Working Monthly Forecast Looks Like
- Step 4: Continuous Forecasting
- Step 5: Building Forecast Categories in Your CRM
- Step 6: The Manager's Forecast Call Format
- Step 7: Improving Forecast Accuracy Over Time
- Common Pitfalls
- What to Do Next
- Learn More