What is Break-Even Point? The Magic Number Every Business Must Know
Turn this article into takeaways for your work.
Each assistant summarizes the article only for you and suggests best practices for your work.
A founder once told me, "We'll be profitable next month!"
"What's your break-even point?" I asked.
Silence. Then: "Well, when we make more than we spend..."
Eighteen months later, still losing money, they finally calculated it. Turns out they needed 3x their current sales. The business folded two months later.
Break-Even Point: Your Profitability GPS
Break-Even Point = Where Total Revenue Equals Total Costs
It's the exact moment your business stops losing money and starts making it:
- Below break-even = Losing money
- At break-even = Zero profit/loss
- Above break-even = Making money
Know this number, or die trying to find it.
The Two Break-Even Formulas You Need
1. Units Break-Even
How many units must you sell?
Break-Even Units = Fixed Costs ÷ (Price per Unit - Variable Cost per Unit)
Example:
- Fixed costs: $10,000/month (rent, salaries)
- Price per unit: $100
- Variable cost: $40 (materials, shipping)
- Contribution margin: $60
Break-even = $10,000 ÷ $60 = 167 units/month
2. Revenue Break-Even
How much revenue do you need?
Break-Even Revenue = Fixed Costs ÷ Contribution Margin Ratio
Where: Contribution Margin Ratio = (Price - Variable Cost) ÷ Price
Example:
- Fixed costs: $10,000
- Contribution margin ratio: 60%
Break-even = $10,000 ÷ 0.60 = $16,667/month
The Hidden Complexity Most Miss
Your break-even isn't one number. It's a moving target:
The Startup Break-Even Evolution
Month 1: Break-even at 100 units (low fixed costs) Month 6: Break-even at 250 units (hired team) Month 12: Break-even at 400 units (office + equipment) Month 18: Break-even at 300 units (efficiency gains)
Track monthly or get surprised.
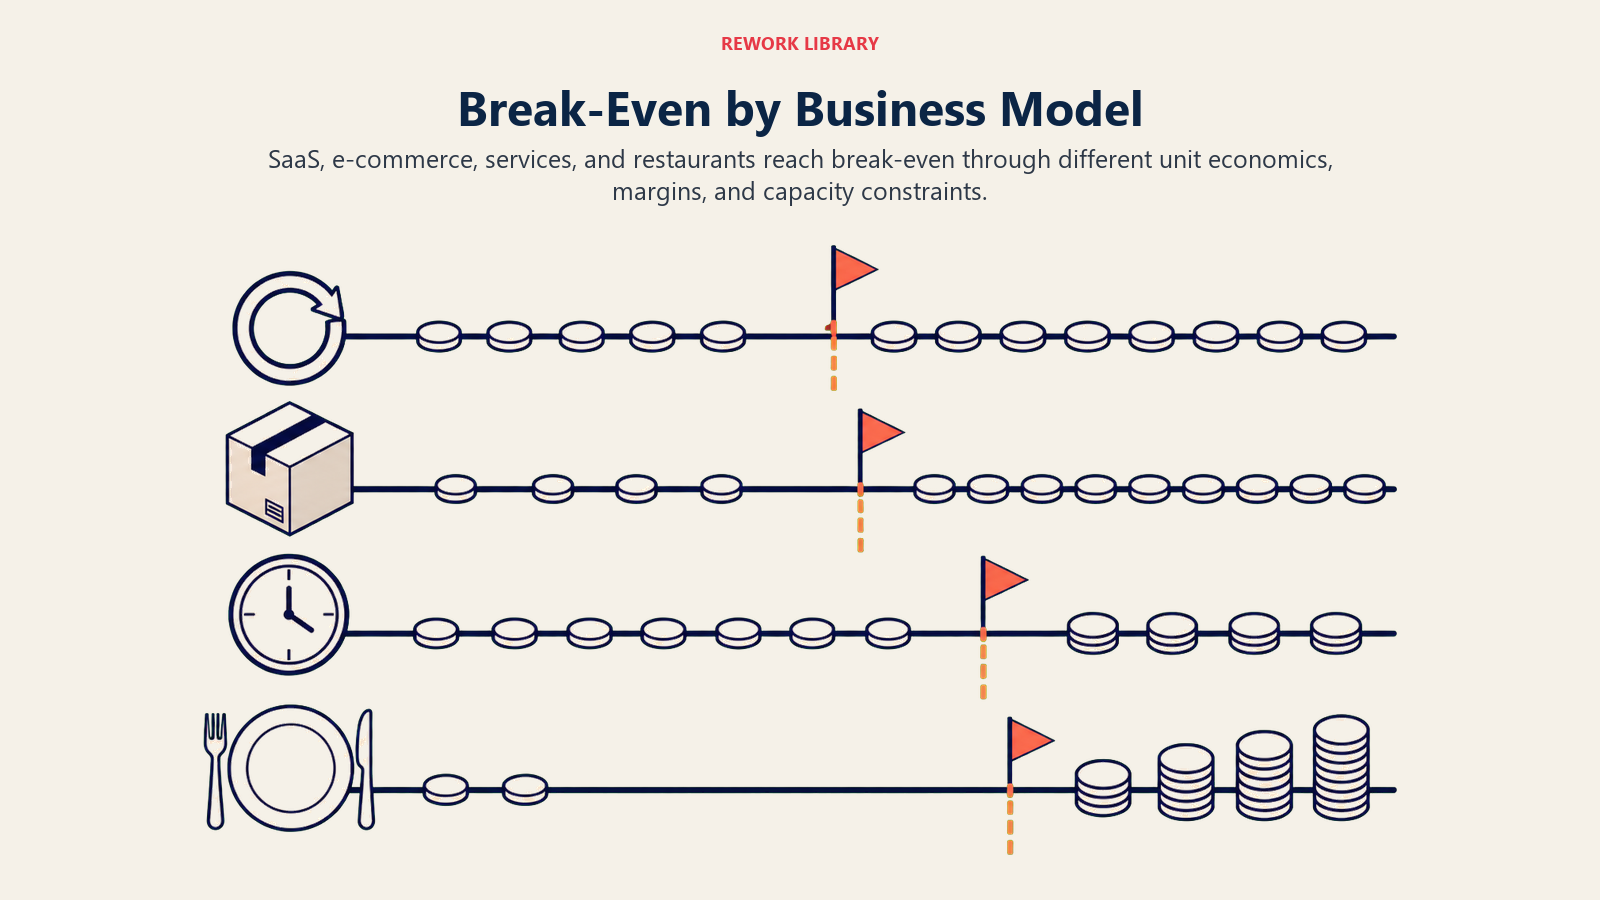
Break-Even by Business Model
The threshold changes with the economic unit, margin structure, and capacity constraint that define each business model.
SaaS Companies
Formula: Fixed Costs ÷ (ARPU - Cost to Serve)
Typical numbers:
- Fixed costs: $50,000-200,000/month
- ARPU: $50-500
- Cost to serve: $10-50
- Break-even: 200-2,000 customers
Key insight: Long payback periods mean cash break-even lags accounting break-even
E-commerce
Formula: Fixed Costs ÷ (AOV × Gross Margin % - Fulfillment Cost)
Typical numbers:
- Fixed costs: $20,000-100,000/month
- AOV: $50-200
- Gross margin: 40-60%
- Break-even: 1,000-5,000 orders/month
Key insight: Returns can push break-even 20-30% higher
Professional Services
Formula: Fixed Costs ÷ (Hourly Rate - Direct Costs) × Utilization %
Typical numbers:
- Fixed costs: $30,000-150,000/month
- Hourly rate: $100-300
- Utilization: 60-80%
- Break-even: 300-1,000 billable hours/month
Key insight: Utilization rate is everything
Restaurants
Formula: Fixed Costs ÷ (Average Check × Margin % - Labor per Cover)
Typical numbers:
- Fixed costs: $40,000-150,000/month
- Average check: $25-100
- Food cost: 30-35%
- Break-even: 2,000-8,000 covers/month
Key insight: Labor is often 30%+ of revenue
The Break-Even Analysis That Changes Everything
Scenario Planning
Base Case: Current pricing and costs
- Break-even: 500 units
Price Increase 10%:
- New break-even: 420 units (16% fewer!)
Cost Reduction 10%:
- New break-even: 450 units (10% fewer)
Both:
- New break-even: 375 units (25% fewer!)
Lesson: Small changes compound dramatically.
Multi-Product Break-Even
Real businesses sell multiple products. Here's how to calculate:
Weighted Average Method
- Calculate contribution margin for each product
- Weight by sales mix
- Apply to total fixed costs
Example:
- Product A: 60% of sales, $40 margin
- Product B: 30% of sales, $20 margin
- Product C: 10% of sales, $100 margin
Weighted margin = (0.6 × $40) + (0.3 × $20) + (0.1 × $100) = $40
Fixed costs $40,000 ÷ $40 = 1,000 total units
The Cash vs Accounting Break-Even Trap
Accounting Break-Even
Revenue = All expenses (including depreciation) Example: You're "profitable" on paper
Cash Break-Even
Cash in = Cash out Example: But you can't pay bills
The Difference
- Customer pays Net 60
- You pay suppliers Net 30
- Result: Profitable but bankrupt
Always calculate both. Cash is king.
Dynamic Break-Even Factors
Factors That Lower Break-Even
- Price increases (Most powerful)
- Variable cost reduction (Negotiate better)
- Fixed cost reduction (Cut carefully)
- Mix shift (Sell more high-margin)
- Volume discounts (But watch cash)
Factors That Raise Break-Even
- Competition (Price pressure)
- Expansion (Higher fixed costs)
- Quality improvements (Higher variable costs)
- Market changes (Demand shifts)
- Regulatory costs (Compliance)
Your Break-Even Dashboard
Daily Tracking
- Units/revenue vs break-even
- Current run rate
- Days to break-even this month
Weekly Analysis
- Contribution margin trends
- Fixed cost creep
- Price realization
- Mix shifts
Monthly Strategy
- Break-even sensitivity analysis
- Scenario planning
- Investment decisions
- Pricing strategy
Common Break-Even Mistakes
Mistake 1: Forgetting Hidden Costs
Calculated break-even: 100 units Reality with all costs: 150 units Common misses: Returns, chargebacks, spoilage
Mistake 2: Linear Thinking
Assuming costs stay flat with volume Reality: Step functions everywhere Example: Need new warehouse at 80% of "break-even"
Mistake 3: Ignoring Seasonality
Annual break-even: 1,200 units/month December reality: Need 2,000 January reality: Only sell 400
Mistake 4: The Growth Investment Paradox
Hit break-even → Invest in growth → Break-even moves higher → Repeat Result: Perpetually unprofitable
Break-Even Optimization Strategies
The 20% Rule
Aim for break-even at 80% of realistic capacity Why: Leaves room for:
- Seasonality
- Market fluctuations
- Growth investment
- Operational issues
The Portfolio Approach
- Loss leaders: Below break-even (strategic)
- Core products: At 2x break-even (stable)
- Premium products: At 5x break-even (profit)
Total: Healthy margins
The Time-Based Strategy
- Month 1-6: Focus on unit economics
- Month 7-12: Drive to break-even
- Month 13-18: Optimize margins
- Month 19+: Scale profitably
Your 30-Day Break-Even Action Plan
Week 1: Calculate Reality
- List ALL fixed costs
- Calculate TRUE variable costs
- Determine accurate pricing
- Find current break-even
Week 2: Analyze Gaps
- Compare current sales to break-even
- Calculate time to break-even
- Identify biggest cost drivers
- Model improvement scenarios
Week 3: Implement Changes
- Test price increases
- Cut unnecessary costs
- Improve product mix
- Negotiate with suppliers
Week 4: Build Systems
- Create break-even dashboard
- Set up daily tracking
- Establish review rhythm
- Plan next improvements
The Strategic Power of Break-Even
Knowing your break-even enables:
Better Decisions:
- Should we hire? (Impact on break-even)
- Launch new product? (Separate break-even)
- Enter new market? (Market-specific break-even)
Clearer Communication:
- With investors: "We need X to reach break-even"
- With team: "We're Y units from profitability"
- With yourself: "This is working/not working"
Faster Reactions:
- Market changes? Recalculate immediately
- Cost increases? Know impact instantly
- Competition? Understand your flexibility
Your Break-Even Reality Check
Answer these questions:
- What's your break-even in units?
- What's your break-even in revenue?
- How far are you from it?
- What's your path to get there?
- What could derail you?
If you can't answer all five in 30 seconds, you're flying blind.
Break-even isn't just a number. It's your business's line between survival and death. Between dreams and reality. Between funding and profit.
Know your number. Hit your number. Then blow past it.
Because breaking even isn't the goal, it's the starting line.
Ready to improve profitability? Master Contribution Margin for deeper analysis or explore Pricing Strategy to lower your break-even faster.
Part of the [Business Terms Collection]. Last updated: 2026-07-21
On this page
- Break-Even Point: Your Profitability GPS
- The Two Break-Even Formulas You Need
- 1. Units Break-Even
- 2. Revenue Break-Even
- The Hidden Complexity Most Miss
- The Startup Break-Even Evolution
- Break-Even by Business Model
- SaaS Companies
- E-commerce
- Professional Services
- Restaurants
- The Break-Even Analysis That Changes Everything
- Scenario Planning
- Multi-Product Break-Even
- Weighted Average Method
- The Cash vs Accounting Break-Even Trap
- Accounting Break-Even
- Cash Break-Even
- The Difference
- Dynamic Break-Even Factors
- Factors That Lower Break-Even
- Factors That Raise Break-Even
- Your Break-Even Dashboard
- Daily Tracking
- Weekly Analysis
- Monthly Strategy
- Common Break-Even Mistakes
- Mistake 1: Forgetting Hidden Costs
- Mistake 2: Linear Thinking
- Mistake 3: Ignoring Seasonality
- Mistake 4: The Growth Investment Paradox
- Break-Even Optimization Strategies
- The 20% Rule
- The Portfolio Approach
- The Time-Based Strategy
- Your 30-Day Break-Even Action Plan
- The Strategic Power of Break-Even
- Your Break-Even Reality Check